. 2019 Aug 12;129(9):3807-3820.
doi: 10.1172/JCI126655.

Roles of HIFs and VEGF in angiogenesis in the retina and brain

Affiliations

Roles of HIFs and VEGF in angiogenesis in the retina and brain

Amir Rattner et al. J Clin Invest. .

Abstract

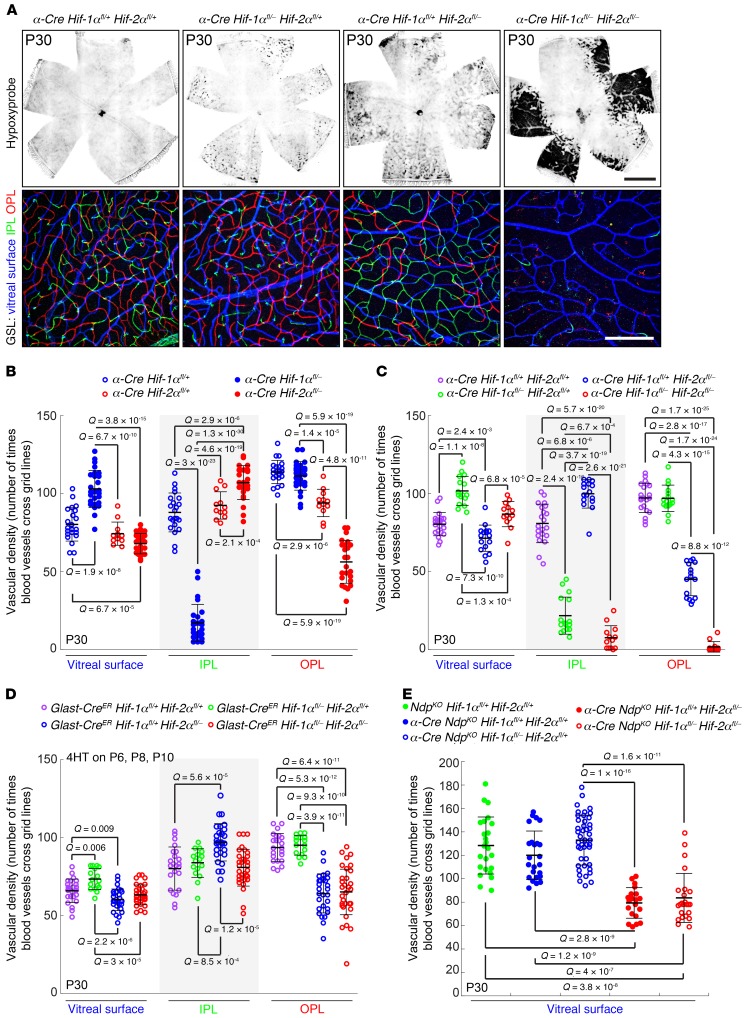
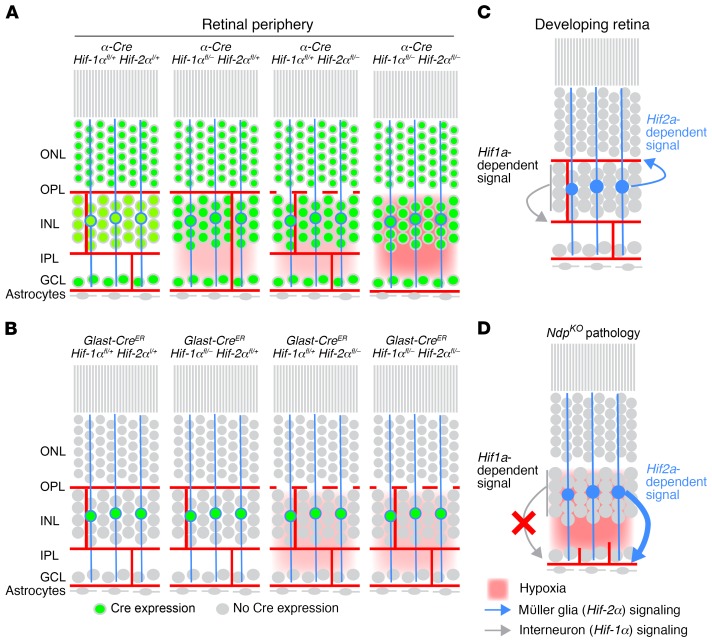
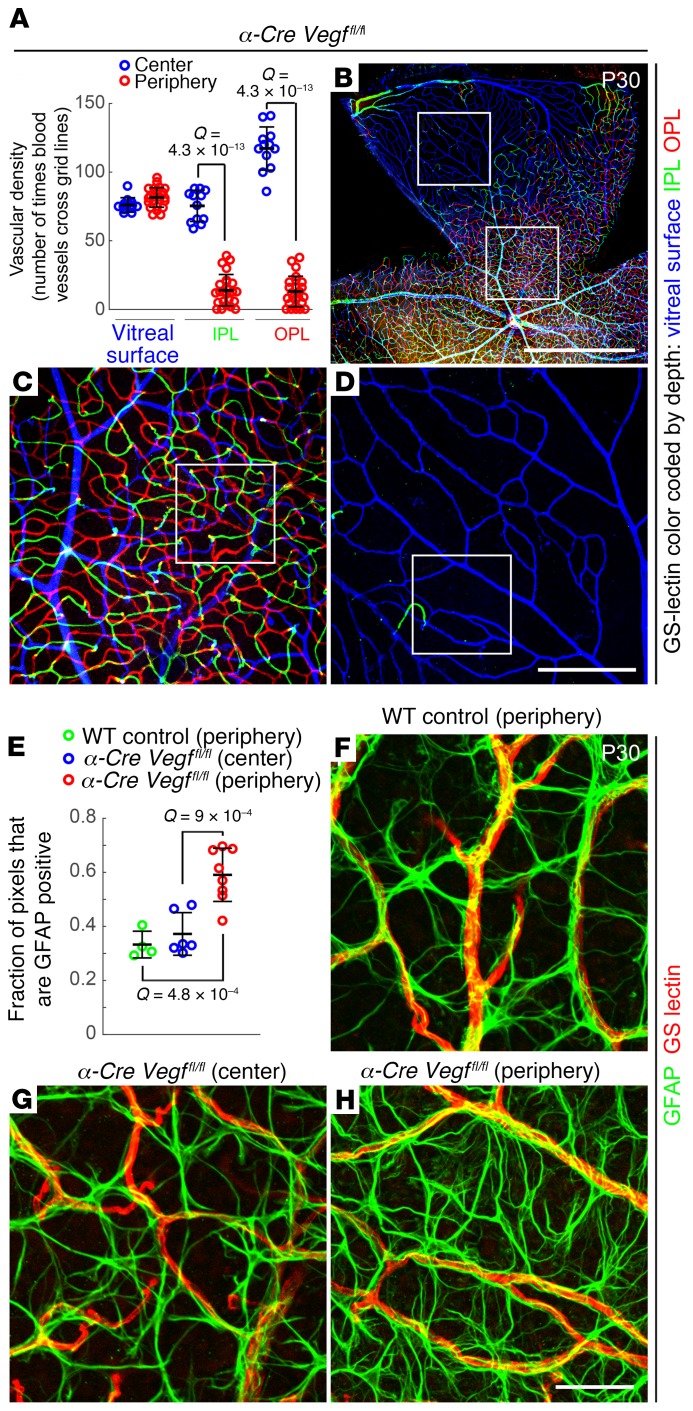
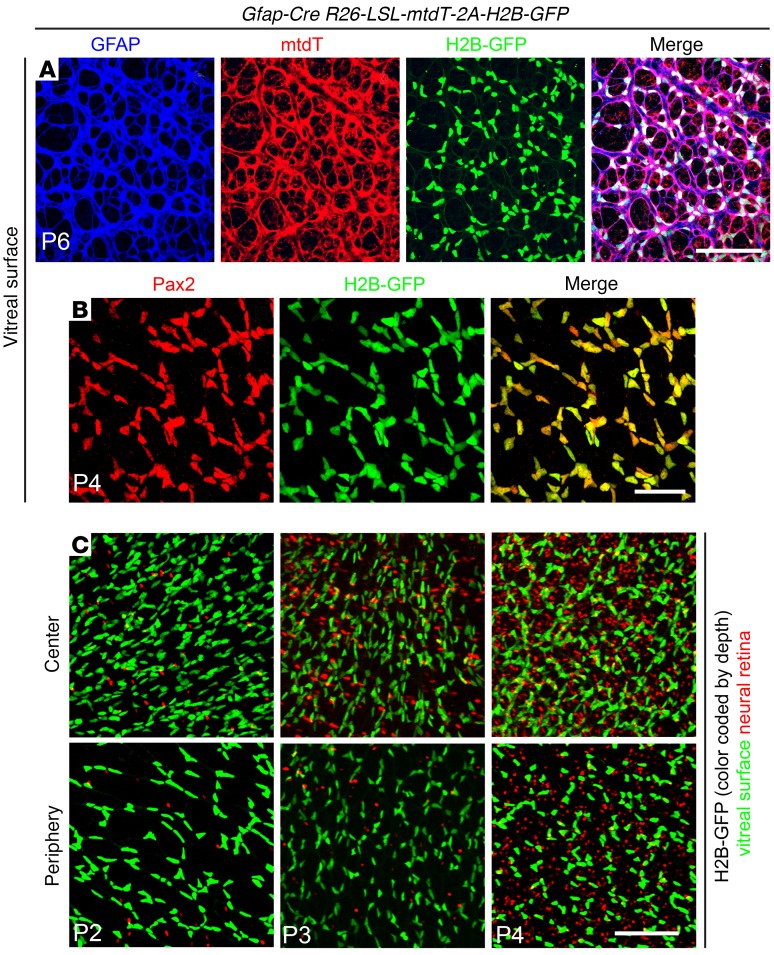
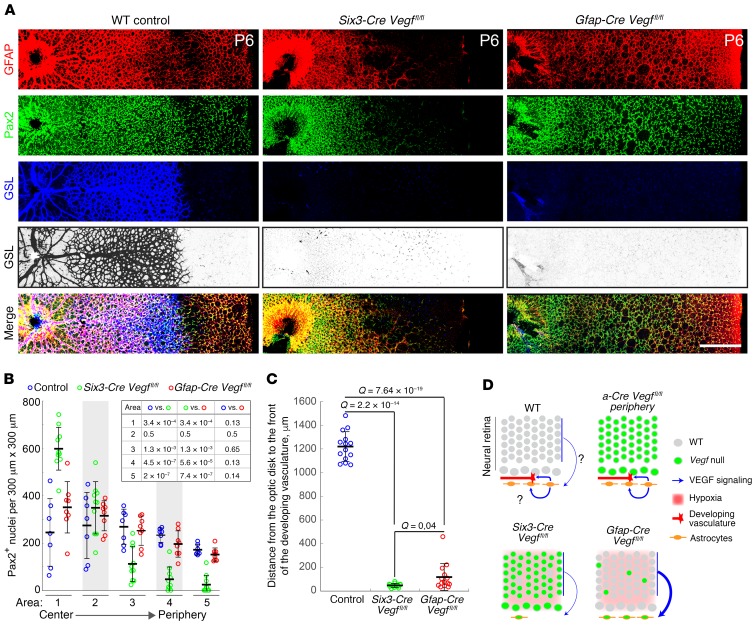
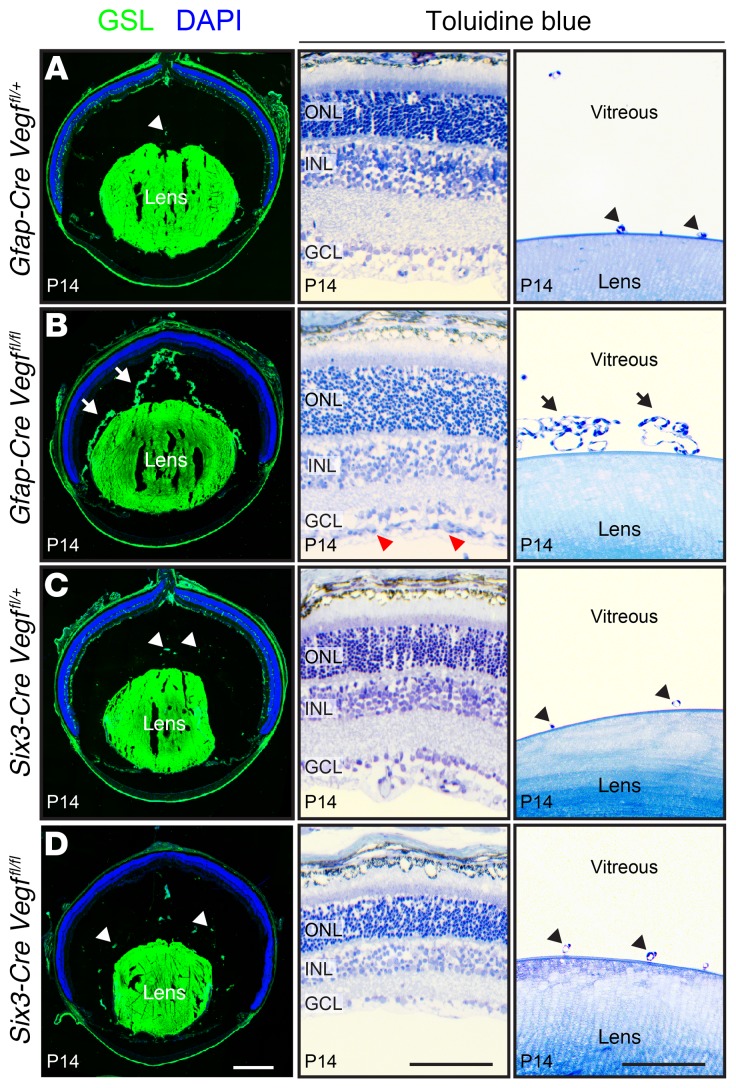
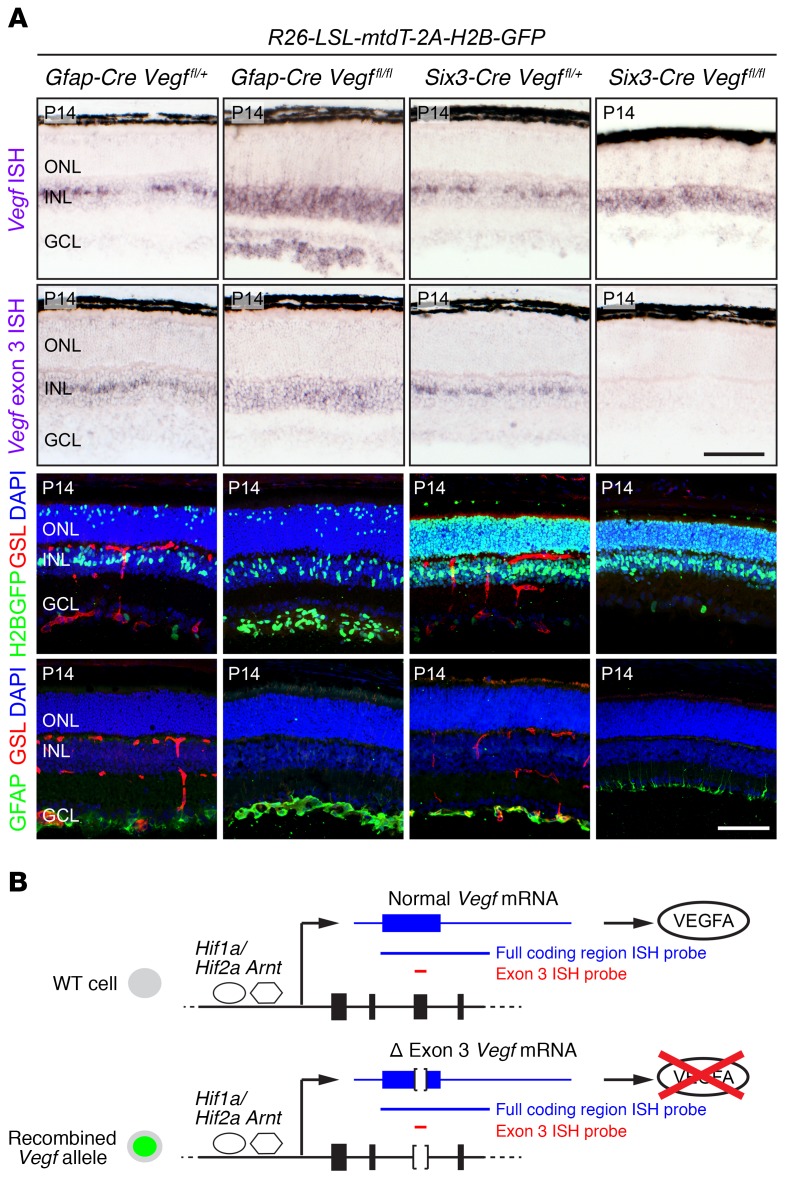
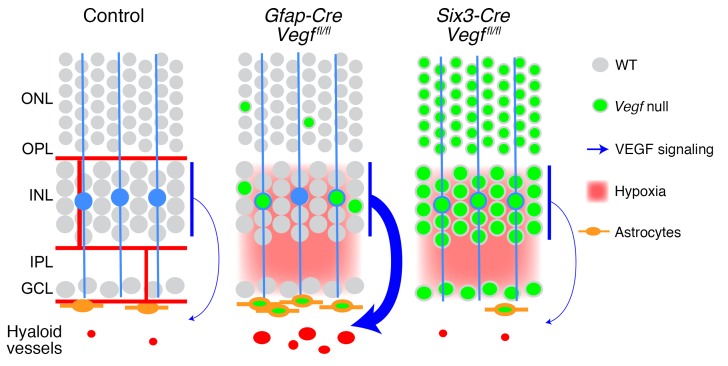
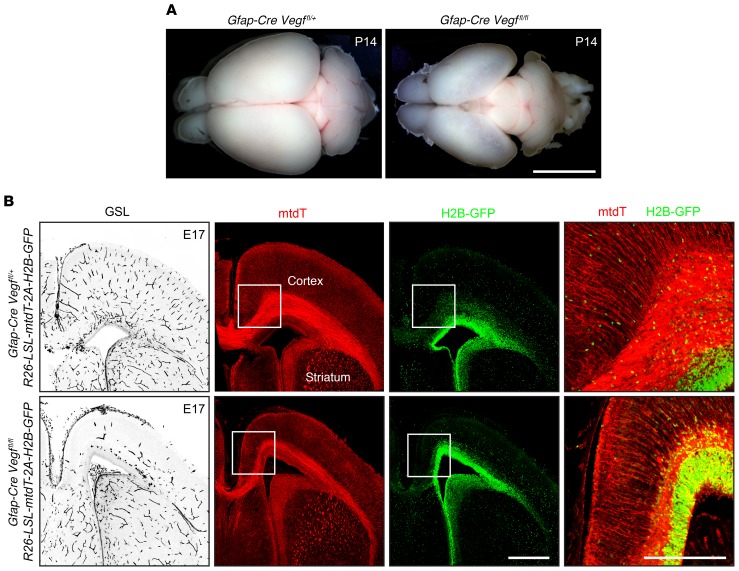
Vascular development in the mammalian retina is a paradigm for CNS vascular development in general, and its study is revealing fundamental mechanisms that explain the efficacy of antiangiogenic therapies in retinal vascular disease. During development of the mammalian retina, hypoxic astrocytes are hypothesized to secrete VEGF, which attracts growing endothelial cells as they migrate radially from the optic disc. However, published tests of this model using astrocyte-specific deletion of Vegf in the developing mouse retina appear to contradict this theory. Here, we report that selectively eliminating Vegf in neonatal retinal astrocytes with a Gfap-Cre line that recombines with approximately 100% efficiency had no effect on proliferation or radial migration of astrocytes, but completely blocked radial migration of endothelial cells, strongly supporting the hypoxic astrocyte model. Using additional Cre driver lines, we found evidence for essential and partially redundant actions of retina-derived (paracrine) and astrocyte-derived (autocrine) VEGF in controlling astrocyte proliferation and migration. We also extended previous studies by showing that HIF-1α in retinal neurons and HIF-2α in Müller glia play distinct roles in retinal vascular development and disease, adding to a growing body of data that point to the specialization of these 2 hypoxia-sensing transcription factors.

Keywords: Development; Vascular Biology; endothelial cells.


Conflict of interest statement

Conflict of interest: JN is a paid consultant for Cerevance and Atengen.

Figures

Figure 1
Figure 1. Distinctive vascular phenotypes result from eliminating Hif-1α, Hif-2α, or both Hif-1α and Hif-2α in developing retinal progenitors or Müeller glia.
(A) Top panels, P30 whole retina flat mounts from the indicated genotypes stained for Hypoxyprobe (black), which accumulates in hypoxic regions of retina. The α-Cre Hif-1αfl/+ Hif-2αfl/+ retina (left panel) is a phenotypically normal control. Scale bar, 1 mm. Bottom panels, high-magnification images from the peripheral retina, where the α-Cre transgene is expressed, showing GSL-stained vasculature. The GSL signal is color coded by depth with the vitreal surface in blue, the IPL in green, and the OPL in red. Scale bar: 200 μm. (BD) Quantification of the vascular density in the peripheral retina for each of the 3 vascular layers (vitreal surface, IPL, and OPL) following α-Cre (B and C) or Glast-CreER (D) mediated deletion of the indicated Hif-1α and/or Hif-2α alleles. Each symbol represents the quantification from one 500-μm × 500-μm square area. For activation of CreER in the Glast-CreER mice, each mouse received 3 doses of 200-μg 4HT, delivered at P6, P8, and P10. In this and all other figures; data show the mean ± SD, and Q values were calculated with a 2-tailed unequal variance t test adjusted for multiple comparisons using the method of Benjamini and Hochberg (52). (E) Quantification of the surface vascular density in the peripheral retina following α-Cre–mediated recombination of the indicated Hif-1α and/or Hif-2α alleles in an NdpKO background. Ndp is X-linked and the NdpKO retinas studied here were hemizygous for the KO allele. Each symbol represents the quantification from one 500-μm × 500-μm square area.
Figure 2
Figure 2. Complementary roles for Hif-1α and Hif-2α in the development of intraretinal capillaries.
(A and B) The principal cell layers of the adult retina, with neuronal and astrocyte cell bodies (grey), Müller glia cell bodies and processes (blue circles and vertical lines), retinal vasculature (red lines), extent of hypoxia (red background), and presence of Cre-mediated recombination (green circles; representing Cre activation of a nuclear localized GFP reporter). Summary phenotypes are shown for α-Cre (A) or Glast-CreER (B) mediated deletion of the indicated Hif-1α and/or Hif-2α alleles. (C and D) Retinal schematics as in A and B showing the cellular sources, vascular targets, and relative strengths of Hif-1α–dependent and Hif-2α–dependent proangiogenic signals during the final phase of retinal development (C) and in response to hypoxia in the mature NdpKO retina (D).
Figure 3
Figure 3. Loss of intraretinal but not surface vasculature with loss of intraretinal VEGF.
(AD) Vascular density in α-Cre Vegffl/fl retinas at P30. (A) Quantification of vascular density in the center (blue; little or no Cre-mediated recombination) and periphery (red; intraretinal Cre-mediated recombination) for each of the 3 vascular layers (vitreal surface, IPL, and OPL) in α-Cre Vegffl/fl retinas. In A, each symbol is the quantification from one 500-μm × 500-μm area; bars represent the mean ± SD and Q values were calculated with a 2-tailed unequal variance t test adjusted for multiple comparisons using the method of Benjamini and Hochberg (52). (BD) GSL-stained vasculature at low magnification (B) and at intermediate magnification (C) and (D), corresponding, respectively, to the lower and upper labeled squares in B. The GSL signal is color coded by depth with the vitreal surface in blue, the IPL in green, and the OPL in red. Scale bars: 1 mm (B)and 200 μm (D). (EH) Surface astrocyte density in α-Cre Vegffl/fl retinas at P30. E shows the quantification of the density of astrocyte processes (GFAP immunostaining) in the periphery of a WT retina (green) and in the center (blue) and periphery (red) of α-Cre Vegffl/fl retinas. Each symbol is the quantification from one 200-μm × 200-μm area; bars represent the mean ± SD, and Q values were calculated with a 2-tailed unequal variance t test adjusted for multiple comparisons using the method of Benjamini and Hochberg (52). Examples of the vitreal surface of WT peripheral retina and α-Cre Vegffl/fl central and peripheral retina following GFAP and GSL staining are shown at high magnification in FH (scale bar: 50 μm). Images in G and H correspond to the labeled squares in C and D, respectively.
Figure 4
Figure 4. Highly efficient Cre-mediated recombination in early postnatal retinal astrocytes by the Messing Gfap-Cre line, as seen in retina flat mounts from Gfap-Cre R26-LSL-mtdT-2A-H2B-GFP retinas between P2 and P6.
(A and B) Retinas imaged at the vitreal surface and showing GFAP, mtdT, and H2B-GFP at P6 (A) and Pax2 and H2B-GFP at P4 (B). (C) H2B-GFP at the vitreal surface (green) and in the neural retina (red) at P2, P3, and P4. Highly efficient recombination in surface astroctyes is followed by scattered recombination in cells that are deeper within the neural retina. See Figure 7A for a cross-sectional view. Scale bars: 100 μm (A), 50 μm (B), and 100 μm (C).
Figure 5
Figure 5. Loss of astrocyte-derived VEGF eliminates radial EC migration during retinal development.
(A) Flat mounts of WT, Six3-Cre Vegffl/fl, and Gfap-Cre Vegffl/fl retinas at P6, immunostained for astrocytes (GFAP and Pax2) and ECs (GSL). The latter is shown both in color and, for further clarity, in black and white with intensities inverted. The optic disc is at the left of each image, and the peripheral edge of the retina is at the far right. Scale bar: 400 μm. (B) Quantification of astrocyte radial migration at P6. The number of Pax2+ nuclei was counted in radial strips divided into five contiguous 300-μm × 300-μm squares, from the retinal center to the periphery. Each symbol shows the Pax2+ nuclear counts from 1 square; data show the mean ± SD. Seven to 10 radial strips were quantified per genotype. Q values for pairwise comparisons, calculated using 2-tailed unequal variance t test adjusted for multiple comparisons using the method of Benjamini and Hochberg (52), are presented in the inset table. (C) Quantification of EC radial migration at P6. The radial distance from the center of the retina to the growing vascular front (based on GSL staining) was measured on 4 to 8 retinas per genotype, for a total of 14 measurements per genotype. Data show the mean ± SD, and Q values were calculated with a 2-tailed unequal variance t test adjusted for multiple comparisons using the method of Benjamini and Hochberg (52). (D) Schematics of early postnatal retinas showing the cellular sources, vascular targets, and relative strengths of VEGF signaling inferred from the phenotypes of retinas with the indicated genotypes. Symbols are defined to the right of the 4 schematics. A question mark indicates uncertainty regarding the existence or strength of a VEGF signal. The neural retina is shown as it appears at approximately P3, with a ganglion cell layer that is distinct from an outer layer encompassing neuroblasts and future INL/ONL cells. Representative images are shown from experiments with 4 or more eyes per genotype.
Figure 6
Figure 6. Persistent hyaloid vasculature in eyes without astrocyte-derived VEGF.
(AD) The left column shows frozen eye sections stained with GSL at P14. The hyaloid vasculature is retained in Gfap-Cre Vegffl/fl eyes (arrows in left panel of B) and regresses in Gfap-Cre Vegffl/+, Six3-Cre Vegffl/+, and Six3-Cre Vegffl/fl eyes (arrowheads in left panels of A, C, and D). The right 2 columns show semithin plastic sections stained with toluidine blue (middle and far-right panels of AD). In Gfap-Cre Vegffl/fl eyes, there is hyperproliferation of astrocytes on the vitreal face of the retina (red arrowheads in middle panel of B) and retention of hyaloid vessels near the lens (retrolental vessels; arrows in far-right panel of B). In the 3 other genotypes, the retrolental vasculature has almost completely regressed (arrowheads in far-right panels of A, C, and D). Representative frozen sections are shown from experiments with a total of 4 eyes per genotype, and representative plastic sections are shown from experiments with a total of 2 eyes per genotype. Scale bars: 500 μm (left panels of AD) and 100 μm (middle and far-right panels of AD).
Figure 7
Figure 7. Contrasting responses of Vegf gene expression and astrocyte proliferation/migration with loss of Vegf in astrocytes versus all retinal cells.
(A) Retina sections at P14 from mice carrying the R26-LSL-mtdT-2A-H2B-GFP reporter, Gfap-Cre or Six3-Cre drivers, and the indicated combinations of Vegf alleles. Top 2 rows show ISH for Vegf transcripts. First row, ISH with the full coding region probe detects transcripts from both the unrecombined and the recombined conditional allele. Second row, ISH with the exon 3–specific probe detects only unrecombined transcripts. Third row, localization of Cre activity visualized with the R26-LSL-mtdT-2A-H2B-GFP reporter, leading to production of H2B-GFP. Fourth row, astrocytes visualized with GFAP immunostaining. Retinal vasculature, visualized with GSL staining, is missing from Gfap-Cre Vegffl/fl and Six3-Cre Vegffl/fl retinas. Scale bars: 100 μm. (B) HIF-stimulated transcription of the WT (top) and KO (i.e., exon 3 deleted; bottom) Vegf alleles in hypoxic cells and the structures of WT and exon 3–deleted Vegf transcripts. In the diagram of the Vegf gene, the first 4 exons are shown as black rectangles. The full coding region ISH probe is shown as a blue line and the exon 3–specific ISH probe is shown as a red line.
Figure 8
Figure 8. Retinal diagram as in Figure 2A showing the cellular sources, vascular targets, and relative strengths of VEGF signals inferred from the phenotypes of WT, Gfap-Cre Vegffl/fl, and Six3-Cre Vegffl/fl retinas.
The persistent hyaloid vasculature in Gfap-Cre Vegffl/fl retinas is presumed to reflect high levels of retina-derived VEGF.
Figure 9
Figure 9. Loss of Vegf in radial glia and ventricular zone cells leads to hypovascularization and hypoplasia of the cerebral cortex.
(A) Dorsal views of P14 brains. In the phenotypically WT Gfap-Cre Vegffl/+ brain (left), the cerebral cortices cover most of the midbrain. In the Gfap-Cre Vegffl/fl brain (right), the cortex is hypoplastic and the midbrain is visible. Scale bar: 5 mm. (B) Localization of vasculature (GSL staining; left panel) and Cre activity (right 3 panels) in coronal sections of E17 brains at the level of the anterior commissure. Cre activity, visualized with the R26-LSL-mtdT-2A-H2B-GFP reporter, shows mtdT and H2B-GFP in ventricular cells and radial glia. The Gfap-Cre Vegffl/fl dorsal cortex is thin and hypovascular. In the left 3 panels, the midline is near the left border of each image. Right panel shows enlargements of the regions delineated by the squares in the central 2 columns, with merged red and green channels. Scale bars: 500 μm (left 3 panels) and 250 μm (far-right panel).

References

    1. Chung AS, Ferrara N. Developmental and pathological angiogenesis. Annu Rev Cell Dev Biol. 2011;27:563–584. doi: 10.1146/annurev-cellbio-092910-154002. - DOI - PubMed
    1. Semenza GL. Oxygen sensing, hypoxia-inducible factors, and disease pathophysiology. Annu Rev Pathol. 2014;9:47–71. doi: 10.1146/annurev-pathol-012513-104720. - DOI - PubMed
    1. Selvam S, Kumar T, Fruttiger M. Retinal vasculature development in health and disease. Prog Retina Eye Res. 2018;63:1–19. doi: 10.1016/j.preteyeres.2017.11.001. - DOI - PubMed
    1. Sun Y, Smith LEH. Retinal vasculature in development and diseases. Annu Rev Vis Sci. 2018;4:101–122. doi: 10.1146/annurev-vision-091517-034018. - DOI - PMC - PubMed
    1. Fruttiger M. Development of the retinal vasculature. Angiogenesis. 2007;10(2):77–88. doi: 10.1007/s10456-007-9065-1. - DOI - PubMed

Publication types

MeSH terms

Substances