. 2019 Aug 12;15(8):e1007223.
doi: 10.1371/journal.pcbi.1007223. eCollection 2019 Aug.

Aggressive or moderate drug therapy for infectious diseases? Trade-offs between different treatment goals at the individual and population levels

Affiliations

Aggressive or moderate drug therapy for infectious diseases? Trade-offs between different treatment goals at the individual and population levels

Jérémie Scire et al. PLoS Comput Biol. .

Abstract

Antimicrobial resistance is one of the major public health threats of the 21st century. There is a pressing need to adopt more efficient treatment strategies in order to prevent the emergence and spread of resistant strains. The common approach is to treat patients with high drug doses, both to clear the infection quickly and to reduce the risk of de novo resistance. Recently, several studies have argued that, at least in some cases, low-dose treatments could be more suitable to reduce the within-host emergence of antimicrobial resistance. However, the choice of a drug dose may have consequences at the population level, which has received little attention so far. Here, we study the influence of the drug dose on resistance and disease management at the host and population levels. We develop a nested two-strain model and unravel trade-offs in treatment benefits between an individual and the community. We use several measures to evaluate the benefits of any dose choice. Two measures focus on the emergence of resistance, at the host level and at the population level. The other two focus on the overall treatment success: the outbreak probability and the disease burden. We find that different measures can suggest different dosing strategies. In particular, we identify situations where low doses minimize the risk of emergence of resistance at the individual level, while high or intermediate doses prove most beneficial to improve the treatment efficiency or even to reduce the risk of resistance in the population.


Conflict of interest statement

The authors have declared that no competing interests exist.

Figures
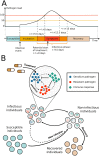
Fig 1
Fig 1. Nested model of an acute infectious disease.
(A) Average timeline of the infection for a non-treated individual. The host’s transition from one phase to the other is determined by the pathogen load. (B) Diagram of the nested model. Prior to infection, individuals are susceptible. For infected individuals, the pathogen load defines if an individual is infectious or non-infectious. Once the pathogen load has dropped to zero, individuals are recovered and have aquired life-long immunity.
Fig 2
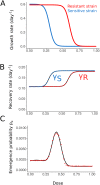
Fig 2. Transition from the nested agent-based model to an SIR model.
(A) Effect of treatment strength on the growth rate for the sensitive and resistant strains. At very high doses, neither strain can grow in the presence of treatment. (B) Mean recovery rates of an individual infected by the sensitive (blue) and resistant (red) strain. Simulated results are fitted with sigmoid functions. (C) Probability of emergence of resistance as a function of dose, obtained from 2 × 10⁶ within-host simulations per dose (red) and fitted with the sum of two Gaussians (black).
Fig 3
Fig 3. Comparison of optimal dose determined through the within-host probability of resistance (A) or through the number of transmission events of the resistant strain during an epidemic (B-D).
Blue symbols show the total number of transmission events, while red symbols show only transmission events towards susceptible hosts. The vertical blue line corresponds to the peak in the within-host probability of resistance and the orange line to the peak in the number of resistant-strain transmission events. The black arrows represent the trends in the number of resistant strain transmission events when one shifts the treatment dose away from the dose giving a maximum in pe (given by the vertical blue line). Mean over 1, 500 to 24, 000 simulations runs per data point. In dark blue and dark red: the 95% confidence intervals of the mean for each dose.
Fig 4
Fig 4. Effect of the treatment strength on the outbreak probability for various transmission coefficients.
Mean over 1500 to 20000 simulations per dose and transmission coefficient. Circles: R0 = 1.4 (β = 1.5 × 10⁻⁵ days−1). Triangles: R0 = 2.3 (β = 2.5 × 10⁻⁵ days−1). Squares: R0 = 4.2 (β = 4.5 × 10⁻⁵ days−1). The confidence intervals are not shown as they are too small to be clearly seen on the plot.
Fig 5
Fig 5. Effect of dose on the disease burden and infection dynamics.
A: Comparison of the disease burden obtained with the nested model and the SIR model (R0 = 2.3). Each red dot represents the mean for 3800 to 4700 runs of simulation of the nested model, with β = 2.5 × 10⁻⁵ days−1. For the SIR model, the contributions of the sensitive and resistant strains to the disease burden are also shown. B: Burden curves (in patient days) for various values of R0. C-F: Exemplary population dynamics of the SIR model for four doses and R0 = 2.3. Note that the burden B is the area-under-the-curve of the sum of the blue and red curves (number of individuals infected by each strain at time t).
Fig 6
Fig 6. Comparison of three dosing strategies.
Strategy that (1) uses the highest possible dose (pink), (2) uses the dose that minimizes the within-host probability of resistance (orange) and (3) uses the dose that minimizes the disease burden (green). Top row: Effect of each strategy on the within-host probability of resistance pe for three therapeutic windows. The black dots represent probabilities of resistance emergence computed from simulations of the within-host model with varying drug doses. Bottom row: Effect of each strategy on the disease burden B, where we fix β = 2.5 × 10⁻⁵ days−1 (R0 = 2.3). The black dots represent disease burdens computed from simulations of the full nested model. The three therapeutic windows are: (A, D) low-drug tolerance window (0.25 < c < 0.37); (B, E) medium drug-tolerance window (0.32 < c < 0.45); (C, F) high drug-tolerance window (0.27 < c < 0.52).
Fig 7
Fig 7. Effect of the treatment coverage on the disease burden.
The disease burden for various fractions f of treated hosts is shown, ranging from no treatment (f = 0, pale red) to full treatment (f = 1, dark red). The basic reproductive number is given by: (A) R0 = 1.1; (B) R0 = 2; (C) R0 = 3; (D) R0 = 4. Note that the scale on the y-axis in panel A is very different from the other panels.
Fig 8
Fig 8. Risk of resistance and the factors shaping it at the individual and population levels.
(A) The within-host probability of resistance emergence (solid black line) is shaped by three forces that are in part inversely affected by the drug dose: the strength of the immune response triggered by the sensitive strain (dashed blue arrow), the mutations of sensitive-to-treatment pathogens towards resistance during treatment (dashed orange arrow) and the rate of clearance of the resistant strain through the drug (dashed orange arrow as well). This panel is based on Figure 1 from Kouyos et al. [5] and adapted to represent the scenario we model. (B) The spread of an existing resistant strain in a susceptible population (solid black line) also has an inverted U-shape. Increased drug pressure favors the spread of a resistant strain through competitive release (dashed pink arrow). However, with increasing dose, the infectious period (dashed green arrow) decreases, even for infections with the resistant strain. (C,D) Number of transmission events of the resistant strain, at a high (C) or low (D) transmission coefficient β. This measure (solid black lines) depends on the ability of a resistant strain to spread (dashed dark-blue arrows, see panel B), and on the rate of de novo development of a resistant infection. This latter rate depends on the number of sensitively infected patients (or “targets for de novo resistance”), which in turn depends not only on the drug dose but also on R0. With a large R0, large outbreaks of the sensitive strain guarantee a high probability of appearance of resistance (red dashed line in Fig 8C). In contrast, for low R0, this probability severely decreases with increasing drug dose (dashed orange arrow in Fig 8D). The location of the peak in the number of transmission events of the resistant strain therefore depends on the transmission coefficient of the disease. The black curve is essentially the product of the red (or orange) arrow with the dark-blue arrow. The grey line and arrow in panel D are a repetition of the red arrow and black line in panel C.

Similar articles

Cited by

References

    1. Boucher HW, Talbot GH, Bradley JS, Edwards JE, Gilbert D, Rice LB, et al. Bad bugs, no drugs: no ESKAPE! An update from the Infectious Diseases Society of America. Clinical infectious diseases: an official publication of the Infectious Diseases Society of America. 2009;48(1):1–12. 10.1086/595011 - DOI - PubMed
    1. Walsh TR, Toleman MA. The emergence of pan-resistant gram-negative pathogens merits a rapid global political response. Journal of Antimicrobial Chemotherapy. 2012;67(1):1–3. 10.1093/jac/dkr378 - DOI - PubMed
    1. Centres for Disease Control and Prevention (US). Antibiotic resistance threats in the United States, 2013. Centres for Disease Control and Prevention, US Department of Health and Human Services; 2013.
    1. O’Neill J. Tackling drug-resistant infections globally: final report and recommendations. Review on Antimicrobial Resistance. 2016;.
    1. Kouyos RD, Metcalf CJE, Birger R, Klein EY, Abel zur Wiesch P, Ankomah P, et al. The path of least resistance: aggressive or moderate treatment? Proceedings of the Royal Society B: Biological Sciences. 2014;281(1794):20140566–20140566. 10.1098/rspb.2014.0566 - DOI - PMC - PubMed

Publication types

MeSH terms

Substances