. 2019 Aug 12;14(8):e0220648.
doi: 10.1371/journal.pone.0220648. eCollection 2019.

Time evolution of the hierarchical networks between PubMed MeSH terms

Affiliations

Time evolution of the hierarchical networks between PubMed MeSH terms

Sámuel G Balogh et al. PLoS One. .

Abstract

Hierarchical organisation is a prevalent feature of many complex networks appearing in nature and society. A relating interesting, yet less studied question is how does a hierarchical network evolve over time? Here we take a data driven approach and examine the time evolution of the network between the Medical Subject Headings (MeSH) provided by the National Center for Biotechnology Information (NCBI, part of the U. S. National Library of Medicine). The network between the MeSH terms is organised into 16 different, yearly updated hierarchies such as "Anatomy", "Diseases", "Chemicals and Drugs", etc. The natural representation of these hierarchies is given by directed acyclic graphs, composed of links pointing from nodes higher in the hierarchy towards nodes in lower levels. Due to the yearly updates, the structure of these networks is subject to constant evolution: new MeSH terms can appear, terms becoming obsolete can be deleted or be merged with other terms, and also already existing parts of the network may be rewired. We examine various statistical properties of the time evolution, with a special focus on the attachment and detachment mechanisms of the links, and find a few general features that are characteristic for all MeSH hierarchies. According to the results, the hierarchies investigated display an interesting interplay between non-uniform preference with respect to multiple different topological and hierarchical properties.


Conflict of interest statement

The authors have declared that no competing interests exist.

Figures
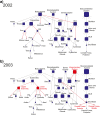
Fig 1
Fig 1. Changes between subsequent time steps in a MeSH hierarchy.
a) A small part of the hierarchy ‘A’ (Anatomy) in 2002. Red links are deleted in the next time step b) The corresponding part of the same hierarchy in 2003. Nodes and links colored red are newly appearing elements.
Fig 2
Fig 2. Testing W(x) by simulated attachments.
The property x here corresponds to the number of children, and the full symbols connected by continuous lines show the measured W(x) for random attachment (independent of x) in orange (circles), and for preferential attachment with an additive constant (i.e. when a newly added node connects to node i with a probability ki+aiki+a where a is an arbitrary constant) in blue (squares). Dashed lines correspond to the analytic mean for W(x), whereas the shaded areas indicate the standard deviation around the mean.
Fig 3
Fig 3. Measuring preference in attachment and detachment events.
In each panel we compare Wemp(x) defined in (8) to the mean and standard deviation of W(x) for random events, given in (9 and 10) and indicated by dashed lines in shaded areas. The pictograms beside the panels show the type of the studied attachment/detachment events and highlight in red whether the given property x was measured on the source or on the target of the links involved in the events. a) Results for the total number of descendants of source nodes in attachments of new links pointing from old nodes to new nodes in hierarchies D (orange) and C (blue). b) Wemp(x) for the number of ancestors of source nodes on new links appearing between old nodes, measured in hierarchies D (orange) and C (blue). c) The same plots when x is equal to the number of ancestors of the target nodes in link deletion events for hierarchies D (orange) and C (blue). d) Wemp(x) in case x is corresponding to the number of ancestors of the target node in attachment of new links between old nodes.

References

    1. Albert R, Barabási AL. Statistical mechanics of complex networks. Rev Mod Phys. 2002;74:47–97. 10.1103/RevModPhys.74.47 - DOI
    1. Mendes JFF, Dorogovtsev SN. Evolution of Networks: From Biological Nets to the Internet and WWW. Oxford: Oxford Univ. Press; 2003.
    1. Ravasz E, Somera AL, Mongru DA, Oltvai ZN, Barabási AL. Hierarchical Organization of Modularity in Metabolic Networks. Science. 2002;297:1551—1555. 10.1126/science.1073374 - DOI - PubMed
    1. Clauset A, Moore C, Newman MEJ. Hierarchical structure and the prediction of missing links in networks. Nature. 2008;453:98–101. 10.1038/nature06830 - DOI - PubMed
    1. Pumain D. Hierarchy in Natural and Social Sciences. vol. 3 of Methodos Series. Dodrecht, The Netherlands: Springer Netherlands; 2006.

Publication types