

Nuclear corepressor SMRT is a strong regulator of body weight independently of its ability to regulate thyroid hormone action
- PMID: 31404087
- PMCID: PMC6690520
- DOI: 10.1371/journal.pone.0220717
Nuclear corepressor SMRT is a strong regulator of body weight independently of its ability to regulate thyroid hormone action
Abstract
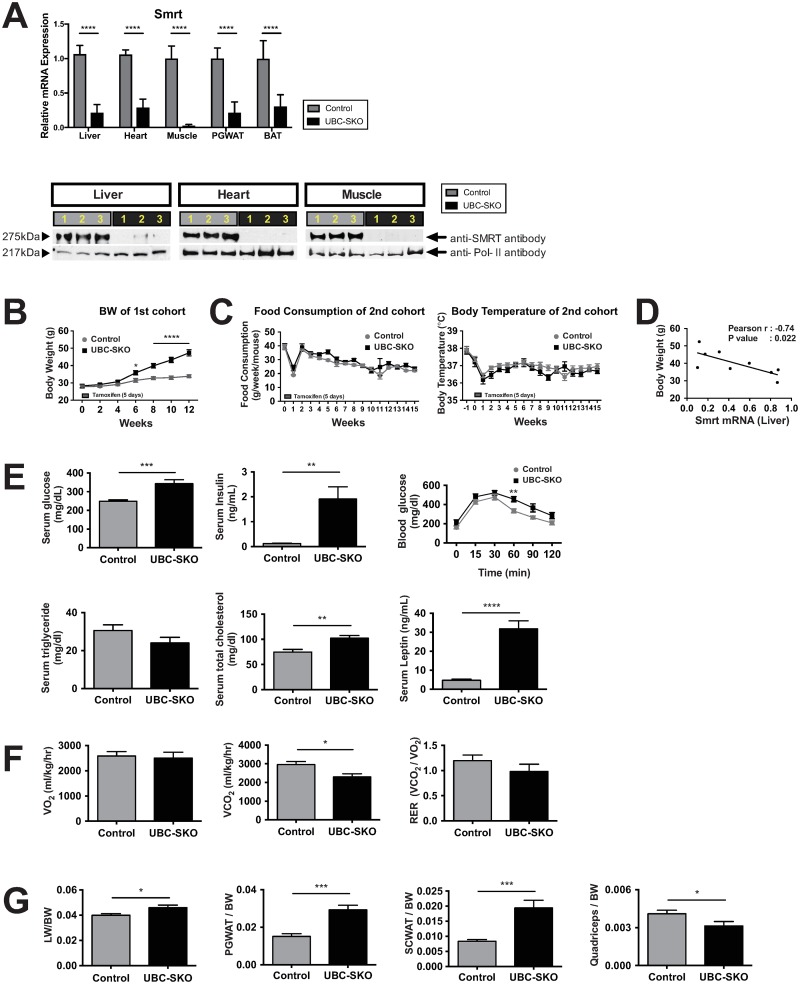
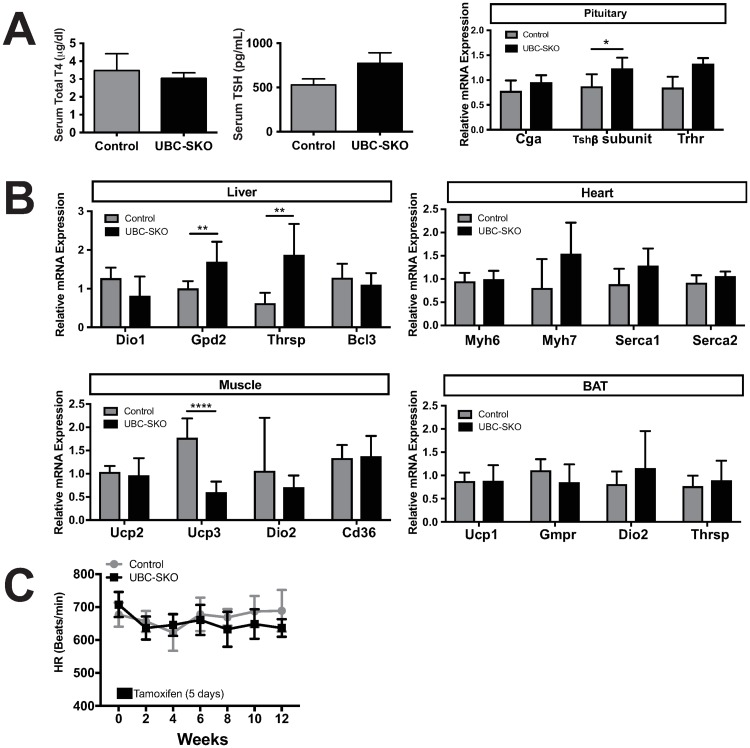
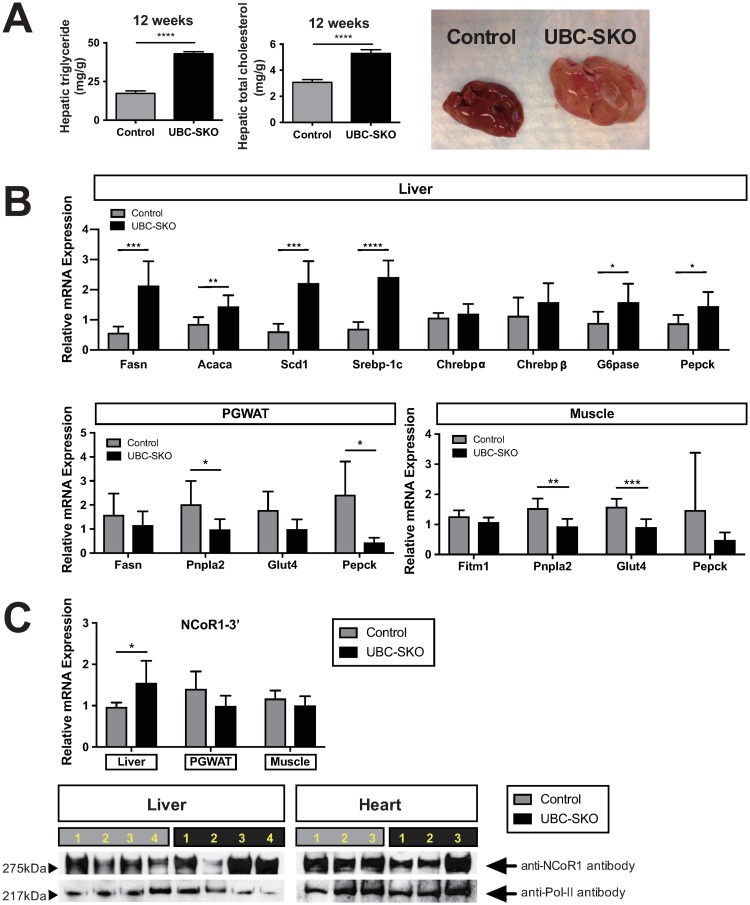
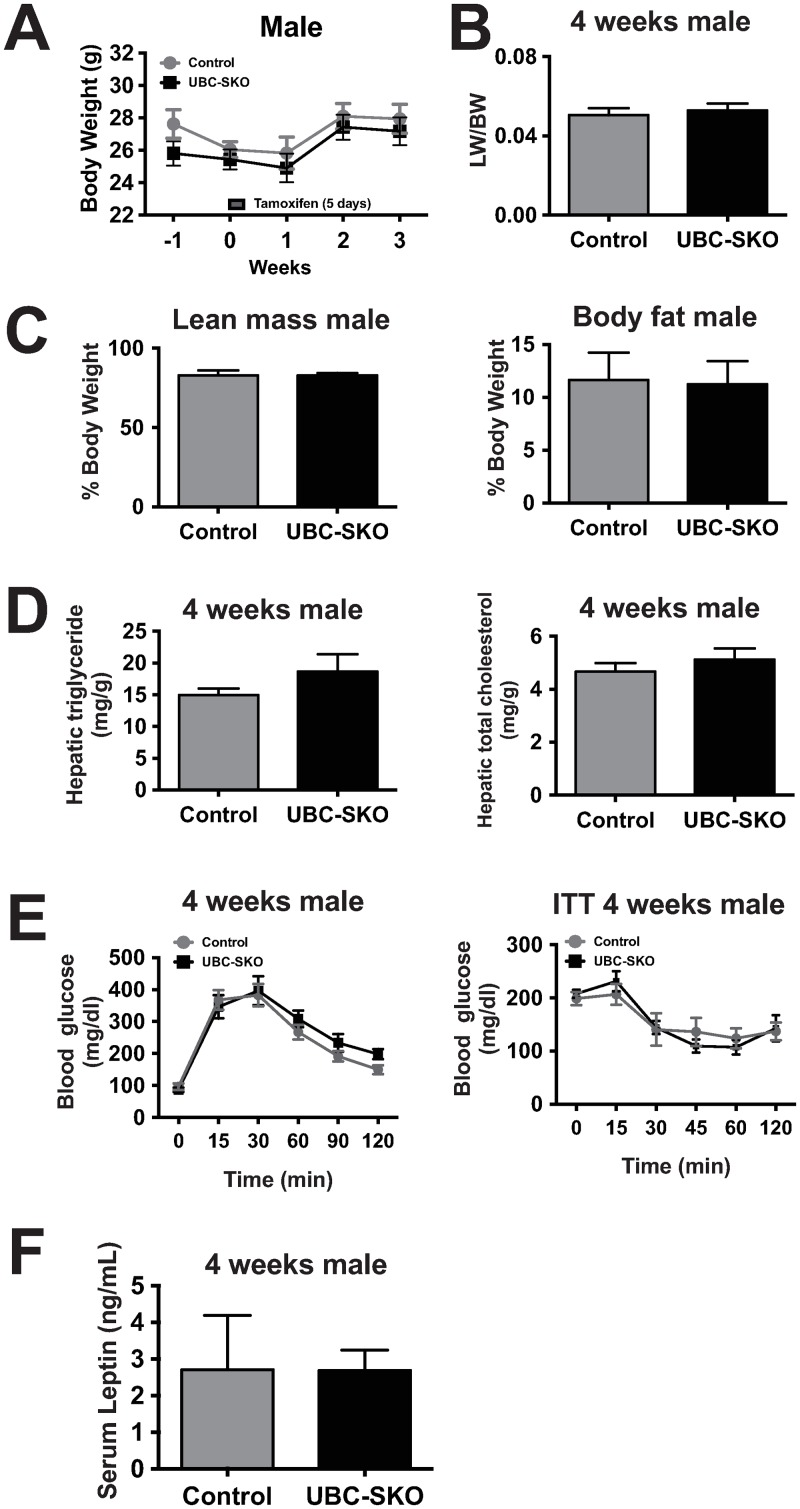
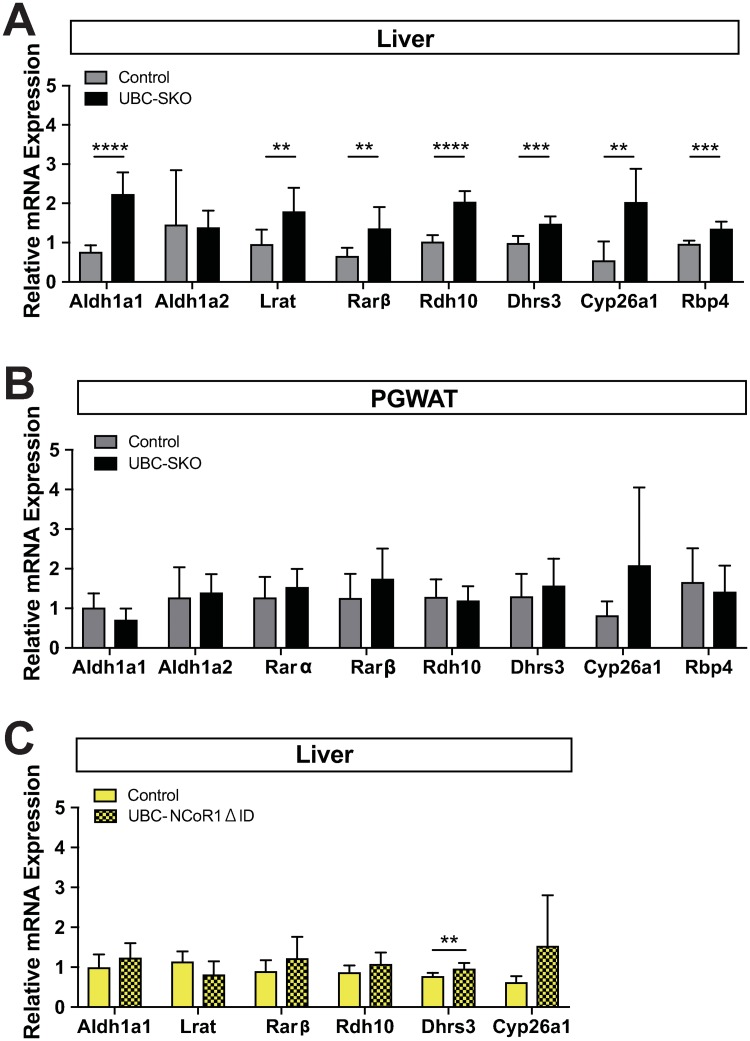
Silencing Mediator of Retinoid and Thyroid Hormone Receptors (SMRT) and the nuclear receptor co-repressor1 (NCoR1) are paralogs and regulate nuclear receptor (NR) function through the recruitment of a multiprotein complex that includes histone deacetylase activity. Previous genetic strategies which deleted SMRT in a specific tissue or which altered the interaction between SMRT and NRs have suggested that it may regulate adiposity and insulin sensitivity. However, the full role of SMRT in adult mice has been difficult to establish because its complete deletion during embryogenesis is lethal. To elucidate the specific roles of SMRT in mouse target tissues especially in the context of thyroid hormone (TH) signaling, we used a tamoxifen-inducible post-natal disruption strategy. We found that global SMRT deletion causes dramatic obesity even though mice were fed a standard chow diet and exhibited normal food intake. This weight gain was associated with a decrease in energy expenditure. Interestingly, the deletion of SMRT had no effect on TH action in any tissue but did regulate retinoic acid receptor (RAR) function in the liver. We also demonstrate that the deletion of SMRT leads to profound hepatic steatosis in the setting of obesity. This is unlike NCoR1 deletion, which results in hepatic steatosis due to the upregulation of lipogenic gene expression. Taken together, our data demonstrate that SMRT plays a unique and CoR specific role in the regulation of body weight and has no role in TH action. This raises the possibility that additional role of CoRs besides NCoR1 and SMRT may exist to regulate TH action.
Conflict of interest statement
The authors have declared that no competing interests exist.
Figures
Similar articles
-
NCoR1 and SMRT play unique roles in thyroid hormone action in vivo.Mol Cell Biol. 2015 Feb;35(3):555-65. doi: 10.1128/MCB.01208-14. Epub 2014 Nov 24. Mol Cell Biol. 2015. PMID: 25421714 Free PMC article.
-
Nuclear Receptor CoRepressors, NCOR1 and SMRT, are required for maintaining systemic metabolic homeostasis.Mol Metab. 2021 Nov;53:101315. doi: 10.1016/j.molmet.2021.101315. Epub 2021 Aug 12. Mol Metab. 2021. PMID: 34390859 Free PMC article.
-
Nuclear Receptor Corepressors NCOR1 and SMRT Regulate Metabolism via Intestinal Regulation of Carbohydrate Transport.Endocrinology. 2024 Jul 26;165(9):bqae100. doi: 10.1210/endocr/bqae100. Endocrinology. 2024. PMID: 39106294 Free PMC article.
-
Role of co-regulators in metabolic and transcriptional actions of thyroid hormone.J Mol Endocrinol. 2016 Apr;56(3):73-97. doi: 10.1530/JME-15-0246. Epub 2015 Dec 16. J Mol Endocrinol. 2016. PMID: 26673411 Review.
-
The Role of Histone Deacetylase 3 Complex in Nuclear Hormone Receptor Action.Int J Mol Sci. 2021 Aug 24;22(17):9138. doi: 10.3390/ijms22179138. Int J Mol Sci. 2021. PMID: 34502048 Free PMC article. Review.
Cited by
-
Targeting the Liver Serine Protease TMPRSS6 Ameliorates Steatosis and Attenuates Fibrosis in Experimental MASLD.Liver Int. 2025 Jul;45(7):e70163. doi: 10.1111/liv.70163. Liver Int. 2025. PMID: 40501083 Free PMC article.
-
Histone Deacetylases (HDACs): Evolution, Specificity, Role in Transcriptional Complexes, and Pharmacological Actionability.Genes (Basel). 2020 May 15;11(5):556. doi: 10.3390/genes11050556. Genes (Basel). 2020. PMID: 32429325 Free PMC article. Review.
-
Disturbed function of TBL1X has a differential effect on T3-regulated gene expression in two human liver cell models.Eur Thyroid J. 2024 Oct 14;13(5):e240162. doi: 10.1530/ETJ-24-0162. Print 2024 Oct 1. Eur Thyroid J. 2024. PMID: 39316725 Free PMC article.
-
Nuclear corepressor SMRT acts as a strong regulator of both β-oxidation and suppressor of fibrosis in the differentiation process of mouse skeletal muscle cells.PLoS One. 2022 Dec 1;17(12):e0277830. doi: 10.1371/journal.pone.0277830. eCollection 2022. PLoS One. 2022. PMID: 36454860 Free PMC article.
-
Transcriptional Cofactors for Thyroid Hormone Receptors.Endocrinology. 2025 Jan 6;166(2):bqae164. doi: 10.1210/endocr/bqae164. Endocrinology. 2025. PMID: 39679543 Review.
References
-
- Martinez-Iglesias OA, Alonso-Merino E, Gomez-Rey S, Velasco-Martin JP, Martin Orozco R, Luengo E, et al. Autoregulatory loop of nuclear corepressor 1 expression controls invasion, tumor growth, and metastasis. Proc Natl Acad Sci U S A. 2016;113(3):E328–37. 10.1073/pnas.1520469113 - DOI - PMC - PubMed
Publication types
MeSH terms
Substances
Grants and funding
LinkOut - more resources
Full Text Sources
Medical
Molecular Biology Databases
Research Materials
