. 2019 Aug 12;14(8):e0220764.
doi: 10.1371/journal.pone.0220764. eCollection 2019.

Hemodialysis-induced changes in hematocrit, hemoglobin and total protein: Implications for relative blood volume monitoring

Affiliations

Hemodialysis-induced changes in hematocrit, hemoglobin and total protein: Implications for relative blood volume monitoring

Leszek Pstras et al. PLoS One. .

Abstract

Background: Relative blood volume (RBV) changes during hemodialysis (HD) are typically estimated based on online measurements of hematocrit, hemoglobin or total blood protein. The aim of this study was to assess changes in the above parameters during HD in order to compare the potential differences in the RBV changes estimated by individual methods.

Methods: 25 anuric maintenance HD patients were monitored during a 1-week conventional HD treatment. Blood samples were collected from the arterial dialysis blood line at the beginning and at the end of each HD session. The analysis of blood samples was performed using the hematology analyzer Advia 2120 and clinical chemistry analyzer Advia 1800 (Siemens Healthcare).

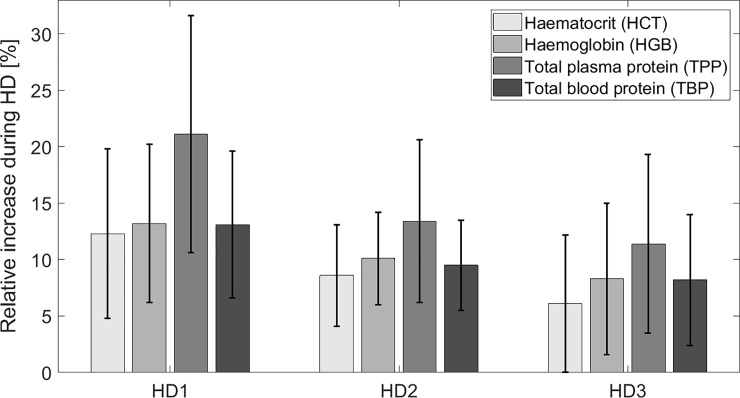
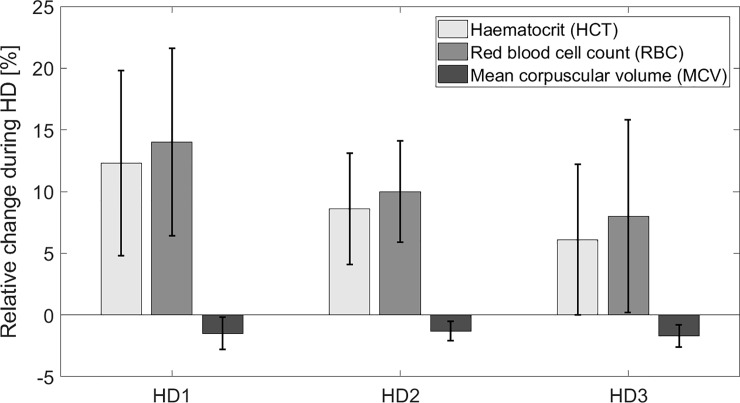
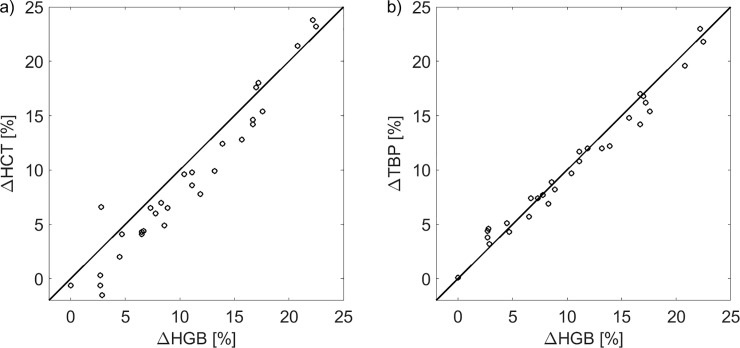
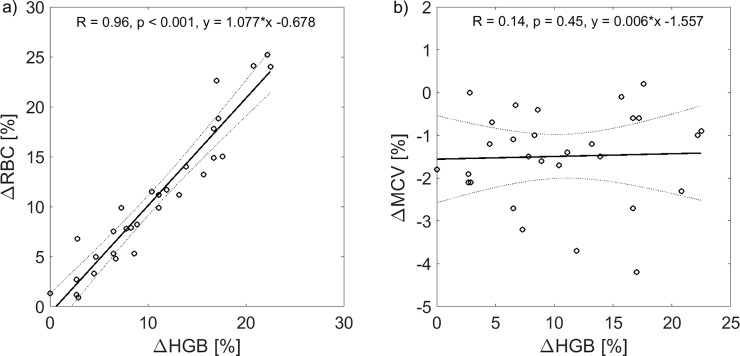
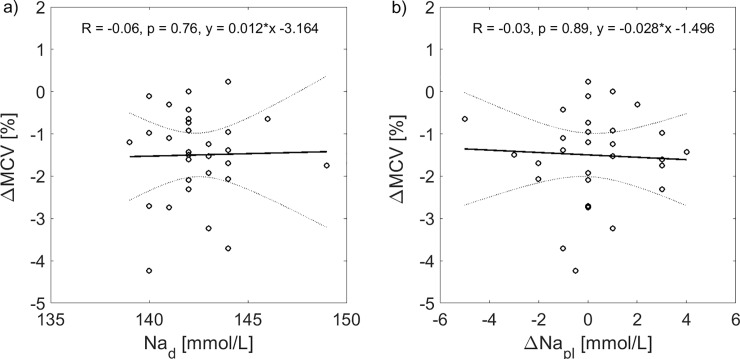
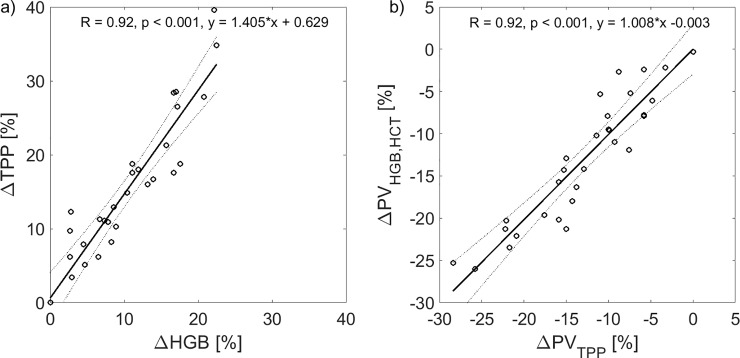
Results: During the analyzed 30 HD sessions with ultrafiltration in the range 0.7-4.0 L (2.5 ± 0.8 L) hematocrit (HCT) increased by 9.1 ± 7.0% (mean ± SD), hemoglobin (HGB) increased by 10.6 ± 6.3%, total plasma protein (TPP) increased by 15.6 ± 9.5%, total blood protein (TBP) increased by 10.4 ± 5.8%, red blood cell count (RBC) increased by 10.8 ± 7.1%, while mean corpuscular red cell volume (MCV) decreased by 1.5 ± 1.1% (all changes statistically significant, p < 0.001). HGB increased on average by 1.5% more than HCT (p < 0.001). The difference between HGB and TBP increase was insignificant (p = 0.16).

Conclusions: Tracking HGB or TBP can be treated as equivalent for the purpose of estimating RBV changes during HD. Due to the reduction of MCV, the HCT-based estimate of RBV changes may underestimate the actual blood volume changes.


Conflict of interest statement

The authors have declared that no competing interests exist.

Figures

Fig 1
Fig 1. Dialysis-induced changes in hematocrit, hemoglobin, total plasma protein and total blood protein.
Relative increase (mean ± SD) of hematocrit (HCT), hemoglobin (HGB), total plasma protein (TPP) and total blood protein including hemoglobin (TBP) during three consecutive HD sessions in the week in the analyzed group of patients based on the laboratory measurements of arterial blood samples taken at the beginning and at the end of each session (see Table 3). For all three averaged HD sessions the differences in dialysis-induced relative increase between HCT and HGB, and between HGB and TPP were all statistically significant (p < 0.02), except for the difference between HCT and HGB in the first HD session (p = 0.23). The changes of HGB and TBP during HD 1 and HD 3 were almost equal (p = 0.81 and p = 0.63, respectively); for HD 2 there was a significant (p < 0.02), but very small difference (0.6%).
Fig 2
Fig 2. Dialysis-induced changes in red blood cell parameters.
Relative change (mean ± SD) of hematocrit (HCT), red blood cell count (RBC) and mean corpuscular volume of red blood cells (MCV) during three consecutive hemodialysis sessions in the week in the analyzed group of patients based on the laboratory measurements of arterial blood samples taken at the beginning and at the end of each session (see Table 3).
Fig 3
Fig 3. Correlation between dialysis-induced changes in hematocrit, hemoglobin and total blood protein.
Relative changes of hemoglobin (ΔHGB) paired with a) relative changes of hematocrit (ΔHCT) and b) relative changes of total blood protein (ΔTBP) during all analyzed hemodialysis sessions plotted against the identity line.
Fig 4
Fig 4. Correlation between dialysis-induced changes in red blood cell count, hemoglobin and mean corpuscular red cell volume.
Relative changes of hemoglobin (ΔHGB) paired with a) relative changes of red blood cell count (ΔRBC) and b) relative changes of mean corpuscular red cell volume (ΔMCV) during all analyzed hemodialysis sessions with linear regression fit (solid lines) and 95% confidence bounds (dotted lines).
Fig 5
Fig 5. Correlation between dialysis-induced changes in mean corpuscular red cell volume, dialysate sodium concentration and change in plasma sodium concentration during dialysis.
Dialysis-induced changes in mean corpuscular red cell volume (ΔMCV) paired with a) dialysate sodium concentration (Nad) and b) change in plasma sodium concentration (ΔNapl) during all analyzed hemodialysis sessions with linear regression fit (solid lines) and 95% confidence bounds (dotted lines).
Fig 6
Fig 6. Correlation between dialysis-induced changes in total plasma protein, hemoglobin and plasma volume estimates.
a) Relative changes of hemoglobin (ΔHGB) paired with relative changes of total plasma protein (ΔTPP); b) Comparison between the relative plasma volume (PV) changes calculated from changes in total protein concentration (TPP, see Eq 4) or calculated from changes in whole blood hemoglobin (HGB) and hematocrit (HCT), assuming the constant F-cells ratio of 0.9. Data shown for all hemodialysis sessions with linear regression fit (solid lines) and 95% confidence bounds (dotted lines).

Similar articles

Cited by

References

    1. Polaschegg H., Levin N.: Hemodialysis machines and monitors In Hörl W., Koch K., Lindsay R., Ronco C., Winchester J., eds.: Replacement of Renal Function by Dialysis 5th edn Springer; Netherlands, Dordrecht: (2004)
    1. Dasselaar J., Huisman R., de Jong P., Franssen C.: Measurement of relative blood volume changes during haemodialysis: merits and limitations. Nephrol Dial Transplant 20, 2043–2049 (2005) 10.1093/ndt/gfi056 - DOI - PubMed
    1. Dasselaar J., van der Sande F., Franssen C.: Critical evaluation of blood volume measurements during hemodialysis. Blood Purif 33(1–3), 177–182 (2012) 10.1159/000334142 - DOI - PubMed
    1. Schneditz D., Ribitsch W., Schilcher G., Uhlmann M., Chait Y., Stadlbauer V.: Concordance of absolute and relative plasma volume changes and stability of Fcells in routine hemodialysis. Hemodial Int 20, 120–128 (2016) 10.1111/hdi.12338 - DOI - PMC - PubMed
    1. Schneditz D., Kron J., Hecking M.: Anything Goes? High Time for Smart Blood Volume Monitors. ASAIO J 64(6), 697–700 (2018) 10.1097/MAT.0000000000000885 - DOI - PubMed

Publication types