. 2019 Jul 25:10:1738.
doi: 10.3389/fimmu.2019.01738. eCollection 2019.

Akt3-Mediated Protection Against Inflammatory Demyelinating Disease

Affiliations

Akt3-Mediated Protection Against Inflammatory Demyelinating Disease

Juwen C DuBois et al. Front Immunol. .

Abstract

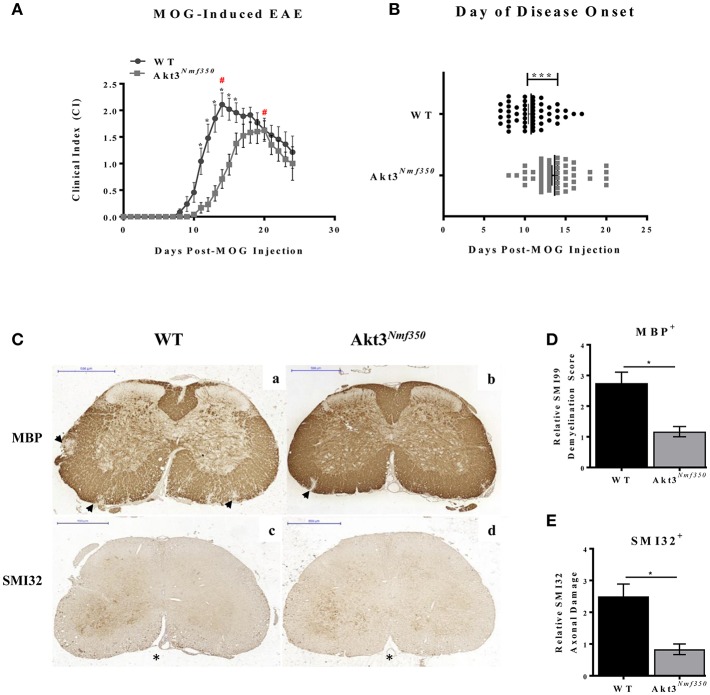
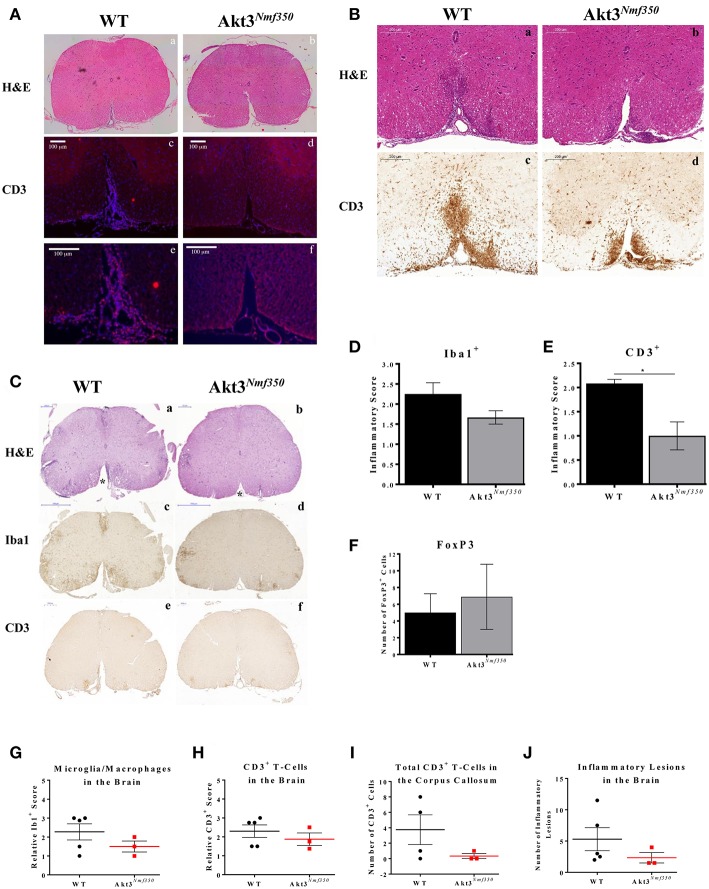
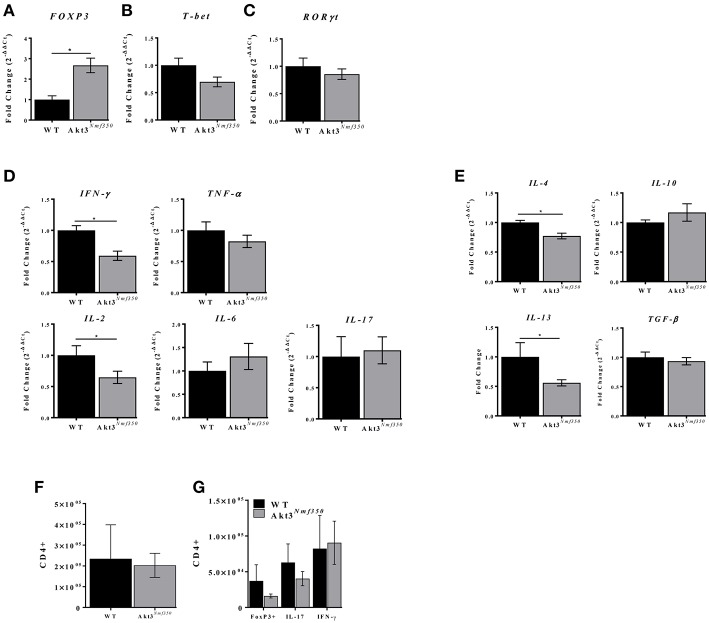
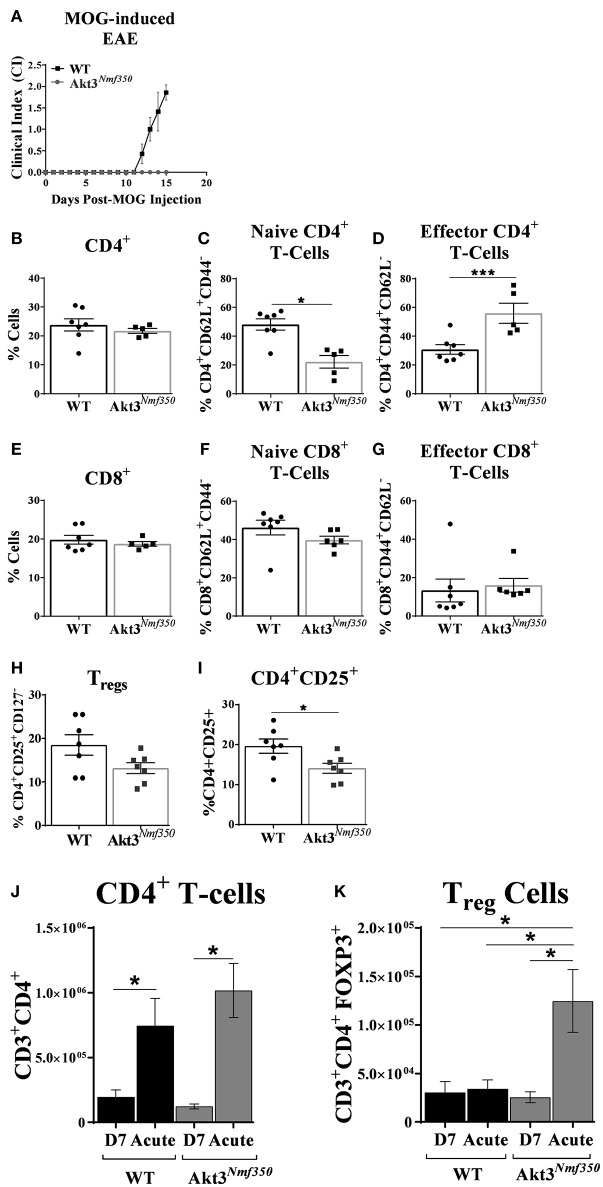
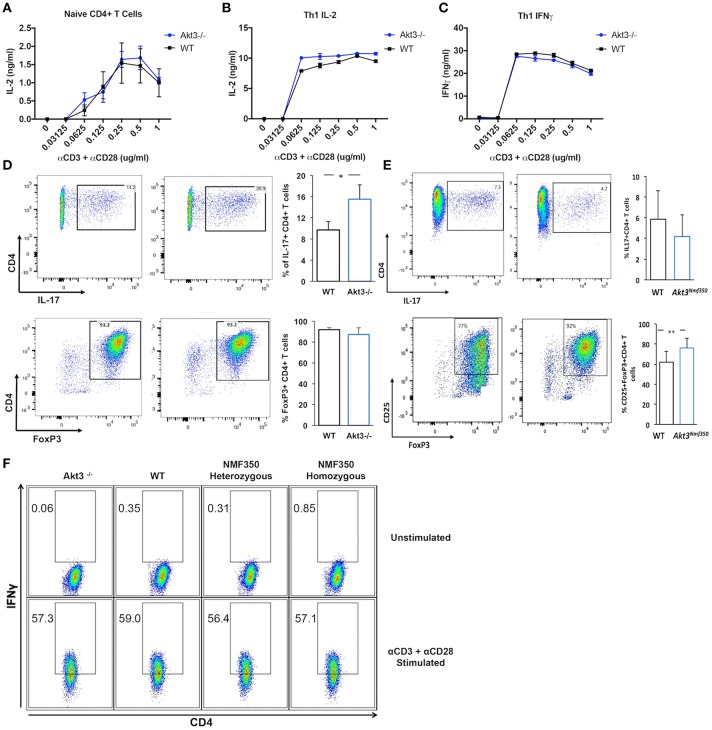
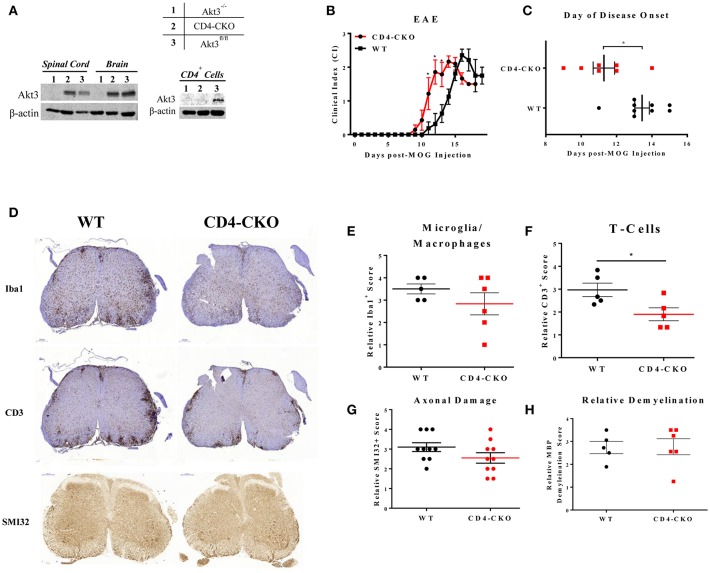
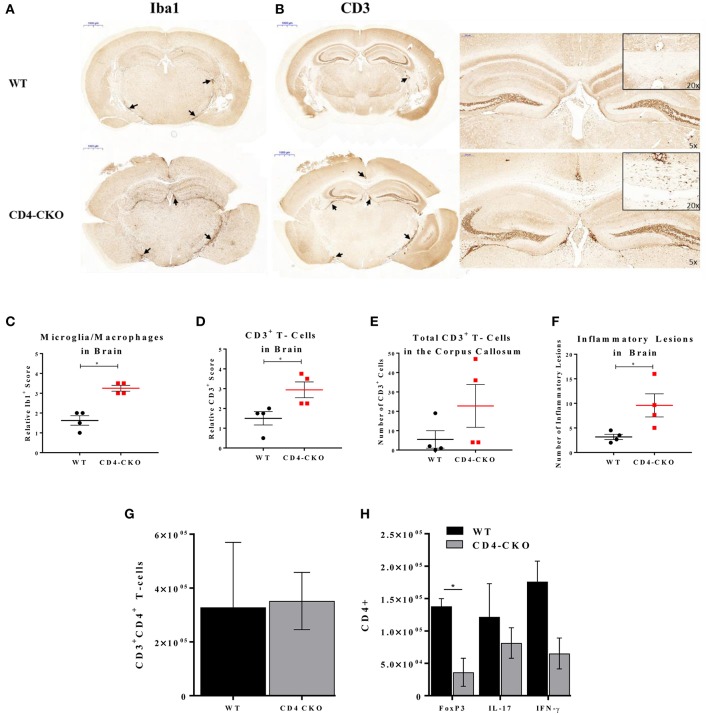
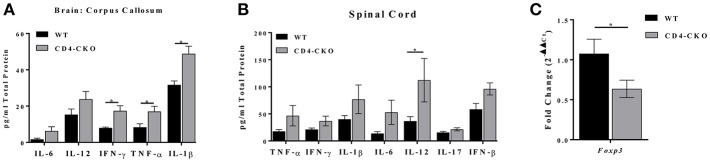
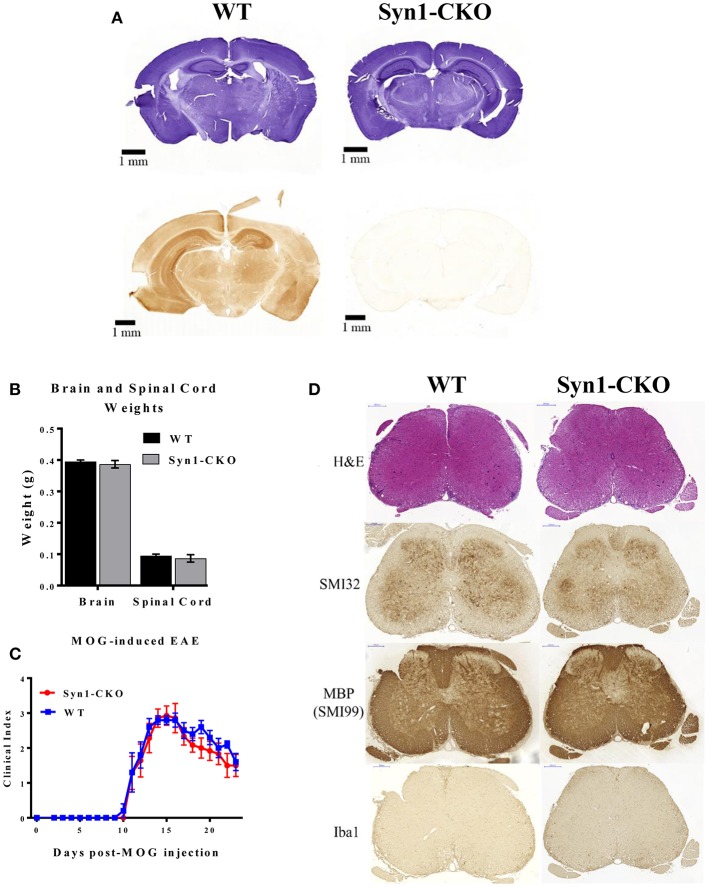
Akt is a serine/threonine protein kinase that plays a major role in regulating multiple cellular processes. While the isoforms Akt1 and Akt2 are involved in apoptosis and insulin signaling, respectively, the role for Akt3 remains uncertain. Akt3 is predominantly expressed in the brain, and total deletion of Akt3 in mice results in a reduction in brain size and neurodegeneration following injury. Previously, we found that Akt3-/- mice have a significantly worse clinical course during myelin-oligodendrocyte glycoprotein (MOG)-induced experimental autoimmune encephalomyelitis (EAE), an animal model in which autoreactive immune cells enter the CNS, resulting in inflammation, demyelination, and axonal injury. Spinal cords of Akt3-/- mice are severely demyelinated and have increased inflammation compared to WT, suggesting a neuroprotective role for Akt3 during EAE. To specifically address the role of Akt3 in neuroinflammation and maintaining neuronal integrity, we used several mouse strains with different manipulations to Akt3. During EAE, Akt3 Nmf350 mice (with enhanced Akt3 kinase activity) had lower clinical scores, a lag in disease onset, a delay in the influx of inflammatory cells into the CNS, and less axonal damage compared to WT mice. A significant increased efficiency of differentiation toward FOXP3 expressing iTregs was also observed in Akt3 Nmf350 mice relative to WT. Mice with a conditional deletion of Akt3 in CD4+ T-cells had an earlier onset of EAE symptoms, increased inflammation in the spinal cord and brain, and had fewer FOXP3+ cells and FOXP3 mRNA expression. No difference in EAE outcome was observed when Akt3 expression was deleted in neurons (Syn1-CKO). These results indicate that Akt3 signaling in T-cells and not neurons is necessary for maintaining CNS integrity during an inflammatory demyelinating disease.

Keywords: Akt3; EAE; demyelination; neuroinflammation; neuroprotection; regulatory T-cells (Tregs).


Figures

Figure 1
Figure 1
Akt3Nmf350 mice have a lag in disease onset and a less severe EAE course. (A) EAE disease course of male and female Akt3Nmf350 (n = 24) vs. WT (n = 24) mice. (#) Represents day of peak disease severity WT: day 14 (CI = 2.1) vs. Akt3Nmf350: day 20 (CI = 1.6) post-MOG immunization. (B) Day of onset of EAE symptoms (CI ≥ 1) in Akt3Nmf350 (n = 56) and WT (n = 52). (C) Histological analysis of representative sections of lumbar spinal cords from WT (n = 4) and Akt3Nmf350 (n = 6) mice after 10 days with consecutive clinical scores (chronic EAE) incubated with MBP (top row) and SMI32 (bottom row) are depicted. (a,b) MBP immunostaining quantified in (D) and (c,d) SMI32 immunostaining quantified in (E). Quantification of the SMI32+ axonal swellings (>3 μm) was conducted on multiple 20× fields of the left and the right ventral region of the lumbar spinal cord (*p = 0.05, ***p = 0.001, Mann-Whitney U-test). All scale bars are 500 μm.
Figure 2
Figure 2
Akt3Nmf350 mice have a delay in the influx of inflammatory cells into the CNS during EAE and less CD3+ T-cells in the spinal cord during chronic EAE. (A) Representative lumbar spinal cord sections from WT (n = 3) (CI = 1) and Akt3Nmf350 (n = 5) (CI = 0) mice at 10 days post-MOG sensitization. (a,b) H&E and (c,f) CD3+ T-cell infiltrates (scale bar = 100 μm). (B) Representative lumbar spinal cord sections from WT (n = 3) (CI = 1) and Akt3Nmf350 (n = 3) (CI = 1) mice at EAE onset. (a,b) H&E and (c–f) CD3+ T-cell infiltrates (scale bar = 200 μm). (C) Representative sections from WT (n = 4) and Akt3Nmf350 (n = 6) mice after 10 days with consecutive clinical scores (chronic EAE). (a,b) H&E staining of lumbar spinal cords (scale bar = 200 μm). Asterisks (*) point to ventral funiculus. (c,d) Iba1 immunostaining quantified in (D) (scale bar = 500 μm). (e–f) CD3+ T-cell infiltrates quantified in (E) (scale bar = 200 μm). (F) Number of FOXP3+ cells in the lumbar spinal cord during chronic EAE, WT (n = 4) and Akt3Nmf350 (n = 3). (G) Quantified Iba1+ microglia/macrophages and (H) CD3+ cells in the brain sections of Akt3Nmf350 (n = 3) vs. WT (n = 5) mice. (I) Total CD3+ cells the corpus callosum. (J) Total number of inflammatory lesions in the brain (*p = 0.05, Mann-Whitney U-test).
Figure 3
Figure 3
Akt3Nmf350 mice have decreased inflammatory cytokine expression and increased FOXP3 expression in the lumbar spinal cord during acute EAE. RNA was extracted from the spinal cords of WT (n = 4) and Akt3Nmf350 (n = 10) mice presenting with clinical scores for 4–5 days (acute EAE). (A) qRT-PCR analysis of CD4+ T-cell lineage-specific transcription factors: FOXP3 for Tregs, (B) Tbet for Th1, and (C) RORγT for Th17. (D) mRNA expression of proinflammatory cytokines TNF-α, IFN-γ, IL-2, IL-6, and IL-17; and (E) anti-inflammatory cytokines IL-4, IL-10, IL-13 and TGF-β. (F) Total CD3+CD4+ T-cells, and (G) CD4+FOXP3+, CD4+IL-17+, and CD4+IFN-γ+, in the CNS (brain and spinal cord combined) of WT vs. Akt3Nmf350 mice during acute EAE (*p < 0.05, Mann-Whitney U-test).
Figure 4
Figure 4
Deep cervical lymph nodes of Akt3Nmf350 mice have significantly more effector T-cells before the onset of EAE symptoms, whereas draining inguinal lymph nodes have significantly more Tregs during acute EAE. (A) EAE disease course of Akt3Nmf350 (n = 11) vs. WT (n = 14) mice. Mice were euthanized at 13–15 days post-MOG injection and single cell suspensions from the deep cervical lymph nodes (dCLN) were isolated for FACS analysis. (B) Comparison of the %CD4+ cells present in dCLN of WT vs. Akt3Nmf350 mice, (C) CD4+CD62L+ naïve and (D) CD4+CD44+ effector T-cell subsets. (E) No differences were observed in the %CD8+ cells, (F) CD8+CD62L+ naïve or (G) CD8+CD44+ effector T-cells in dCLN of WT vs. Akt3Nmf350. (H) Tregs (CD4+CD25+CD127) remained unchanged; (I) while the percentage of cells co-expressing CD4+ and CD25+ was significantly lower in Akt3Nmf350. (J) Total CD3+CD4+ T-cells, and (K) CD3+CD4+FOXP3+ cells in the inguinal LN (iLN) of WT and Akt3Nmf350 mice during preclinical (D7 post-MOG immunization) and acute EAE (*p < 0.05, ***p < 0.001, Mann-Whitney U-test).
Figure 5
Figure 5
Akt3 signaling does not affect T-cell activation or Th1 differentiation, but regulates Th17 and Treg differentiation in vitro. (A) Naïve CD4+ T-cells isolated from cervical lymph nodes and spleens of 4–6 week old WT and Akt3−/− mice were activated in vitro with varying concentrations of anti-CD3 and anti-CD28 antibodies for 24 h. Secreted IL-2 was measured by ELISA. (B) Differentiated Th1 cells from Akt3−/− and WT mice were subjected to the same in vitro activation conditions as in (A). IL-2 and (C) IFN-γ in culture supernatants were measured by ELISA after stimulation for 24 h. No differences in IL-2 and/or IFN-γ were detected in the culture supernatants of Akt3−/− and WT T-cells. (D) Differentiated Th17 and iTreg cells from Akt3−/− and WT mice were analyzed by flow cytometry to detect activation-induced IL-17 expression and FOXP3 levels, respectively. Representative flow cytometry data and a quantification of data collected from 3 independent experiments (mean ± SD) are presented. (E) Differentiated Th17 and iTreg cells from Akt3Nmf350 and WT mice were analyzed by flow cytometry to detect activation-induced IL-17 expression and FOXP3 levels, respectively. Representative flow data and a quantification of data collected from 3 independent experiments (mean ± SEM) are presented (F) CD4+ T-cells were isolated from naïve 4–6 week old Akt3−/−, WT, Akt3Nmf350 heterozygous, and homozygous mice using CD4 magnetic bead isolation. Cells were co-stimulated in vitro with anti-CD3 and anti-CD28 in the presence of IL-12 and anti-IL-4 for 7 days. Differentiated cells were restimulated in the presence of Brefeldin A for 6 h. Unstimulated and stimulated Th1 cells were then surface stained for CD4 and intracellularly stained for IFN-γ. No differences were seen in CD4+IFN-γ+ cells from any mouse strain (*p < 0.05).
Figure 6
Figure 6
Conditional knockout of Akt3 in CD4+ T-cells results in earlier disease onset during MOG-induced EAE. (A) Western blot analysis of protein homogenates of lymph node CD4+ T-cells, brain, and spinal cord isolated from (1) Akt3−/−, (2) CD4-CKO, and (3) Akt3fl/fl. Densitometry analysis of CD4-CKO and Akt3fl/fl brain and spinal cord homogenates yielded approximately equal ratios of Akt3/β-actin. (B) EAE clinical course and (C) day of disease onset (CI ≥ 1) of CD4-CKO mice (n = 7) and Akt3fl/fl (n = 9), representative graph of 4 independent experiments. (D) Histological analysis of microglia/macrophages (Iba1)—quantified in (E), T-cell infiltrates (CD3)—quantified in (F), axonal damage (SMI32) quantified in (G), and (H) demyelination (MBP) in lumbar spinal cord of CD4-CKO and Akt3fl/fl controls after 5 consecutive days with clinical scores (*p < 0.05, Mann-Whitney U-test). Scale bars = 200 μm.
Figure 7
Figure 7
CD4-CKO mice have significantly more inflammatory lesions, CD3+ T-cells, and Iba1+ microglia/macrophages in the brain and less FOXP3+ Tregs in the CNS during acute EAE. Coronal sections of paraffin-embedded brains were prepared from mice sacrificed after presenting with clinical signs of EAE for 5 days (acute EAE). Immunohistochemical detection of (A) Iba1 (microglia/macrophages) and (B) CD3 in CD4-CKO and WT (Akt3fl/fl) mice (arrows depict lesions) (Scale bars = 1,000 μm). (C) Quantified Iba1+ microglia/macrophages, and (D) CD3+ cells in brain sections of CD4-CKO vs. WT (Akt3fl/fl) mice. (E) Total CD3+ cells the corpus callosum. (F) Total number of inflammatory lesions in the brain. (G) Total CD3+CD4+ T-cells, and (H) CD4+FOXP3+, CD4+IL-17+, and CD4+IFN-γ+ cells in the CNS (brain and spinal cord combined) of WT (CD4Cre) vs. CD4-CKO mice during acute EAE (*p < 0.05, Mann-Whitney U-test and one-way ANOVA).
Figure 8
Figure 8
CD4-CKO mice have increased pro-inflammatory cytokine expression and decreased FOXP3 expression during chronic EAE. Protein was extracted from a 2 mm section of the corpora callosa of chronically ill mice. (A) Protein homogenates were prepared from CD4-CKO and WT (CD4Cre) mice, and protein levels of inflammatory cytokines measured by ELISA (pg/mg total protein) (n = 8–11). (B) Protein levels of inflammatory cytokines in the spinal cord measured by ELISA (pg/mg total protein) (n = 6). (C) Spinal cord mRNA expression of FOXP3 measured by qRT-PCR (n = 6–10). All genes were normalized to HPRT expression. Differences in expression are shown as 2−ΔΔCt. Data were analyzed using 2-way ANOVA, *p < 0.05 is considered statistically significant.
Figure 9
Figure 9
Syn1-CKO mice have similar clinical outcomes to WT mice during MOG-induced EAE. (A) Confirmation of Akt3 knockdown in neurons. Free-floating cross-sections of brains isolated from Syn1-CKO and WT (Syn1Cre) mice immunostained with hematoxylin (top row) or Akt3 antibody (bottom row) and visualized by DAB. (B) Brain and spinal cords were isolated and weighed from naïve 8–10 week old sex-matched mice (n = 3/group) following perfusion with 1× PBS. (C) Syn1-CKO (n = 7) and WT (Akt3fl/fl) (n = 5) mice were subjected to MOG-induced EAE. Mice were monitored daily for signs of clinical progression. No differences were observed between Syn1-CKO and WT over the course of a 23-day period following EAE induction. (D) From top to bottom, lumbar spinal cord sections from WT (Akt3fl/fl) and Syn1-CKO were stained with H&E (top), SMI32, SMI99 (MBP), or Iba1 to assess axonal damage, demyelination, and microglia/macrophage levels, respectively.

References

    1. Chen WS, Xu PZ, Gottlob K, Chen ML, Sokol K, Shiyanova T, et al. . Growth retardation and increased apoptosis in mice with homozygous disruption of the Akt1 gene. Genes Dev. (2001) 15:2203–8. 10.1101/gad.913901 - DOI - PMC - PubMed
    1. Easton RM, Cho H, Roovers K, Shineman DW, Mizrahi M, Forman MS, et al. Role for Akt3/protein kinase B gamma in attainment of normal brain size. Mol Cell Biol. (2005) 25:1869–78. 10.1128/mcb.25.5.1869-1878.2005 - DOI - PMC - PubMed
    1. Cho H, Thorvaldsen JL, Chu Q, Feng F, Birnbaum MJ. Akt1/PKBalpha is required for normal growth but dispensable for maintenance of glucose homeostasis in mice. J Biol Chem. (2001) 276:38349–52. 10.1074/jbc.C100462200 - DOI - PubMed
    1. Tschopp O, Yang ZZ, Brodbeck D, Dummler BA, Hemmings-Mieszczak M, Watanabe T, et al. Essential role of protein kinase B gamma (PKB gamma/Akt3) in postnatal brain development but not in glucose homeostasis. Development. (2005) 132:2943–54. 10.1242/dev.01864 - DOI - PubMed
    1. Manning BD, Cantley LC. AKT/PKB signaling: navigating downstream. Cell. (2007) 129:1261–74. 10.1016/j.cell.2007.06.009 - DOI - PMC - PubMed

Publication types

MeSH terms