

Medical Spending of the US Elderly
- PMID: 31404348
- PMCID: PMC6680320
- DOI: 10.1111/j.1475-5890.2016.12106
Medical Spending of the US Elderly
Abstract
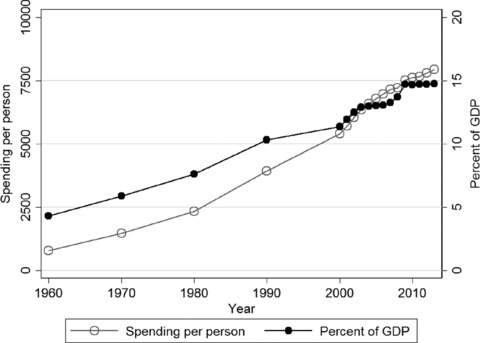
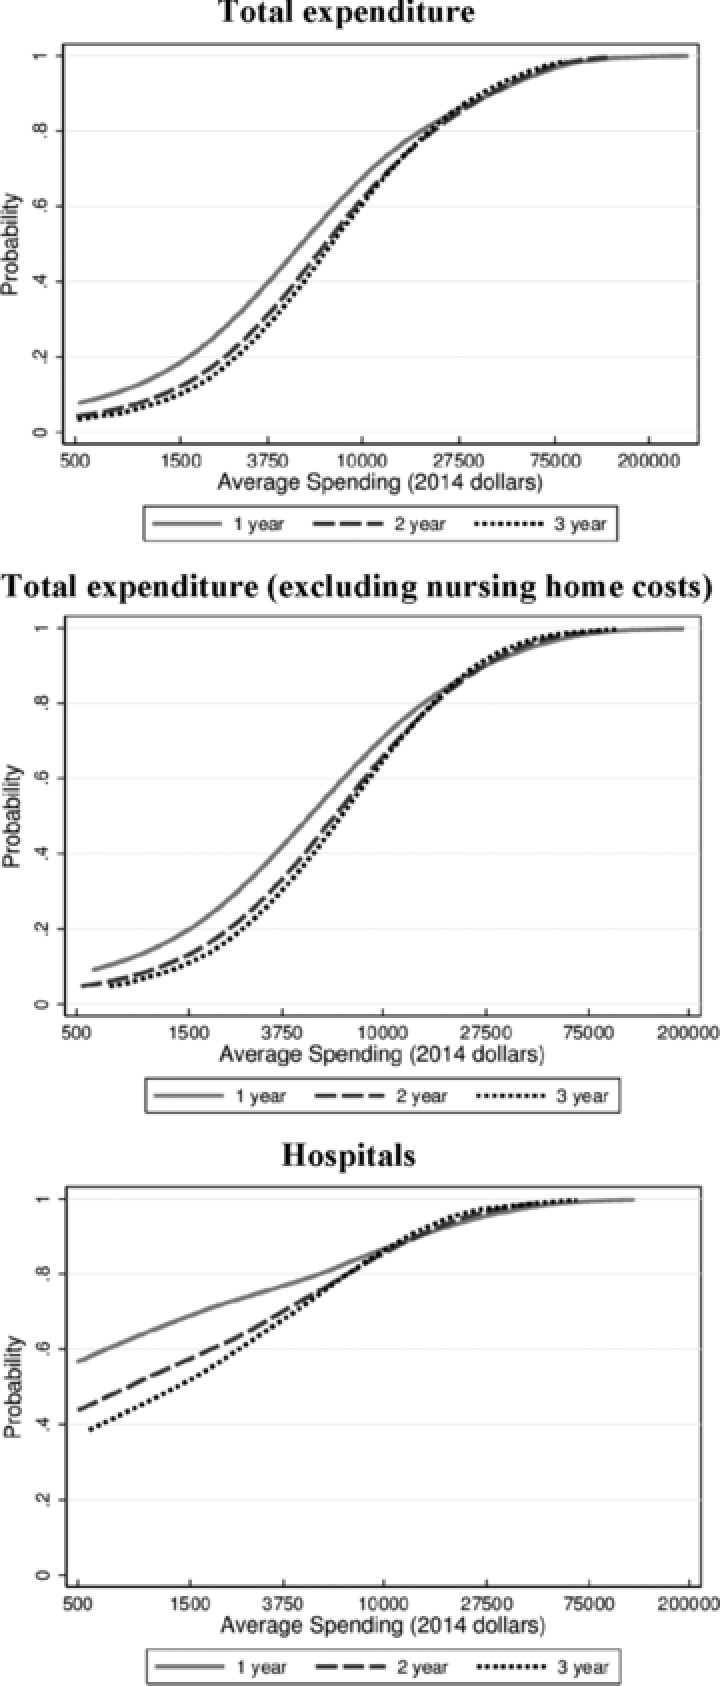
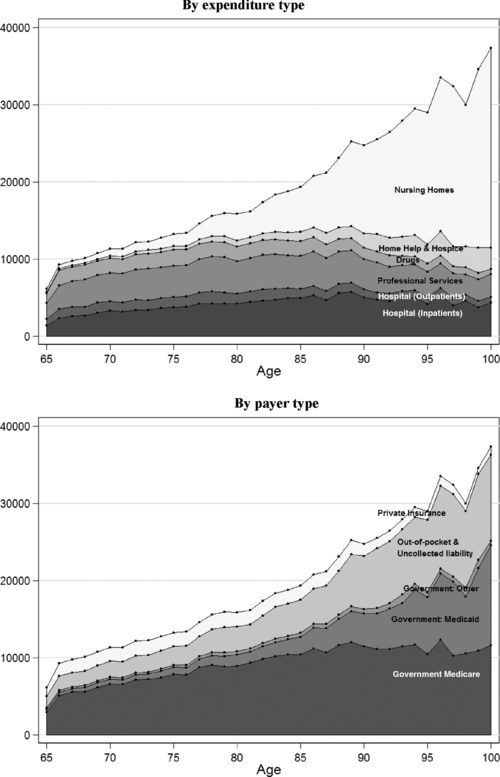
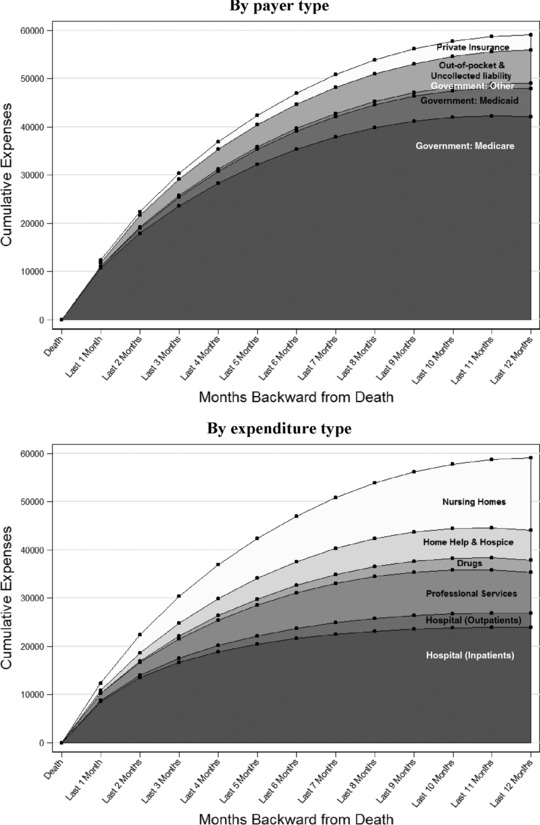
We use data from the Medicare Current Beneficiary Survey (MCBS) to document the medical spending of Americans aged 65 and older. We find that medical expenses more than double between ages 70 and 90 and that they are very concentrated: the top 10 per cent of all spenders are responsible for 52 per cent of medical spending in a given year. In addition, those currently experiencing either very low or very high medical expenses are likely to find themselves in the same position in the future. We also find that the poor consume more medical goods and services than the rich and have a much larger share of their expenses covered by the government. Overall, the government pays for over 65 per cent of the elderly's medical expenses. Despite this, the expenses that remain after government transfers are even more concentrated among a small group of people. Thus, government health insurance, while potentially very valuable, is far from complete. Finally, while medical expenses before death can be large, on average they constitute only a small fraction of total spending, both in the aggregate and over the life cycle. Hence, medical expenses before death do not appear to be an important driver of the high and increasing medical spending found in the US.
Keywords: H51; I13; I14; concentration of medical spending; end‐of‐life medical spending; persistence of medical spending.
Figures
References
-
- Adler, G. S. (1998), ‘Concept and development of the Medicare Current Beneficiary Survey’, in American Statistical Association, Proceedings of the Survey Research Methods Section, pp. 153–5.
-
- Aragón, M. J. , Chalkley, M. and Rice, N. (2016), ‘Medical spending and hospital inpatient care in England: an analysis over time’, Fiscal Studies, vol. 37, pp. 405–32 (this issue).
-
- Bakx, P. , O'Donnell, O. and van Doorslaer, E. (2016), ‘Spending on health care in the Netherlands: not going so Dutch’, Fiscal Studies, vol. 37, pp. 593–625 (this issue).
LinkOut - more resources
Full Text Sources