. 2019 Aug 9;20(16):3888.
doi: 10.3390/ijms20163888.

Analysis of Drought Tolerance and Associated Traits in Upland Cotton at the Seedling Stage

Affiliations

Analysis of Drought Tolerance and Associated Traits in Upland Cotton at the Seedling Stage

Hai-Ming Li et al. Int J Mol Sci. .

Abstract

(1) Background: Upland cotton (Gossypium hirsutum L.) is the most important natural fiber worldwide, and it is extensively planted and plentifully used in the textile industry. Major cotton planting regions are frequently affected by abiotic stress, especially drought stress. Drought resistance is a complex, quantitative trait. A genome-wide association study (GWAS) constitutes an efficient method for dissecting the genetic architecture of complex traits. In this study, the drought resistance of a population of 316 upland cotton accessions was studied via GWAS. (2) Methods: GWAS methodology was employed to identify relationships between molecular markers or candidate genes and phenotypes of interest. (3) Results: A total of 8, 3, and 6 SNPs were associated with the euphylla wilting score (EWS), cotyledon wilting score (CWS), and leaf temperature (LT), respectively, based on a general linear model and a factored spectrally transformed linear mixed model. For these traits, 7 QTLs were found, of which 2 each were located on chromosomes A05, A11, and D03, and of which 1 was located on chromosome A01. Importantly, in the candidate regions WRKY70, GhCIPK6, SnRK2.6, and NET1A, which are involved in the response to abscisic acid (ABA), the mitogen-activated protein kinase (MAPK) signaling pathway and the calcium transduction pathway were identified in upland cotton at the seedling stage under drought stress according to annotation information and linkage disequilibrium (LD) block analysis. Moreover, RNA sequencing analysis showed that WRKY70, GhCIPK6, SnRK2.6, and NET1A were induced by drought stress, and the expression of these genes was significantly different between normal and drought stress conditions. (4) Conclusions: The present study should provide some genomic resources for drought resistance in upland cotton. Moreover, the germplasm of the different phenotypes, the detected SNPs and, the potential candidate genes will be helpful for molecular marker-assisted breeding studies about increased drought resistance in upland cotton.

Keywords: association analysis; drought tolerance; single-nucleotide polymorphism (SNP); upland cotton.


Conflict of interest statement

The authors declare no conflicts of interest.

Figures

Figure 1
Figure 1
Phenotypes and frequency histograms of the mean values of drought resistance traits of 316 accessions. (a) Growth of the cotton population at the seedling stage under normal water conditions; (b) Typical phenotypes of the cotton population at the seedling stage after drought stress; (cf) Frequency histograms of the mean values of the CWS, EWS, LC and LT traits of 316 accessions. CWS: cotyledon wilting score; EWS: euphylla wilting score; LC: leaf chlorophyll content; LT: leaf temperature.
Figure 2
Figure 2
Population structure of 316 upland cotton accessions. (a) Phylogenetic tree of the natural population, FR: foreign region; NEM: the northern specific early maturation region; NW: the northwestern inland region; YR: the Yellow River basin region; YZR: the Yangtze River basin region; (b) Principal component analysis of upland cotton, each dot represents an accession.
Figure 3
Figure 3
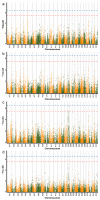
Genome-wide associated study (GWAS) of 316 upland cotton accessions. Manhattan plots of GWAS by using general linear model (GLM) for EWS (a), CWS (b), and LT (c), respectively and by using factored spectrally transformed linear mixed model (FASTLMM) for LT (d). The SNP loci of the red lines (−log10(p) ≥ 5.53) were considered suggestive association makers; the SNP loci of the blue lines (−log10(p) ≥ 6.53) were considered significant association makers. Each dot represents an SNP.
Figure 4
Figure 4
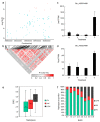
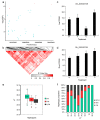
LD block on chromosome A05 and identification of the candidate gene Gh_A05G3499. (a) Association signal of the EWS in the region from 89.0–90.6 Mb on chromosome A05. (b) Distribution of the LD block on chromosome A05. The pair-wise LDs between the SNPs are indicated as D’ values, where the grey and dark red colors indicate 0 and 1, respectively. (c,d) Expression level of the candidate gene Gh_A05G3499 (WRKY70) calculated based on RNA-seq analysis of leaves and roots. (e) Box plots for phenotypic values of the haplotypes on chromosome A05 for the EWS trait. (f) Percent stacking bar chart of several types of haplotypes for the EWS trait. CK: 75% ± 5% of RWC; T1: 60% ± 5% of RWC; T2: 45% ± 5% of RWC; T3: 30% ± 5% of RWC. The asterisks indicate the significance of Student’s t-test and ** means 1% level of significance. FH: favorable haplotype; HH: heterozygous haplotype; UFH: unfavorable haplotype; EWS: euphylla wilting score. The black multiplication sign indicates the mean value, the middle black line indicates the median, the box represents the range from the 25th to 75th percentile of all the data, and the outer dots are outliers.
Figure 5
Figure 5
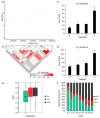
LD block on chromosome A05 and identification of the candidate gene Gh_A05G0418. (a) Association signal of the CWS in the region from 4.30–4.83 Mb on chromosome A05. (b) Distribution of the LD block on chromosome A05. The pair-wise LDs between the SNPs are indicated as D’ values, where the grey and dark red colors indicate 0 and 1, respectively. (c,d) Expression level of the candidate gene Gh_A05G0418 (CIPK6) calculated based on RNA-seq analysis of the leaves and roots. (e) Box plots of the phenotypic values of the haplotypes on chromosome A05 for the CWS trait. (f) Percent stacking bar chart of several types of haplotypes for the CWS trait. CK: 75% ± 5% of RWC; T1: 60% ± 5% of RWC; T2: 45% ± 5% of RWC; T3: 30% ± 5% of RWC. The asterisks indicate the significance of Student’s t-test, and * and ** mean the 5% and 1% levels of significance, respectively. FH: favorable haplotype; HH: heterozygous haplotype; UFH: unfavorable haplotype; CWS: cotyledon wilting score. The black multiplication sign indicates the mean value, the middle black line indicates the median, the box represents the range from the 25th to 75th percentile of all the data, and the outer dots are outliers.
Figure 6
Figure 6
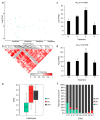
LD block on chromosome A11 and identification of the candidate gene Gh_A11G1858. (a) Association signal of the CWS in the region from 45.0–45.8 Mb on chromosome A11. (b) Distribution of the LD block on chromosome A11. The pair-wise LDs between the SNPs are indicated as D’ values, where the grey and dark red colors indicate 0 and 1, respectively. (c,d) Expression level of the candidate gene Gh_A11G1858 (SnRK2.6) calculated based on RNA-seq analysis of the leaves and roots. (e) Box plots of the phenotypic values of the haplotypes on chromosome A11 for the CWS trait. (f) Percent stacking bar chart of several types of haplotypes for the CWS trait. CK: 75% ± 5% of RWC; T1: 60% ± 5% of RWC; T2: 45% ± 5% of RWC; T3: 30% ± 5% of RWC. The asterisks indicate the significance of Student’s t-test, and * and ** mean the 5% and 1% levels of significance, respectively. FH: favorable haplotype; HH: heterozygous haplotype; UFH: unfavorable haplotype; CWS: cotyledon wilting score. The black multiplication sign indicates the mean value, the middle black line indicates the median, the box represents the range from the 25th to 75th percentile of all the data, and the outer dots are outliers.
Figure 7
Figure 7
LD block on chromosome D03 and identification of the candidate gene Gh_D03G0728. (a) Association signal of the LT in the region from 25.3.0–26.0 Mb on chromosome D03. (b) Distribution of the LD block on chromosome D03. The pair-wise LDs between the SNPs are indicated as D’ values, where the grey and dark red colors indicate 0 and 1, respectively. (c,d) Expression level of the candidate gene Gh_D03G0728 calculated based on RNA-seq analysis of the leaves and roots. (e) Box plots of the phenotypic values of the haplotypes on chromosome D03 for the LT trait. (f) Percent stacking bar chart of several types of haplotypes for the LT trait. CK: 75% ± 5% of RWC; T1: 60% ± 5% of RWC; T2: 45% ± 5% of RWC; T3: 30% ± 5% of RWC. The asterisks indicate the significance of Student’s t-test and ** means and 1% levels of significance. FH: favorable haplotype; HH: heterozygous haplotype; UFH: unfavorable haplotype; LT: leaf temperature. The black multiplication sign indicates the mean value, the middle black line indicates the median, the box represents the range from the 25th to 75th percentile of all the data, and outer dots are outliers.

References

    1. Fang Y., Xiong L. General mechanisms of drought response and their application in drought resistance improvement in plants. Cell Mol. Life Sci. 2015;72:673–689. doi: 10.1007/s00018-014-1767-0. - DOI - PMC - PubMed
    1. Riaz M., Farooq J., Sakhawat G., Mahmood A., Sadiq M.A., Yaseen M. Genotypic variability for root/shoot parameters under water stress in some advanced lines of cotton (Gossypium hirsutum L.) Genet. Mol. Res. 2013;12:552–561. doi: 10.4238/2013.February.27.4. - DOI - PubMed
    1. Rizza F., Badeck F.W., Cattivelli L., Lidestri O., Di Fonzo N., Stanca A.M. Use of a water stress index to identify barley genotypes adapted to rainfed and irrigated conditions. Crop Sci. 2004;44:2127–2137. doi: 10.2135/cropsci2004.2127. - DOI
    1. Saranga Y., Menz M., Jiang C.X., Wright R.J., Yakir D., Paterson A.H. Genomic dissection of genotype x environment interactions conferring adaptation of cotton to arid conditions. Genome Res. 2001;11:1988–1995. doi: 10.1101/gr.157201. - DOI - PubMed
    1. Chen Z.J., Scheffler B.E., Dennis E., Triplett B.A., Zhang T.Z., Guo W.Z., Chen X.Y., Stelly D.V., Rabinowica P.D., Town C.D., et al. Toward sequencing cotton (Gossypium) genomes. Plant Physiol. 2007;145:1303–1310. doi: 10.1104/pp.107.107672. - DOI - PMC - PubMed