. 2019 Oct;78(10):1379-1387.
doi: 10.1136/annrheumdis-2018-214865. Epub 2019 Aug 12.

Single-cell analysis reveals fibroblast heterogeneity and myofibroblasts in systemic sclerosis-associated interstitial lung disease

Affiliations

Single-cell analysis reveals fibroblast heterogeneity and myofibroblasts in systemic sclerosis-associated interstitial lung disease

Eleanor Valenzi et al. Ann Rheum Dis. 2019 Oct.

Abstract

Objectives: Myofibroblasts are key effector cells in the extracellular matrix remodelling of systemic sclerosis-associated interstitial lung disease (SSc-ILD); however, the diversity of fibroblast populations present in the healthy and SSc-ILD lung is unknown and has prevented the specific study of the myofibroblast transcriptome. We sought to identify and define the transcriptomes of myofibroblasts and other mesenchymal cell populations in human healthy and SSc-ILD lungs to understand how alterations in fibroblast phenotypes lead to SSc-ILD fibrosis.

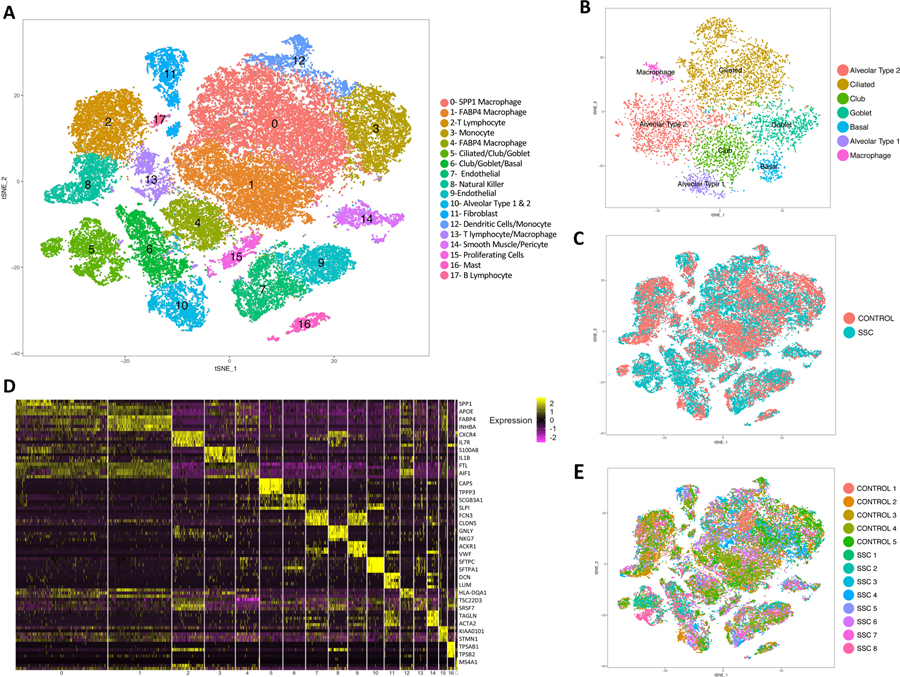
Methods: We performed droplet-based, single-cell RNA-sequencing with integrated canonical correlation analysis of 13 explanted lung tissue specimens (56 196 cells) from four healthy control and four patients with SSc-ILD, with findings confirmed by cellular indexing of transcriptomes and epitopes by sequencing in additional samples.

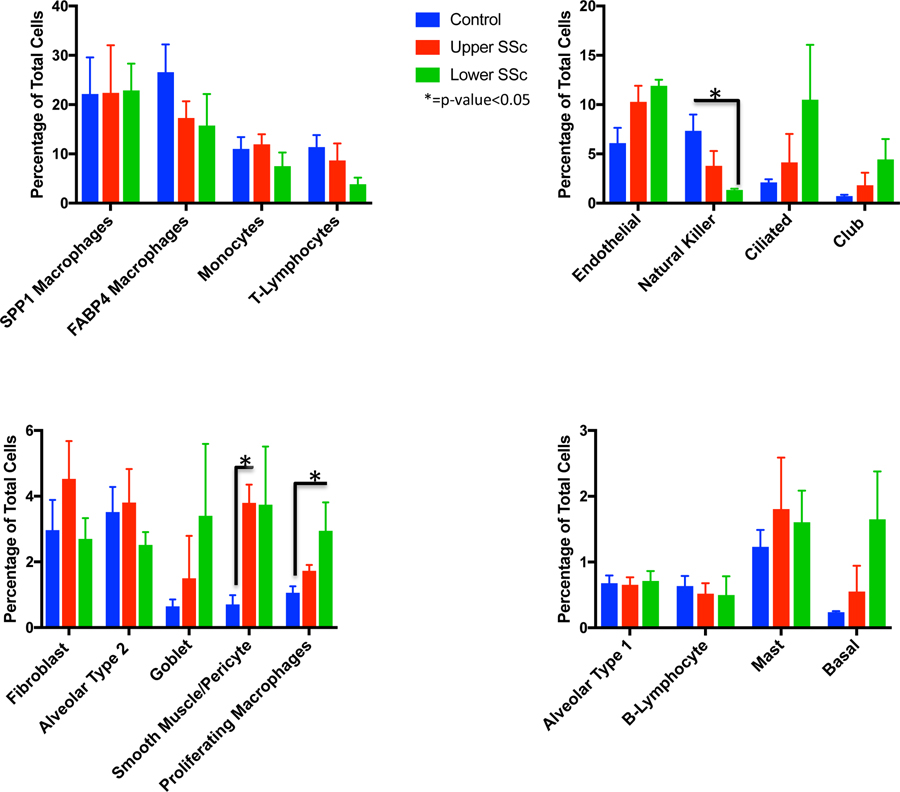
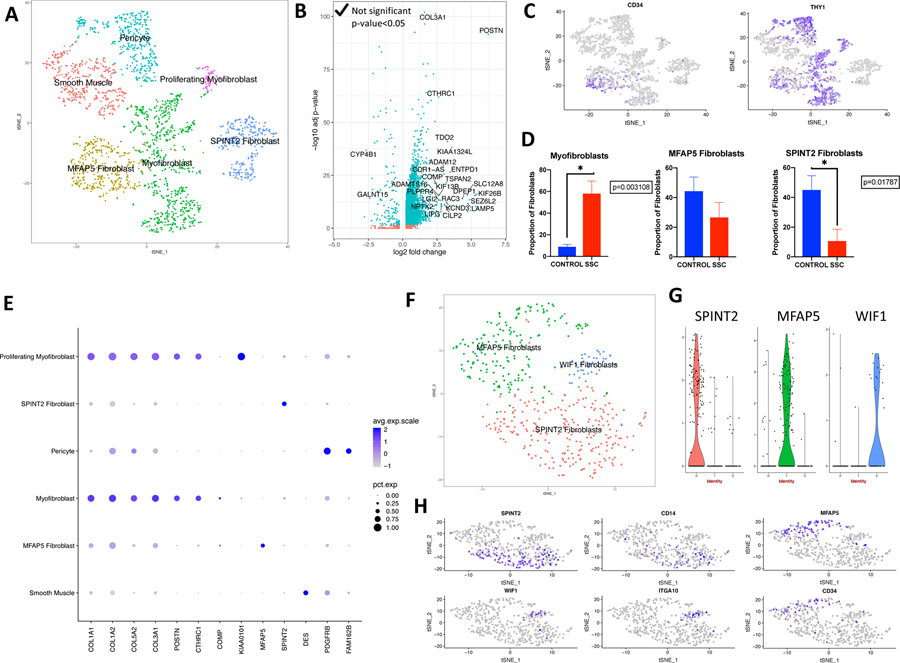
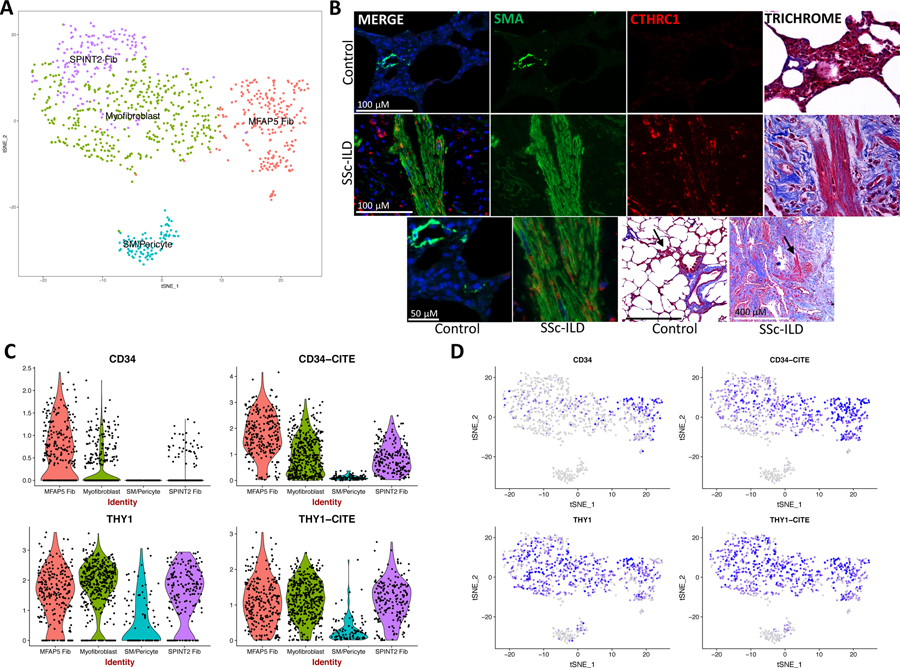
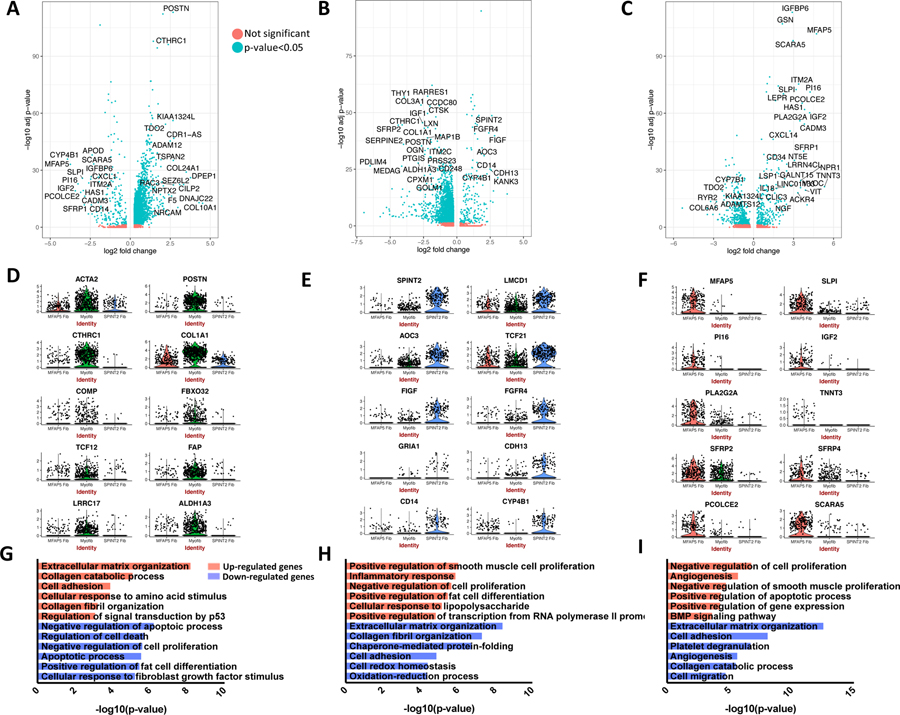
Results: Examination of gene expression in mesenchymal cells identified two major, SPINT2hi and MFAP5hi, and one minor, WIF1hi, fibroblast populations in the healthy control lung. Combined analysis of control and SSc-ILD mesenchymal cells identified SPINT2hi, MFAP5hi, few WIF1hi fibroblasts and a new large myofibroblast population with evidence of actively proliferating myofibroblasts. We compared differential gene expression between all SSc-ILD and control mesenchymal cell populations, as well as among the fibroblast subpopulations, showing that myofibroblasts undergo the greatest phenotypic changes in SSc-ILD and strongly upregulate expression of collagens and other profibrotic genes.

Conclusions: Our results demonstrate previously unrecognised fibroblast heterogeneity in SSc-ILD and healthy lungs, and define multimodal transcriptome-phenotypes associated with these populations. Our data indicate that myofibroblast differentiation and proliferation are key pathological mechanisms driving fibrosis in SSc-ILD.

Keywords: fibroblast; pulmonary fibrosis; systemic sclerosis.


Conflict of interest statement

Competing interests: RL has received consulting fees from PRISM BioLab, Merck, Bristol Myers Squibb, Biocon, Formation, Genentech/Roche, UCB and Sanofi, and grant support from Elpidera, Kiniksa and Regeneron, outside the submitted work.

Figures

Figure 1
Figure 1
Single-cell RNA-sequencing analysis of 5 human healthy control and 8 SSc-ILD lung tissue samples. (A) Visualization of clustering by t-SNE plot of all 13 combined healthy control and SSc-ILD samples, identified by cell type. (B) Reclustering of the original clusters (clusters 5,6, and 10 in Figure 1A) containing multiple bronchial and alveolar epithelial cell types demonstrating separation into individual epithelial cell types. (C) t-SNE plot of cells colored according to disease status, all clusters contained cells from both SSc and control samples (D) Heat map of scaled gene expression data for the top 5 differentially expressed genes identifying each cluster, with selected genes listed. (E) t-SNE plot of cells colored according to sample of origin, demonstrating all clusters contain cells from all samples. t-SNE, t-distributed stochastic neighbor embedding; SSc-ILD, systemic sclerosis-associated interstitial lung disease.
Figure 2
Figure 2
Mean percentage of total cells comprised of each cell type, comparing control, upper lobe SSc-ILD, and lower lobe SSc-ILD samples. Bars indicate the mean percentage of total cells with error bars indicating the standard error of the mean. *=p-value<0.05. SSc-ILD, systemic sclerosis-associated interstitial lung disease.
Figure 3
Figure 3
Single-cell RNA-sequencing analysis of human healthy control and SSc-ILD mesenchymal cell populations. (A) t-SNE plot of combined fibroblast, smooth muscle/pericyte, and proliferating fibroblast cells as identified by cell type and fibroblast subpopulations. (B) Volcano plot of differentially expressed genes (log2 fold change>0.5, adjusted p-value <0.05) from the comparison of all SSc fibroblasts to all control fibroblasts. Results showed that 461 genes were up-regulated and 115 genes were down-regulated by greater than twofold. (C) Gene expression of CD34, demonstrating high CD34 expression in MFAP5 fibroblasts, and THY1, demonstrating high THY1 expression in myofibroblasts, MFAP5hi fibroblasts, and pericytes. (D) Mean proportion of total fibroblasts that each fibroblast subpopulation comprises in SSc-ILD and control lungs, calculated by individual sample. (E) Expression of selected collagen and cell type specific genes by mesenchymal population. Dot size corresponds to the percentage of cells in a cluster expressing the gene, and dot color corresponds to the average expression level for the gene in the cluster. (F) t-SNE plot of healthy control fibroblasts only (G) Violin plots of gene expression of SPINT 2, MFAP5, and WIF1 by control fibroblast cluster. (H) Gene expression plots demonstrating high expression of SPINT2 and CD14 in SPINT2hi fibroblasts, MFAP5 and CD34 in MFAP5hi fibroblasts, and WIF1 and ITGA10 in WIF1hi fibroblasts. Dot color corresponds to the level of gene expression in each cell. d t-SNE, t-distributed stochastic neighbor embedding; SSc-ILD, systemic sclerosis-associated interstitial lung disease.
Figure 4
Figure 4
CITE-seq of four additional SSc-ILD (SSc 9–12) and one additional healthy control lung (Control 6) and immunofluorescence staining of SSc-ILD and control lung. (A) t-SNE plot of combined fibroblast, smooth muscle, and pericyte cells, identified by subpopulation/cluster. (B) Serial sections of control and SSc-ILD lung with immunofluorescence with DAPI nuclear staining and trichrome staining. SMA and CTHRC1 coexpress in areas of disorganized myofibroblasts, with SMA+/CTHRC1- cells staining smooth muscle. Trichrome staining demonstrates excessive collagen deposition (blue) in SSc-ILD lungs. (C) Violin plots of gene expression of CD34 and THY1 and protein expression of CD34 (labeled as CD34-CITE) and CD90/THY1 (labeled as THY1-CITE) as detected by oligonucleotide-labeled antibodies. D) Gene and protein expression of CD34 and THY1 (CD90). Dot color corresponds to the level of gene expression in each cell. t-SNE, t-distributed stochastic neighbor embedding; SSc-ILD, systemic sclerosis-associated interstitial lung disease; DAPI, 4’,6-diamidino-2-phenylindole; SMA, α-smooth muscle actin; CTHRC1, collagen triple helix repeat containing 1.
Figure 5
Figure 5
Differential gene expression comparing each major fibroblast cluster (myofibroblast, SPINT2hi fibroblast, MFAP5hi fibroblast) to the other two. A-C Volcano plots include all differentially expressed genes with absolute value log2 fold change>0.5, and are colored by adjusted p-value <0.05 or not. D-F Violin plots demonstrate gene expression of selected distinguishing genes for each fibroblast subpopulation. G-I Enriched GO biological processes for the differentially expressed up-regulated and down-regulated genes for each comparison of one major fibroblast cluster to the other two. Functional enrichment analysis was performed using DAVID with all differentially expressed genes with adjusted p-value <0.05 and absolute value log2 fold change>0.5 included. (A), (D), and (G) display results of myofibroblast to SPINT2 hi fibroblast and MFAP5 hi fibroblast comparison. (B), (E), and (H) display results of SPINT 2 hi fibroblast to myofibroblast and MFAP5 hi fibroblast comparison. (C), (F), and (I) display results of MFAP5 hi fibroblast to myofibroblast and SPINT2 hi fibroblast comparison. DAVID, Database for Annotation, Visualization, and Integrated Discovery.

References

    1. Steen VD, Medsger TA. Changes in causes of death in systemic sclerosis, 1972–2002. Ann Rheum Dis 2007. July; 66(7):940–944. - PMC - PubMed
    1. Dowson C, Simpson N, Duffy L, O’Reilly S. Innate Immunity in Systemic Sclerosis. Curr Rheumatol Rep 2017. January; 19(1):2. - PubMed
    1. Lafyatis R Transforming growth factor beta--at the centre of systemic sclerosis. Nat Rev Rheumatol 2014. December; 10(12):706–719. - PubMed
    1. van den Hoogen F, Khanna D, Fransen J, Johnson SR, Baron M, Tyndall A, et al. 2013 classification criteria for systemic sclerosis: an American college of rheumatology/European league against rheumatism collaborative initiative. Ann Rheum Dis 2013. November; 72(11):1747–1755. - PubMed
    1. Bagnato G, Harari S. Cellular interactions in the pathogenesis of interstitial lung diseases. Eur Respir Rev 2015. March; 24(135):102–114. - PMC - PubMed

Publication types

MeSH terms