. 2019 Aug 27;116(35):17592-17597.
doi: 10.1073/pnas.1906569116. Epub 2019 Aug 12.

Energy metabolism controls phenotypes by protein efficiency and allocation

Affiliations

Energy metabolism controls phenotypes by protein efficiency and allocation

Yu Chen et al. Proc Natl Acad Sci U S A. .

Abstract

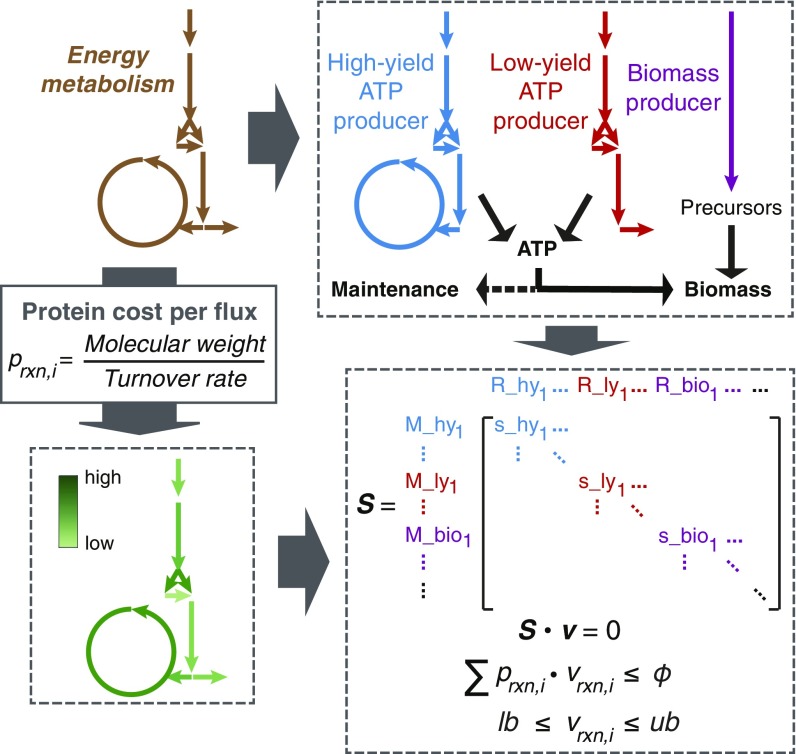
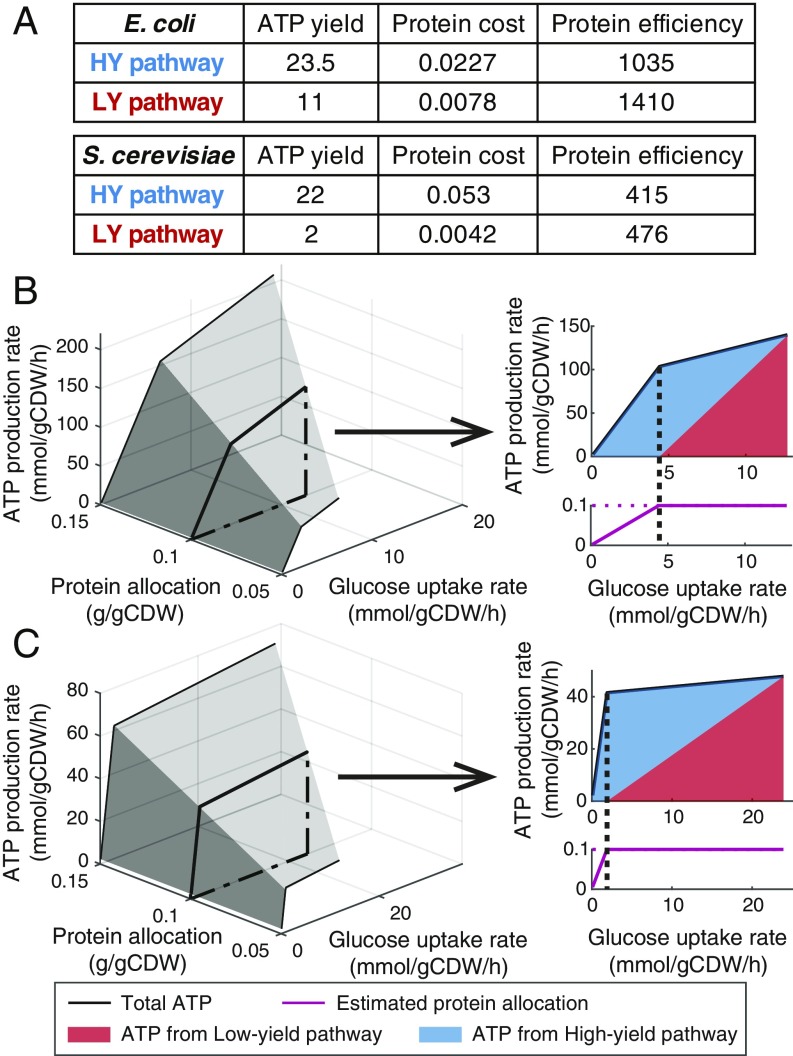
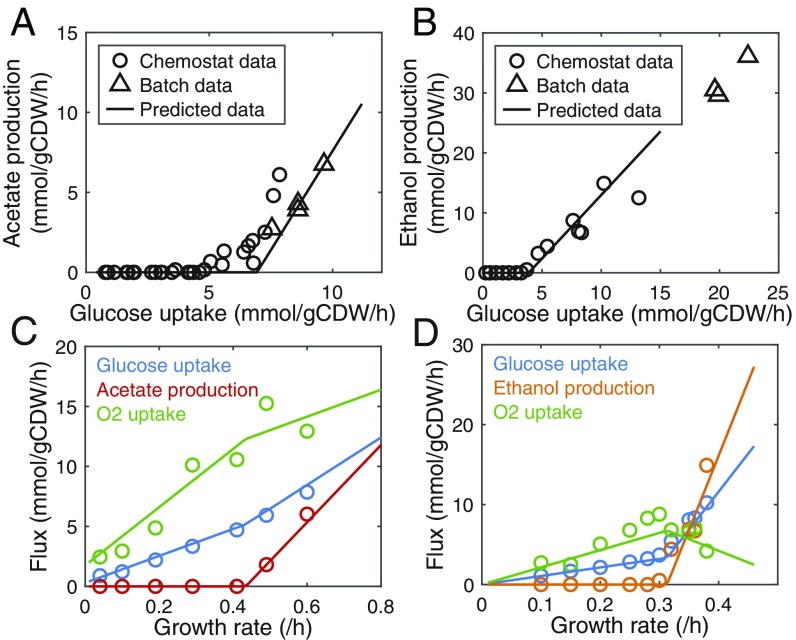
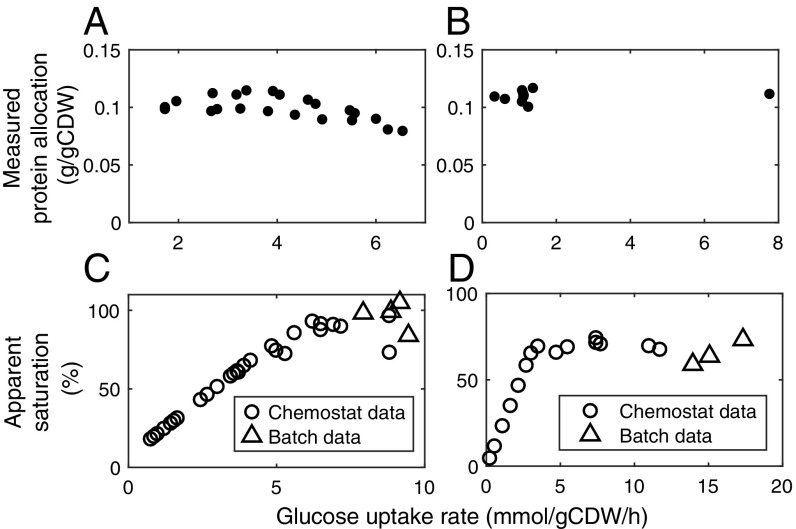
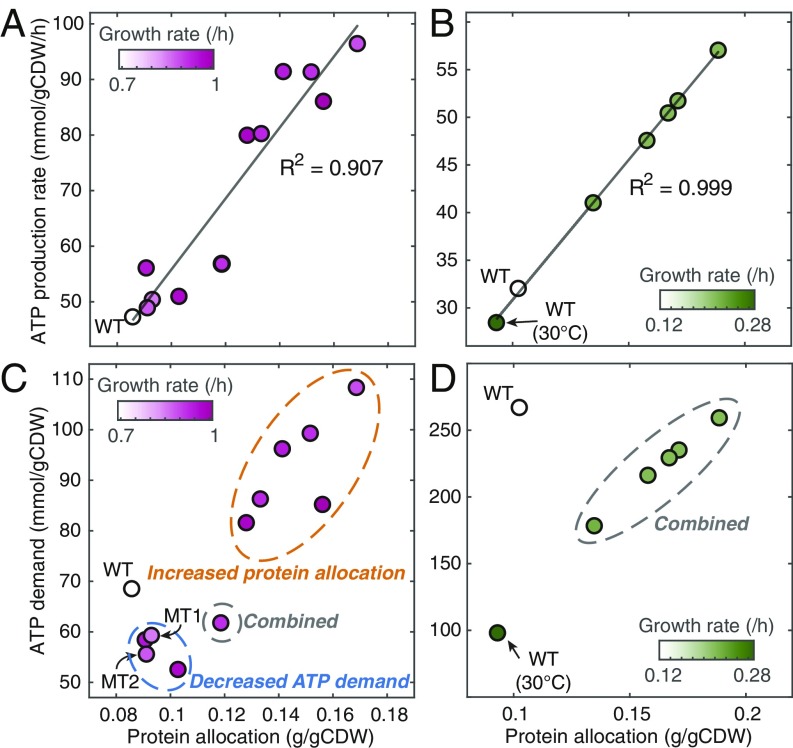
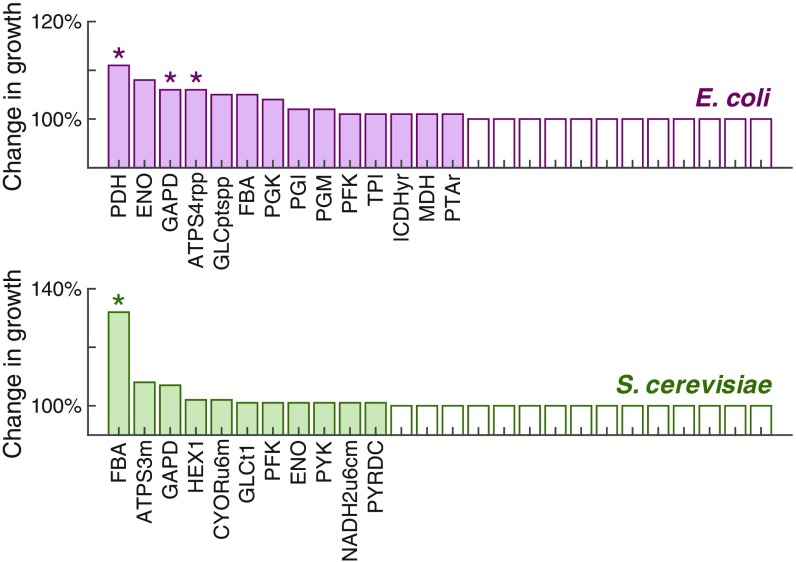
Cells require energy for growth and maintenance and have evolved to have multiple pathways to produce energy in response to varying conditions. A basic question in this context is how cells organize energy metabolism, which is, however, challenging to elucidate due to its complexity, i.e., the energy-producing pathways overlap with each other and even intertwine with biomass formation pathways. Here, we propose a modeling concept that decomposes energy metabolism into biomass formation and ATP-producing pathways. The latter can be further decomposed into a high-yield and a low-yield pathway. This enables independent estimation of protein efficiency for each pathway. With this concept, we modeled energy metabolism for Escherichia coli and Saccharomyces cerevisiae and found that the high-yield pathway shows lower protein efficiency than the low-yield pathway. Taken together with a fixed protein constraint, we predict overflow metabolism in E. coli and the Crabtree effect in S. cerevisiae, meaning that energy metabolism is sufficient to explain the metabolic switches. The static protein constraint is supported by the findings that protein mass of energy metabolism is conserved across conditions based on absolute proteomics data. This also suggests that enzymes may have decreased saturation or activity at low glucose uptake rates. Finally, our analyses point out three ways to improve growth, i.e., increasing protein allocation to energy metabolism, decreasing ATP demand, or increasing activity for key enzymes.

Keywords: Escherichia coli; Saccharomyces cerevisiae; constraint-based modeling; growth rate; metabolic switch.


Conflict of interest statement

The authors declare no conflict of interest.

Figures

Fig. 1.
Fig. 1.
Overview of modeling energy metabolism. The modeling process includes 2 parts. One is to decompose energy metabolism into 3 independent pathways, i.e., HY ATP producer, LY ATP producer, and biomass producer. The ATP producers generate ATP, which is used for biomass formation and maintenance. The other is to estimate protein cost per flux for each reaction in the network, which is calculated using molecular weight and turnover rate of the enzyme that catalyzes the reaction. By doing so, constraint-based simulations can be performed, which can take into account the constraints of not only mass balance and bounds, but also total protein allocation to energy metabolism.
Fig. 2.
Fig. 2.
Model properties and simulations. (A) Model-inferred properties of energy metabolism in E. coli and S. cerevisiae. ATP yield: ATP produced per glucose consumed (Unit: molATP per molGlucose); Protein cost: protein mass required per flux (mmol/gCDW/h) of glucose (Unit: g/gCDW); Protein efficiency: ATP produced per protein mass per time (Unit: mmolATP/gProtein/h). (B) Simulations using E. coli model. (C) Simulations using S. cerevisiae model.
Fig. 3.
Fig. 3.
Model predictions of metabolic switches compared with experimental data. Circle represents data from chemostats, triangle represents data from batch cultures, and line represents predicted data. (A) Comparison between predicted and measured acetate production rate in E. coli. Chemostat data were obtained from figure 5 of ref. , which were originally reported in refs. – and ; batch data were from refs. –. (B) Comparison between predicted and measured ethanol production rate in S. cerevisiae. Chemostat data were obtained from figure 3 of ref. , which were originally reported in refs. and ; batch data were from refs. –. (C) Comparison between predicted and measured exchange rates in E. coli. Data were from chemostats (4). (D) Comparison between predicted and measured exchange rates in S. cerevisiae. Data were from chemostats (9).
Fig. 4.
Fig. 4.
Analyses of protein allocation and saturation in energy metabolism. (A) Total protein mass of energy metabolism in E. coli. Data were from ref. . (B) Total protein mass of energy metabolism in S. cerevisiae. Data were from ref. . (C) Apparent saturation in E. coli. (D) Apparent saturation in S. cerevisiae.
Fig. 5.
Fig. 5.
Simulations of exponential growth. (A) Correlation between ATP production rate and protein allocation to energy metabolism in E. coli. (B) Correlation between ATP production rate and protein allocation to energy metabolism in S. cerevisiae. (C) Plot of ATP demand for biomass formation versus protein allocation to energy metabolism for E. coli strains. MT1 and MT2 are knock-in mutant strains, rpoBE546V and rpoBE672K, respectively from the study (25). (D) Plot of ATP demand for biomass formation versus protein allocation to energy metabolism for S. cerevisiae strains.
Fig. 6.
Fig. 6.
Predicted change in growth rate after doubling turnover rate of each reaction in the models. The x axis only presents the reactions that can affect growth rate. Reaction ID is consistent with that in Datasets S1 and S2. The asterisk represents experimental evidence for the reaction: PDH (45), DAPD (46), ATPS4rpp (47), and FBA (48).

References

    1. Zakrzewska A., et al. , Genome-wide analysis of yeast stress survival and tolerance acquisition to analyze the central trade-off between growth rate and cellular robustness. Mol. Biol. Cell 22, 4435–4446 (2011). - PMC - PubMed
    1. Caspeta L., et al. , Altered sterol composition renders yeast thermotolerant. Science 346, 75–78 (2014). - PubMed
    1. Pfeiffer T., Schuster S., Bonhoeffer S., Cooperation and competition in the evolution of ATP-producing pathways. Science 292, 504–507 (2001). - PubMed
    1. Vemuri G. N., Altman E., Sangurdekar D. P., Khodursky A. B., Eiteman M. A., Overflow metabolism in Escherichia coli during steady-state growth: Transcriptional regulation and effect of the redox ratio. Appl. Environ. Microbiol. 72, 3653–3661 (2006). - PMC - PubMed
    1. Valgepea K., et al. , Systems biology approach reveals that overflow metabolism of acetate in Escherichia coli is triggered by carbon catabolite repression of acetyl-CoA synthetase. BMC Syst. Biol. 4, 166 (2010). - PMC - PubMed

Publication types