. 2019 Sep 27;294(39):14422-14441.
doi: 10.1074/jbc.RA119.008713. Epub 2019 Aug 12.

A ubiquitin-like domain controls protein kinase D dimerization and activation by trans-autophosphorylation

Affiliations

A ubiquitin-like domain controls protein kinase D dimerization and activation by trans-autophosphorylation

Daniel J Elsner et al. J Biol Chem. .

Abstract

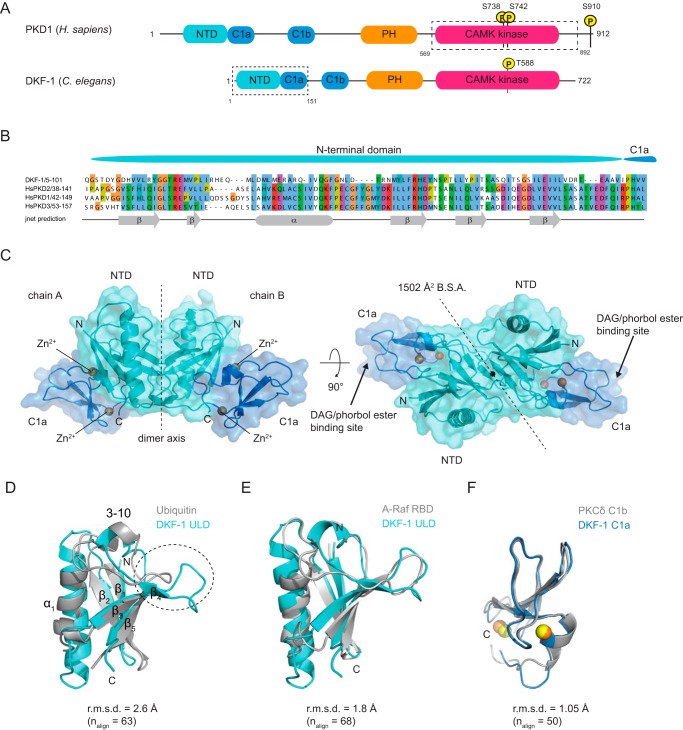
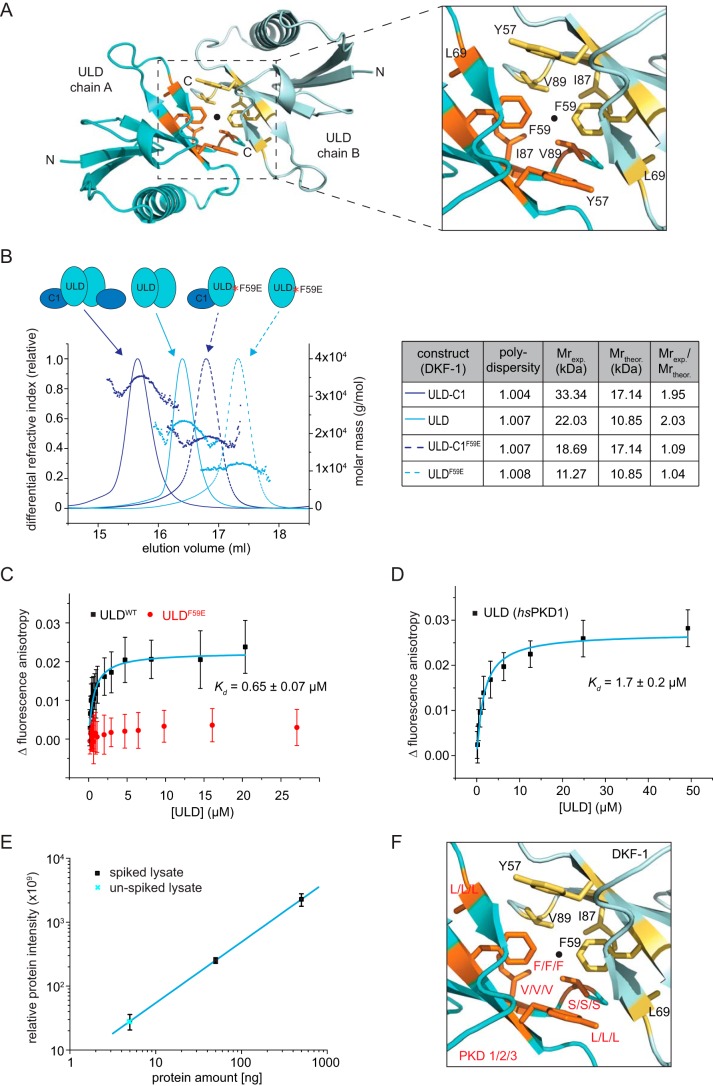
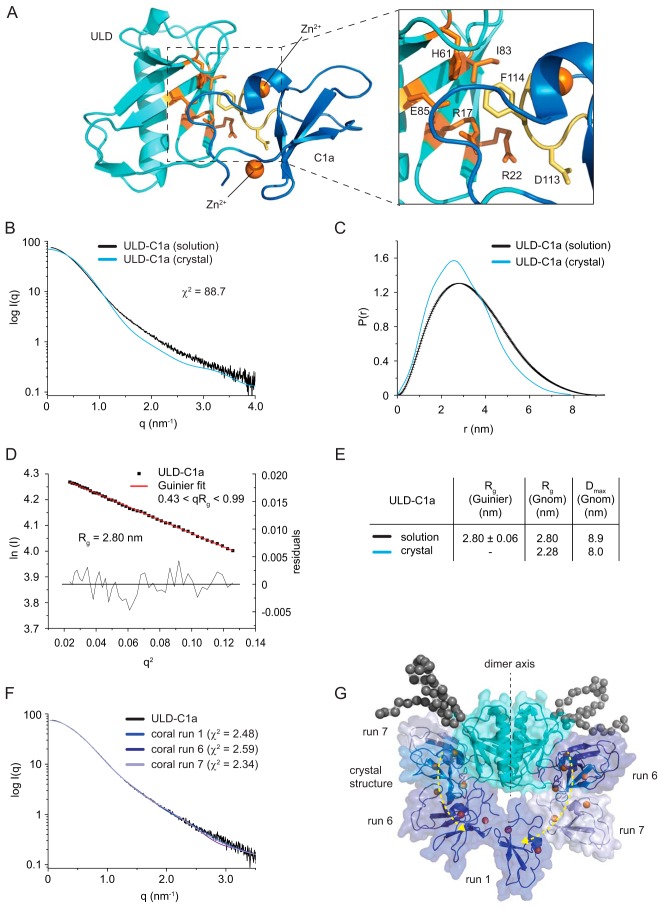
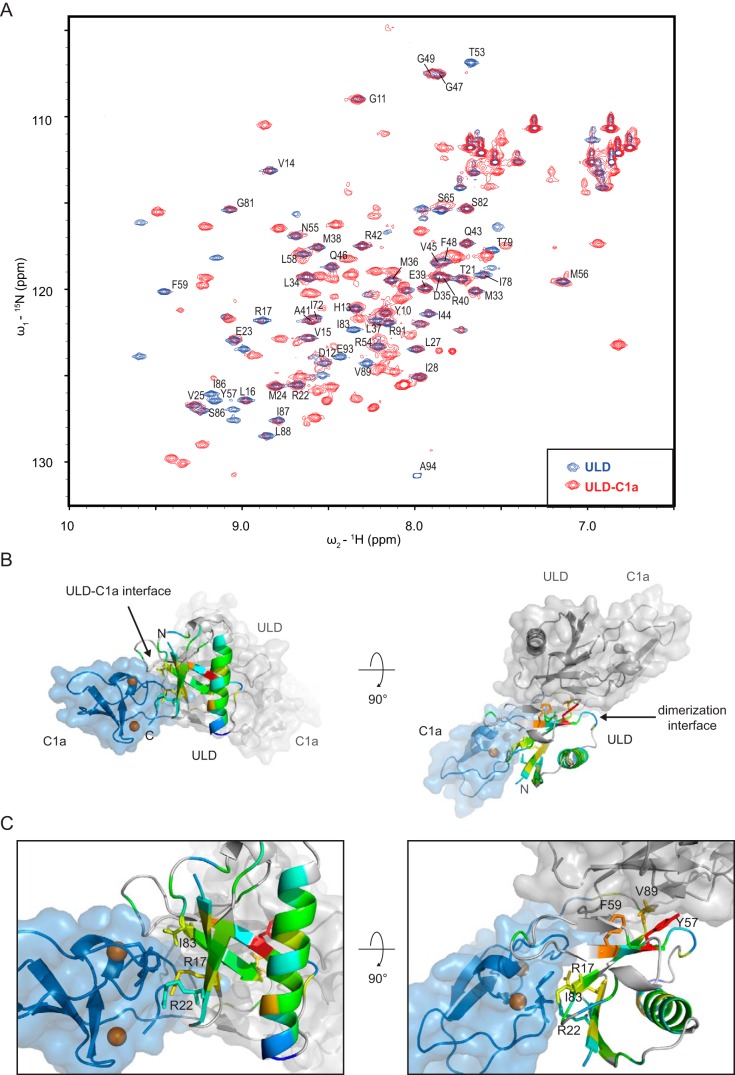
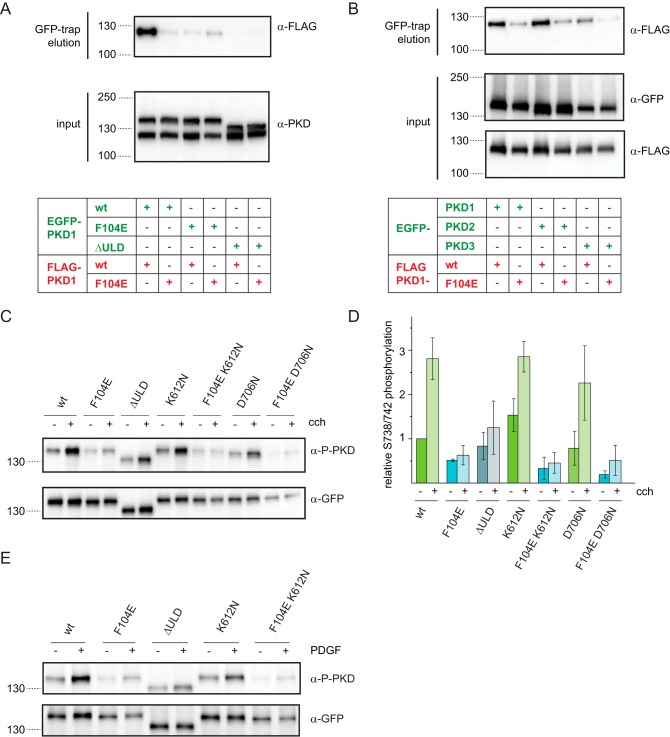
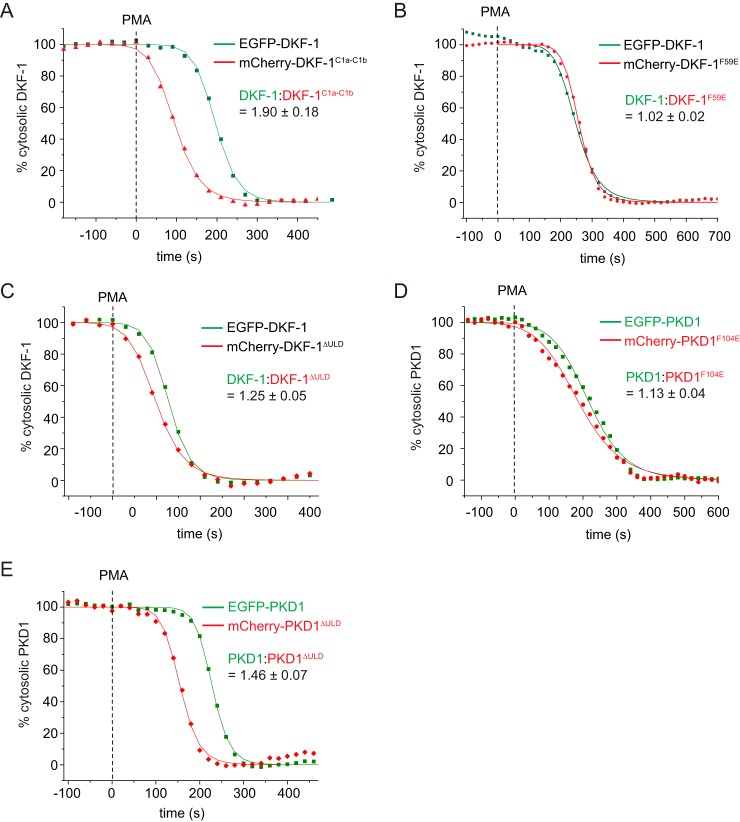
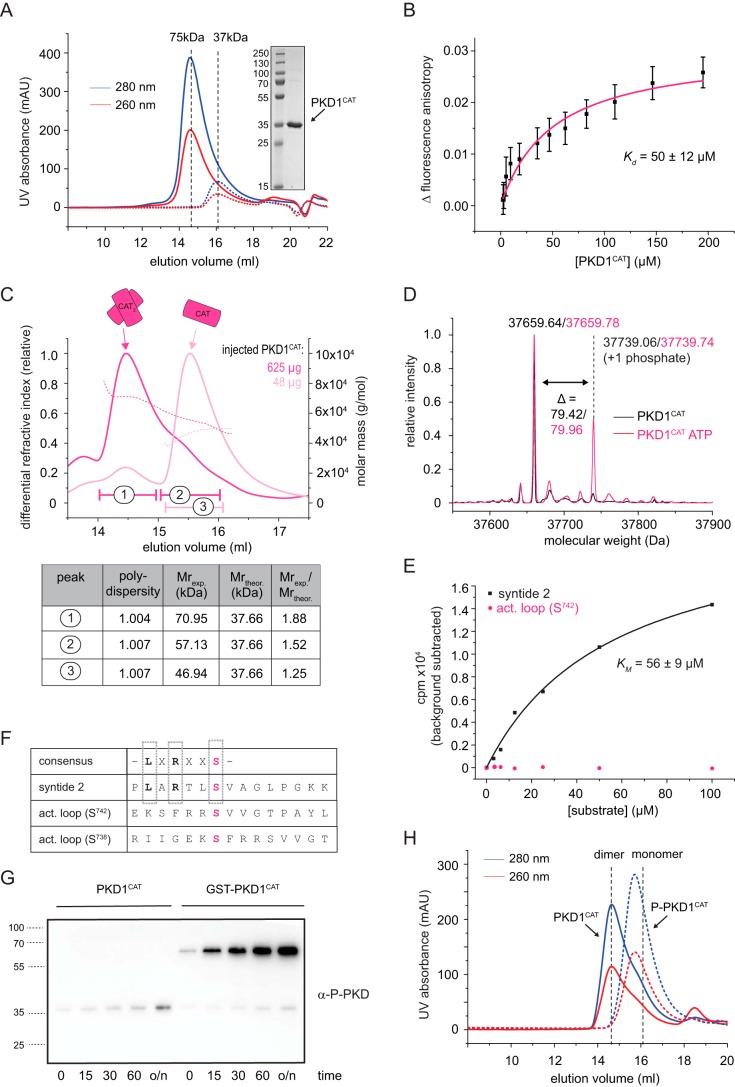
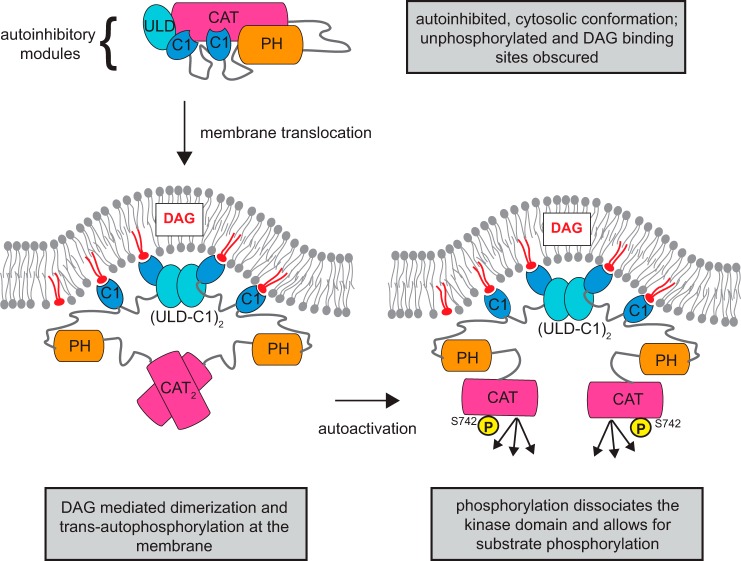
Protein kinase D (PKD) is an essential Ser/Thr kinase in animals and controls a variety of diverse cellular functions, including vesicle trafficking and mitogenesis. PKD is activated by recruitment to membranes containing the lipid second messenger diacylglycerol (DAG) and subsequent phosphorylation of its activation loop. Here, we report the crystal structure of the PKD N terminus at 2.2 Å resolution containing a previously unannotated ubiquitin-like domain (ULD), which serves as a dimerization domain. A single point mutation in the dimerization interface of the ULD not only abrogated dimerization in cells but also prevented PKD activation loop phosphorylation upon DAG production. We further show that the kinase domain of PKD dimerizes in a concentration-dependent manner and autophosphorylates on a single residue in its activation loop. We also provide evidence that PKD is expressed at concentrations 2 orders of magnitude below the ULD dissociation constant in mammalian cells. We therefore propose a new model for PKD activation in which the production of DAG leads to the local accumulation of PKD at the membrane, which drives ULD-mediated dimerization and subsequent trans-autophosphorylation of the kinase domain.

Keywords: autophosphorylation; crystal structure; diacylglycerol; dimerization; protein kinase D (PKD); second messenger; signal transduction; structural biology; ubiquitin-like domain.


Conflict of interest statement

The authors declare that they have no conflicts of interest with the contents of this article

Figures

Figure 1.
Figure 1.
The PKD N terminus contains a ubiquitin-like domain. A, canonical domain architecture of PKDs illustrated by Homo sapiens PKD1 and C. elegans DKF-1; N-terminal domain (NTD), C1a, C1b, PH, and kinase domain belonging to the CAMK family. The putative NTD was identified by bioinformatics analysis. The dashed boxes indicate the construct used for crystallization (DKF-11–151) and autophosphorylation experiments (PKD1569–892). Domains and linkers are drawn to scale. B, alignment of the N-terminal domain of C. elegans DKF-1 with the three human PKD isoforms. Secondary structure prediction of the PKD N terminus reveals the presence of a putative domain composed of potential β-sheets (β) and one α-helix (α). C, representation of the crystal structure of the dimeric DKF-11–151 with NTD in cyan, C1a in blue, and Zn2+ ions in orange. Arrows indicate the DAG/phorbol ester binding cleft (by homology). B.S.A., buried surface area. D, superposition of the NTD (DKF-1 ULD) with ubiquitin (PDB entry 1UBQ). The secondary structure elements are annotated (see also Fig. S1B). E, superposition of the NTD (DKF-1 ULD) with the Ras-binding domain (RBD) of A-Raf (PDB entry 1WXM). F, superposition of the C1a domain (DKF-1 C1a) with the C1b domain of PKCδ (PKCδ C1b) (PDB entry 1PTQ).
Figure 2.
Figure 2.
Concentration-dependent dimerization of the ULD via a hydrophobic patch. A, the ULD dimerization interface buries 1502 Å2 of surface area and is predominantly hydrophobic in character. B, static light scattering (SEC-MALS) of the ULD–C1a construct (purple, solid line) and the ULD alone (cyan, solid line) and the same proteins carrying a phenylalanine-to-glutamate point mutation (F59E) in the dimerization interface (dashed lines). The table summarizes the polydispersity (Mn/Mw) as well as the experimentally determined molecular weight (Mexp), the theoretical monomeric molecular weight (Mtheor), and the oligomeric state (Mexp/Mtheor) of each protein. C, titration of DKF-1 ULD (ULDWT) or ULDF59E into a fixed amount of Atto488-labeled ULDR42C. The change in fluorescence anisotropy is plotted against the concentration of ULDWT/ULDF59E ([ULD]). Data points represent the mean and S.D. (error bars) of 29–37 technical replicates. For the ULD, data points were fitted with a single-site binding model (cyan line) to derive the equilibrium dissociation constant (Kd) of ULD dimerization. D, equilibrium dissociation constant (Kd) of human PKD1ULD determined by fluorescence anisotropy. The fluorescence anisotropy of 40 nm Atto488-ULD increases when unlabeled ULD is added to it. Data points are the mean and S.D. of 26–63 technical replicates and were fitted with a single binding model to derive the Kd of dimerization. E, summed, globally normalized intensities of five proteotypic PKD1 peptides targeted by parallel reaction monitoring MS for different amounts (5, 50, 500 ng) of spiked-in recombinant PKD1 protein (black squares) or unspiked cell lysates (cyan crosses). From each spiked sample, the signal of the unspiked sample was subtracted. S.D. is from three biological replicates. The linear regression of the spiked samples was used to calculate the amount of endogenous PKD1 in unspiked cells. F, close-up of the dimerization interface as in Fig. 2A. All hydrophobic residues in the interface are highlighted as sticks, one protomer in yellow and the other one in orange. Not all of the residues are identical between DKF-1 (black) and the three human isoforms (PKD1/2/3, red label at corresponding positions in the DKF-1 structure). However, all residues in the interface are identical for all three human PKD isoforms.
Figure 3.
Figure 3.
The ULD dimer restricts the orientation of the membrane-binding sites of the C1 domain. A, The orientation of the C1 domain with respect to the ULD is mediated by a patch of conserved residues on the ULD (orange) and C1a (yellow). B, small-angle X-ray scattering curve of the crystallized protein (DKF-11–151) in solution (black line) compared with the theoretical scattering curve calculated from the crystal structure (blue line) using CRYSOL (32). The high χ2 value indicates that the crystal structure does not match the solution scattering. C, pair distribution function of DKF-11–151 derived from the SAXS data (black line) and the crystal structure (blue line). D, Guinier plot of the solution scattering data. The interval of 0.43 < qRg < 0.99 was used to determine the radius of gyration (Rg) by a linear regression of the data. Residuals of the fit are shown below. E, comparison of the Rg and the maximum dimension (Dmax) of the ULD–C1a protein derived from the solution-scattering data (solution) and calculated from the crystal structure (crystal). The radius of gyration was derived either from the Guinier plot or from the pair distribution function. F, rigid-body modeling of the ULD–C1a using CORAL (32). Shown is the scattering curve of the ULD–C1a in solution (black line) and theoretical scattering curves of models that best fit the experimental scattering. The χ2 values represent the goodness of fit of the models to the experimental data. G, superposition of the crystal structure and the structures obtained by rigid-body modeling with the lowest χ2 values (see F). Black spheres represent dummy spheres for N-terminal residues not visible in the crystal structure.
Figure 4.
Figure 4.
The ULD and C1a domain interact reversibly in solution. A, overlay of 15N and 1H resonances of two HSQC experiments on DKF-11–94 (ULD, blue peaks) and DKF-11–151 (ULD–C1a, red peaks). B, changes in peak intensities of the amide backbone 15N and 1H cross-resonances as seen in Fig. 4A were mapped onto the ULD of the crystal structure. The color code is from blue (no decrease in intensity) to red (highest change in intensity). Peaks that could not be assigned are represented in gray. C, close-up of B. Some of the residues in the ULD C1a interface (Arg17, Arg22, and Ile83), but also in the dimerization interface (Tyr57, Phe59, and Val89) display altered intensity.
Figure 5.
Figure 5.
ULD dimerization is required for PKD activation in cells. A, EGFP- and FLAG-tagged PKD1 constructs were co-expressed in HEK293T cells and subjected to co-immunoprecipitation using GFP-trap. Expression levels of transgenes and co-immunoprecipitated proteins were detected by Western blotting using a PKD-specific antibody (α-PKD) and FLAG tag–specific antibody (α-FLAG), respectively. The blot is representative of three biological replicates. B, FLAG-tagged PKD1 and PKD1F104E were co-expressed with EGFP-tagged PKD1, PKD2, and PKD3 in HEK293T cells. Lysates were probed for expression levels by Western blotting using GFP-specific and FLAG-specific antibodies (α-GFP and α-FLAG, respectively). Co-immunoprecipitate (GFP-trap) was probed with a FLAG-specific antibody. The figure is representative of three independent experiments. C, HEK293T cells expressing EGFP-PKD1 constructs were stimulated with 10 μm carbachol for 15 min at 37 °C. Western blotting shows activation loop phosphorylation at Ser738/Ser742 (α-P-PKD) as well as EGFP-PKD1 expression levels (α-GFP). K612N and D706N are two different kinase-dead versions of PKD. D, quantification of C by densitometry. Activation loop phosphorylation signal (α-P-PKD) was divided by the total EGFP-PKD1 signal (α-GFP) and normalized to unstimulated WT. Mean and S.D. (error bars) are derived from three independent experiments. E, NIH3T3 cells expressing the same EGFP-PKD1 constructs as in C were stimulated with 1 μm human PDGF-BB (50 ng/ml) for 30 min at 37 °C. PKD activation was assessed by Western blotting using phospho-Ser738/Ser742–specific antibody (α-P-PKD). Expression levels were probed with GFP-specific antibodies. The blots are representative of three independent experiments.
Figure 6.
Figure 6.
The ULD stabilizes the autoinhibited conformation of PKDs in cells. A–E, live cell membrane translocation assay. Cytoplasmic fluorescence intensities of COS7 cells co-expressing EGFP- and mCherry-tagged PKD variants measured by confocal microscopy. The fluorescent tags are spectrally separated, and the depletion of cytoplasmic intensity is monitored upon the addition of the plasma membrane ligand PMA at the indicated time points (squares or triangles). Depletion of cytosolic fluorescence intensity was fitted with a logistic fit function (line) to determine half-maximum translocation time. Depicted is one representative translocation curve for WT and mutant PKD proteins from a single cell. The mean ratio of the half-maximum translocation time and the respective S.D. was determined from several individual cells (n ≥ 4). A, EGFP-tagged full-length DKF-1 (DKF-11–722) was co-expressed with mCherry-tagged C1a-C1b domains (DKF-195–239); n = 5. B, EGFP-tagged full-length DKF-1 (DKF-11–722) co-expressed with mCherry-tagged DKF-1 carrying the monomerizing point mutation in the ULD (DKF-1F59E); n = 6. C, EGFP-tagged full-length DKF-1 (DKF-11–722) co-expressed with mCherry-tagged DKF-1 lacking the ULD (DKF-1ΔULD); n = 4. D, EGFP-tagged human full-length PKD1 (PKD11–912) co-expressed with mCherry-tagged PKD1 carrying the monomerizing point mutation in the ULD (PKD1F104E); n = 5. E, EGFP-tagged human full-length PKD1 (PKD11–912) co-expressed with mCherry-tagged PKD1 lacking the ULD (PKD1ΔULD); n = 4.
Figure 7.
Figure 7.
The PKD1 kinase domain autophosphorylates on its activation loop in vitro. A, size-exclusion chromatography (S200 10/300) of the purified kinase domain of PKD1 (PKD1CAT). Inset, Coomassie-stained SDS-PAGE loaded with a molecular weight marker ranging from 15 to 250 kDa and the pooled and concentrated fractions of the first run (solid lines). For this, 500 μl of 3 mg/ml (solid line) were injected onto the column. Injecting only 0.3 mg/ml (dotted line) shifts the elution volume. Dashed line, expected elution volumes for a monomeric (37-kDa) or dimeric (75-kDa) kinase domain derived from calibration of the column with globular molecular weight standards. B, fluorescence anisotropy of Atto488-labeled PKD1CAT (80 nm) as a function of increased, unlabeled PKD1CAT. The averaged change in fluorescence anisotropy (black squares) and the S.D. were derived from 31–60 technical replicates. To derive a Kd, the individual data points were fitted with a single binding mode (magenta line). C, static light scattering (SEC-MALS) of PKD1CAT. The peak fractions of the first run (625 μg, dark magenta) were pooled, and the same volume was reinjected onto the system (48 μg, light magenta). The table summarizes the polydispersity (Mn/Mw), the experimentally determined molecular weight (Mexp.), and the oligomeric state (Mexp./Mtheor.) for two peaks of the first run (1 and 2) and one peak of the second run (3). The manually selected peak boundaries are indicated on the chromatogram. D, intact MS of purified PKD kinase domain (black, PKD1CAT) and the same protein incubated at a concentration of 10 μm with 1 mm ATP and 2 mm MgCl2 at room temperature overnight (magenta, PKD1CAT ATP). E, radiometric kinase assay using PKD1CAT, [γ-32P]ATP, and a conventional CAMK peptide substrate (syntide 2, black) or a peptide resembling the activation loop of PKD1 (act. loop (S742), magenta). The increase in radioactivity was plotted against the substrate concentration. Fitting the data points for syntide 2 to a Michaelis–Menten equation, a Km of 56 ± 9 μm was derived. The experiment was repeated three times with similar results. F, table indicates the consensus substrate sequence of PKD, displaying a leucine (L) at the −5 position and an arginine (R) at the −3 position with respect to the phosphorylatable Ser (or Thr) residue. X, any amino acid. The synthetic peptide syntide 2, a CAMK substrate, conforms to the PKD consensus motif. Both phosphorylation sites in the activation loop (Ser738 and Ser742), however, do not resemble a PKD consensus substrate site. Syntide 2 and the peptide covering amino acids 736–750 of the activation loop of PKD1 (act. loop (S742)) were used in the radiometric kinase assay. G, activation loop phosphorylation investigated by immunoblot using the anti-Ser738/742 antibody. 1 μm recombinant PKD1CAT or 1 μm recombinant GST-PKD1CAT was incubated with 1 mm ATP and 2 mm MgCl2 at room temperature, and a sample was taken at the indicated time points (0, 15, 30, and 60 min and overnight (o/n)), mixed with 2× SDS-loading dye, and immediately boiled at 95 °C. 10 ng of each sample were then subjected to SDS-PAGE and blotted for immunoblot analysis. H, size-exclusion profile of PKD1CAT (solid line) and stoichiometrically phosphorylated PKD1CAT (P-PKD1CAT, dashed line). The black dashed lines indicate the elution volume expected for a monomeric or dimeric kinase domain and are derived from the calibration of the column with globular protein standards.
Figure 8.
Figure 8.
Model of PKD autoactivation by ULD dimerization. PKD transitions from an autoinhibitory cytosolic conformation to an active DAG-bound conformation. Arrows indicate the sequence of events in this proposed activation mechanism. In the cytosol, the autoinhibitory conformation is maintained by the regulatory ULD, C1, and PH domains. This conformation is presumably unphosphorylated and monomeric, and the DAG-binding sites of the C1 domains are sequestered in this autoinhibitory conformation. When DAG is generated, PKD translocates to the membrane. The engagement of the C1a and C1b to DAG releases the autoinhibition of the kinase domain. Also, the increase in local concentration leads to dimerization of the ULD, which facilitates kinase domain dimerization and trans-autophosphorylation in the activation loop. Ultimately, phosphorylation of Ser742 breaks the dimeric arrangement of the kinase domains, which allows the kinase domains to engage and phosphorylate the substrates.

References

    1. Fielitz J., Kim M.-S., Shelton J. M., Qi X., Hill J. A., Richardson J. A., Bassel-Duby R., and Olson E. N. (2008) Requirement of protein kinase D1 for pathological cardiac remodeling. Proc. Natl. Acad. Sci. U.S.A. 105, 3059–3063 10.1073/pnas.0712265105 - DOI - PMC - PubMed
    1. Liljedahl M., Maeda Y., Colanzi A., Ayala I., Van Lint J., and Malhotra V. (2001) Protein kinase D regulates the fission of cell surface destined transport carriers from the trans-Golgi network. Cell 104, 409–420 10.1016/S0092-8674(01)00228-8 - DOI - PubMed
    1. Sinnett-Smith J., Jacamo R., Kui R., Wang Y. M., Young S. H., Rey O., Waldron R. T., and Rozengurt E. (2009) Protein kinase D mediates mitogenic signaling by Gq-coupled receptors through protein kinase C-independent regulation of activation loop Ser744 and Ser748 phosphorylation. J. Biol. Chem. 284, 13434–13445 10.1074/jbc.M806554200 - DOI - PMC - PubMed
    1. Sumara G., Formentini I., Collins S., Sumara I., Windak R., Bodenmiller B., Ramracheya R., Caille D., Jiang H., Platt K. A., Meda P., Aebersold R., Rorsman P., and Ricci R. (2009) Regulation of PKD by the MAPK p38δ in insulin secretion and glucose homeostasis. Cell 136, 235–248 10.1016/j.cell.2008.11.018 - DOI - PMC - PubMed
    1. Zhang Z., Meszaros G., He W.-T., Xu Y., de Fatima Magliarelli H., Mailly L., Mihlan M., Liu Y., Puig Gámez M., Goginashvili A., Pasquier A., Bielska O., Neven B., Quartier P., Aebersold R., et al. (2017) Protein kinase D at the Golgi controls NLRP3 inflammasome activation. J. Exp. Med. 214, 2671–2693 10.1084/jem.20162040 - DOI - PMC - PubMed

Publication types

MeSH terms