Review
. 2019;95(7):321-342.
doi: 10.2183/pjab.95.024.

Towards higher-Tc superconductors

Affiliations
Review

Towards higher-Tc superconductors

Jun Akimitsu. Proc Jpn Acad Ser B Phys Biol Sci. 2019.

Abstract

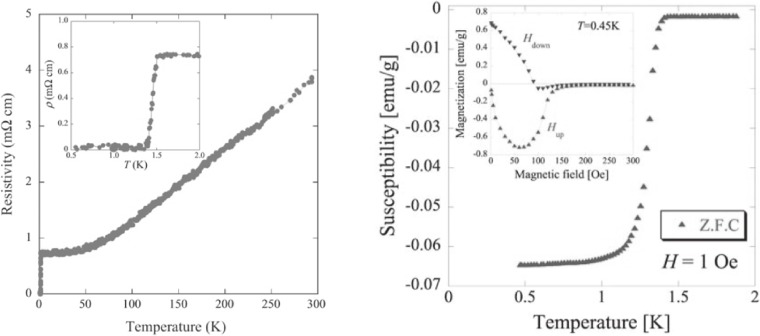
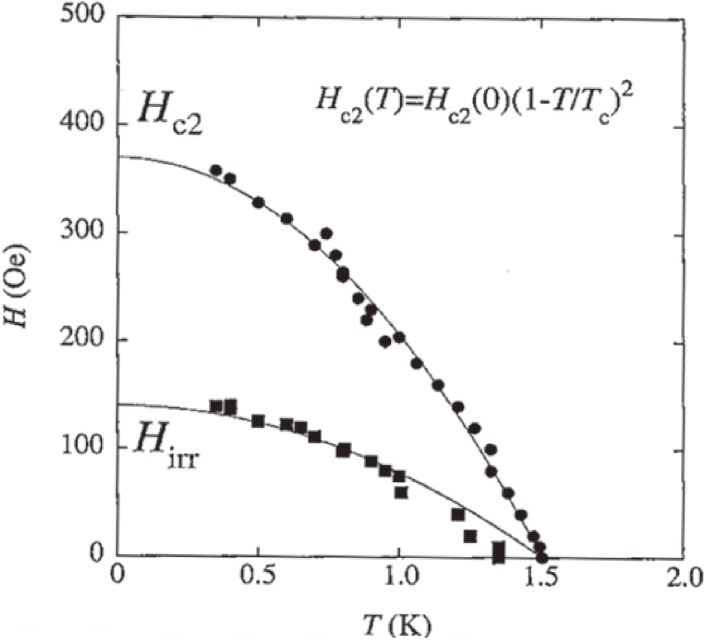
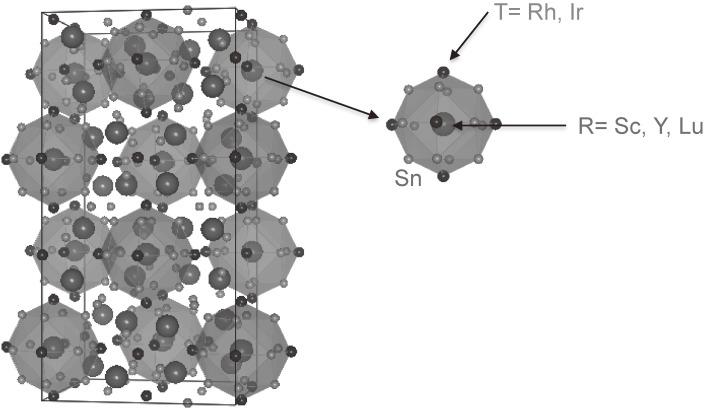
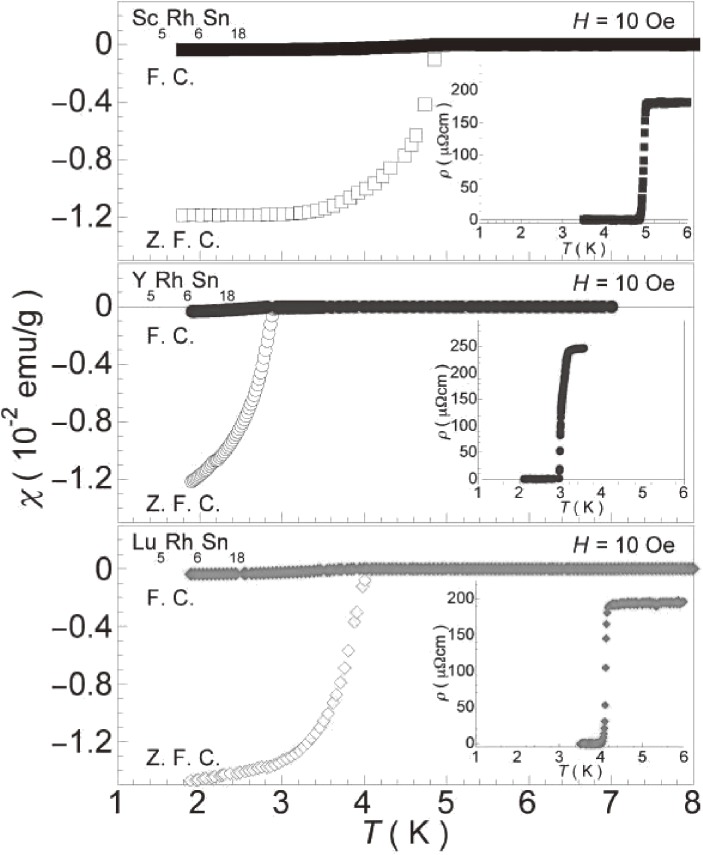
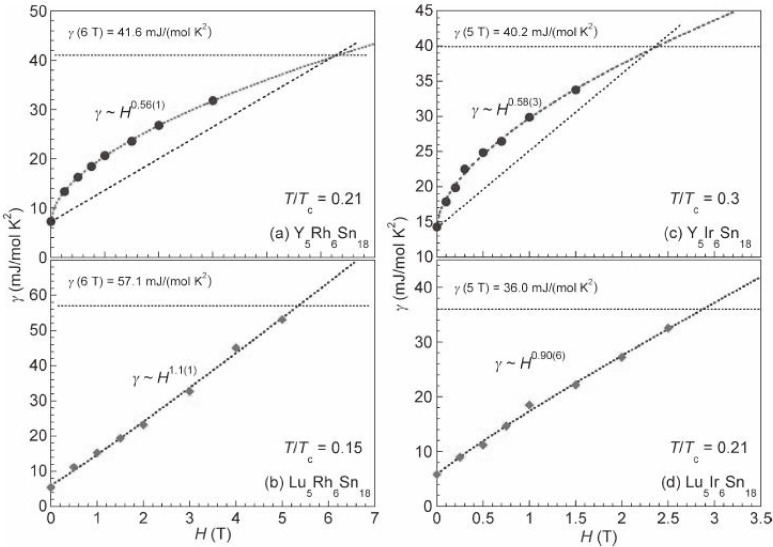
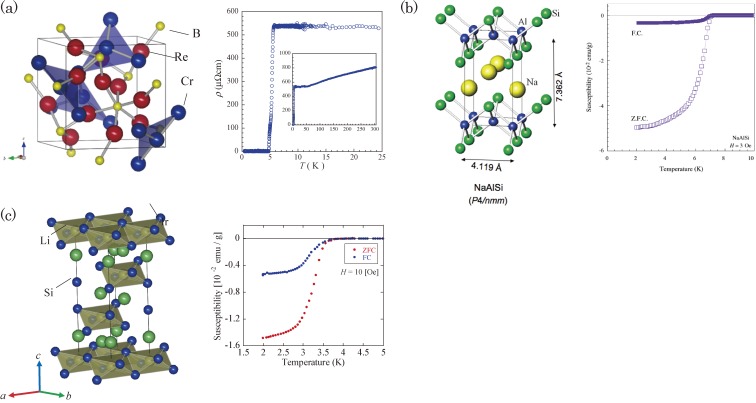
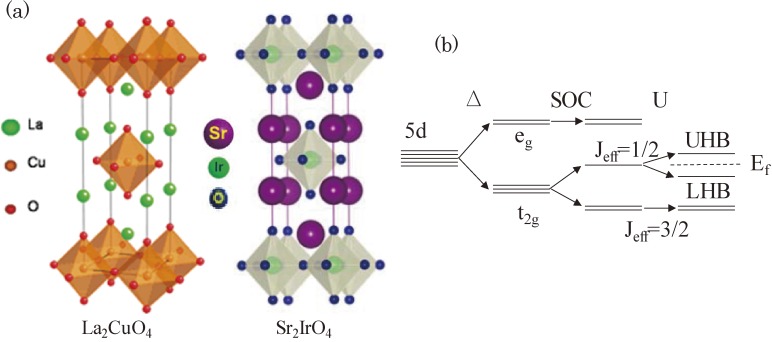
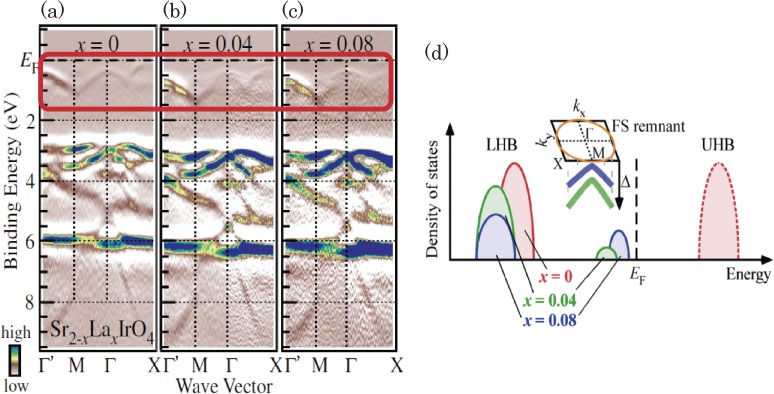
New superconductors discovered in the Akimitsu laboratory are reviewed here. These materials can be categorized into two groups:1) Cu-oxide superconductors.1-1 Cu-oxide system having CuO2 planes.1-2 Ladder lattice superconductor.2) Exploration of new metal-based superconductors.2-1 MgB2 and its application.2-2 Y2C3.2-3 Carrier-doped wide-gap semiconductors.2-4 New superconductor with a cage-type structure: R5T6Sn18 (R = Sc, Y, Lu; T = Rh, Ir).Finally, all of the new superconductors discovered in our laboratory are summarized. The outlook for the high-Tc superconductors and our present work are also described.

Keywords: Cu-oxide system; Ir oxide; MgB2; doped semiconductors; high-Tc superconductors; ladder superconductor.


Figures

Figure 1.
Figure 1.
Phase diagram of the electron-phonon coupling constant V vs. superconducting critical temperature Tc. (N. Tsuda, K. Nasu, J. Fujimori and K. Siratori: Electronic Conduction in Oxide (in Japanese) p. 120.).
Figure 2.
Figure 2.
(a) Normalized resistance as a function of the temperature for Nb1−xTaxSe3 with several Ta concentrations. (b) Ta concentration dependence of Tc. Substituting Ta to CDW material NbSe3, forming Nb1−xTaxSe3 to be superconductive.1) ○ K. Kawabata,2) ● Our data.1)
Figure 3.
Figure 3.
Temperature dependence of resistance in Bi2Sr2CuO6. The inset shows the crystal structure.5)
Figure 4.
Figure 4.
Layered structure of (a) Bi2Sr2CuO6 and (b) Bi2Sr2CaCu2O8.
Figure 5.
Figure 5.
Superconductivity in (Nd, Sr, Ce)2CuO4: T* structure. (a) Crystal structure of T* structure. (b) Temperature dependence of resistivity in T* structure.8,9)
Figure 6.
Figure 6.
Three types of “214” structure: (a) (La1−xSrx)2CuO4: T structure, (b) (Nd1−xCex)2CuO4: T′ structure, (c) (Nd, Sr, Ce)2CuO4: T* structure.
Figure 7.
Figure 7.
Concept of the block layer. CuO2 layers are inserted between block layers.11)
Figure 8.
Figure 8.
Phase diagram of Sr2CuO4(CO3)1−x(BO3)x. Carriers can be controlled by (BO3) content.13)
Figure 9.
Figure 9.
Three types of superconductor composed of different block layers including the carbonate layers. (a) Sr2CuO2(CO3)1−x(BO3)x (Tc = 55 K) (b) Sr2CaCu2O4(CO3)1−x(BO3)x (Tc = 105 K) (c) Sr2Ca2CuO4(CO3)1−x (BO3)x (Tc = 115 K).15)
Figure 10.
Figure 10.
Two types of Cu-O planes. (a) Two-dimensional CuO2 planes, (b) Two-leg ladder Cu2O3 planes.
Figure 11.
Figure 11.
Crystal structure of telephone number compound Sr14Cu24O41, being composed of 1D-chain layer and 2-leg ladder layer.
Figure 12.
Figure 12.
(a) Temperature dependence of electrical resistivity in Sr14−xCaxCu24O41. With increasing x (Ca content), resistivity is decreased. (b) Pressure dependence of Sr0.4Ca13.6Cu24O41.84. Superconductivity appears at 3 GPa.19)
Figure 13.
Figure 13.
Electrical resistivity and magnetic susceptibility of MgB2 as a function of the temperature.21)
Figure 14.
Figure 14.
Crystal structure of MgB2.21)
Figure 15.
Figure 15.
The band structure and the Fermi surface of MgB2.22)
Figure 16.
Figure 16.
Two fabrication methods to make a MgB2 wire. 1) In situ powder-in-tube (PIT) method. 2) Internal Mg diffusion (IMD) method.23)
Figure 17.
Figure 17.
Temperature dependence of Bc2 in MgB2 wires.23)
Figure 18.
Figure 18.
Present status of critical current density Jc (A/cm2) vs. magnetic field B (T).23)
Figure 19.
Figure 19.
Temperature dependence of resistivity and susceptibilities in Y2C3.25,27)
Figure 20.
Figure 20.
Crystal structure of Y2C3 to be the Pu2C3-type with (b.c.c.) structure.
Figure 21.
Figure 21.
Temperature dependence of the muon spin relaxation rates of La2C3 and Y2C3. Solid and dashed lines are fitted with the s-wave’s phenomenologial double-gap model.30)
Figure 22.
Figure 22.
Crystal structure of the 3C-SiC and 6H-SiC, respectively.
Figure 23.
Figure 23.
Temperature dependences of the electrical resistivities and magnetic susceptibilities.36)
Figure 24.
Figure 24.
H-T phase diagram for (a) B-doped 3C-SiC(3C-SiC:B) and (b) B-doped 6H-SiC(6H-SiC:B), determined from the onset of superconductivity during a T-scan and H-scan of resistivity.
Figure 25.
Figure 25.
Temperature dependences of the electrical resistivity and magnetic susceptibility in SiC(3C-SiC:Al), where 3C-SiC was doped with Al.36)
Figure 26.
Figure 26.
Temperature dependence of the upper critical field Hc2 and the irreversibility field Hirr in 3C-SiC:Al.36)
Figure 27.
Figure 27.
Cage-type crystal structure of R5T6Sn18 (R = Sc, Y, Lu; T = Rh, Ir).38)
Figure 28.
Figure 28.
Temperature dependence of the magnetic susceptibility in R5Rh6Sn18 (R: Sc, Y and Lu).38)
Figure 29.
Figure 29.
Quasiparticle state density (γ) vs. magnetic field.38)
Figure 30.
Figure 30.
Typical examples of superconductivities and crystal structures chosen from Table 5. (a) Cr2Re3B,61) (b) NaAlSi62) and (c) LixIrSi2.
Figure 31.
Figure 31.
(a) Crystal structure of La2CuO4 and Sr2IrO4. (b) Schematic diagram of the 5d energy levels split by the crystal field (Δ), spin–orbit coupling (SOC), and on-site Coulomb repulsion (U) leading to the formation of unoccupied (upper) and occupied (lower) Hubbard bands at around the Fermi level from the Jeff = 1/2 band and the fully occupied Jeff = 3/2 band.
Figure 32.
Figure 32.
(a)–(c) Second derivative of ARPES intensity plots as a function of the binding energy and wave vector on Sr2−xLaxIrO4 (x = 0, 0.04 and 0.08) measured along the k direction. (d) Schematic graph of the doping-induced change in the electronic structure of Sr2−xLaxIrO4 derived from our ARPES study.69)
Figure 33.
Figure 33.
Magnetic phase diagram of Sr2−xLaxIrO4 determined from magnetic susceptibility and µSR measurements.70)

Similar articles

Cited by

References

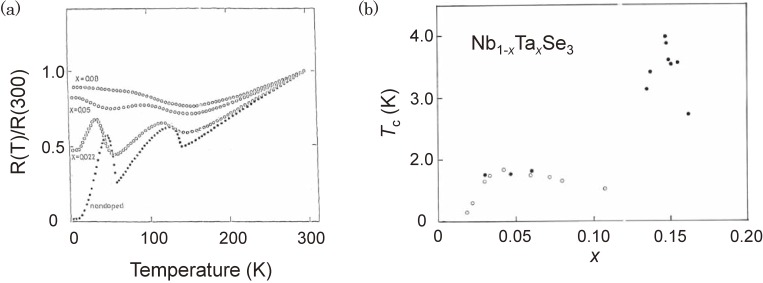
    1. Noma S., Saito T., Ekino T., Akimitsu J., Sueno S. (1993) Superconducting phase in Nb1−xTaxSe3 (0.135 < x < 0.16). Phys. Rev. B 48, 9620–9627. - PubMed
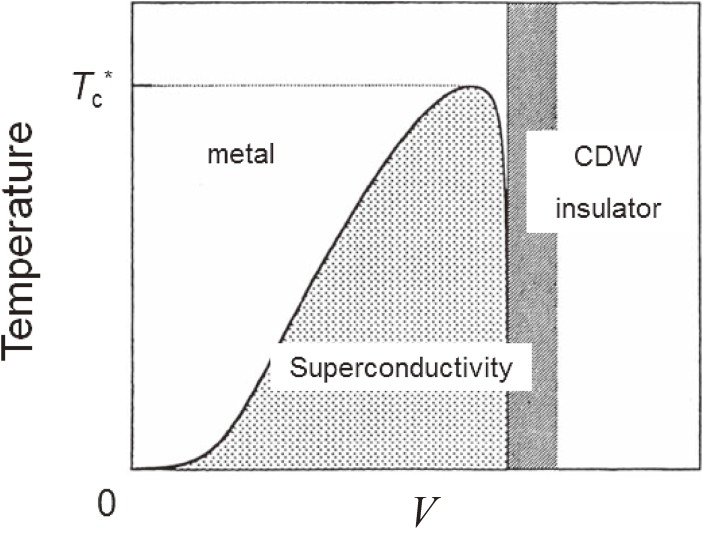
    1. Kawabata K. (1985) Impurity effects on superconductivity and charge density waves in NbSe3. J. Phys. Soc. Jpn. 54, 762–770.
    1. Bednorz J.G., Müller K.A. (1986) Possible high-Tc superconductivity in the Ba-La-Cu-O system. Z. Phys. B 64, 189–193.
    1. Wu M.K., Ashburn J.R., Torng C.J., Hor P.H., Meng R.L., Gao L., et al. (1987) Superconductivity at 93 K in a new mixed-phase Y-Ba-Cu-O compound system at ambient pressure. Phys. Rev. Lett. 58, 908–910. - PubMed
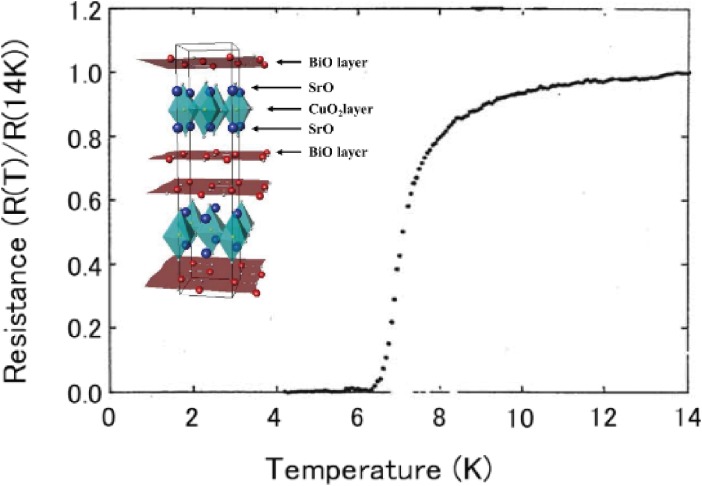
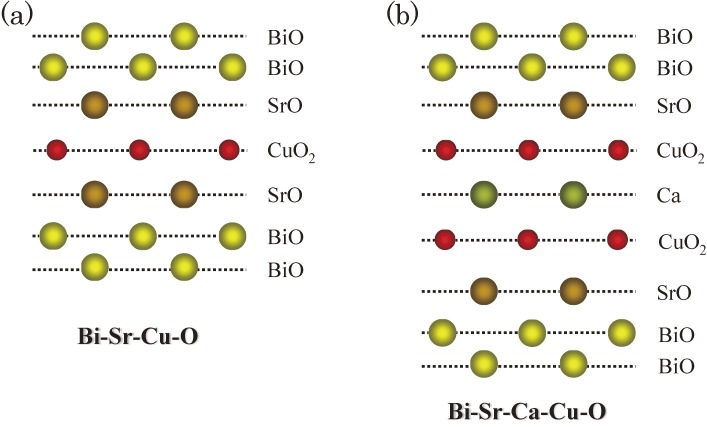
    1. Akimitsu J., Yamazaki A., Sawa H., Fujiki H. (1987) Superconductivity in the Bi-Sr-Cu-O system. Jpn. J. Appl. Phys. 26, L2080–L2081.