. 2019 Aug 12;10(1):3631.
doi: 10.1038/s41467-019-11438-9.

Band-collision gel electrophoresis

Affiliations

Band-collision gel electrophoresis

Dimitri A Bikos et al. Nat Commun. .

Abstract

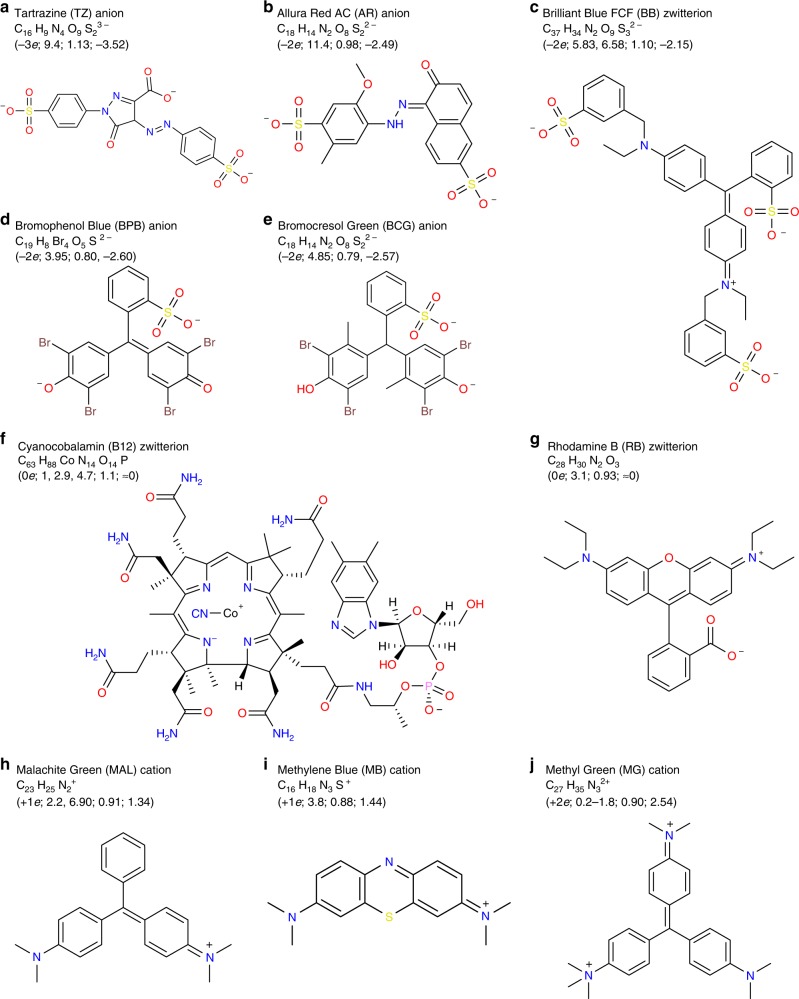
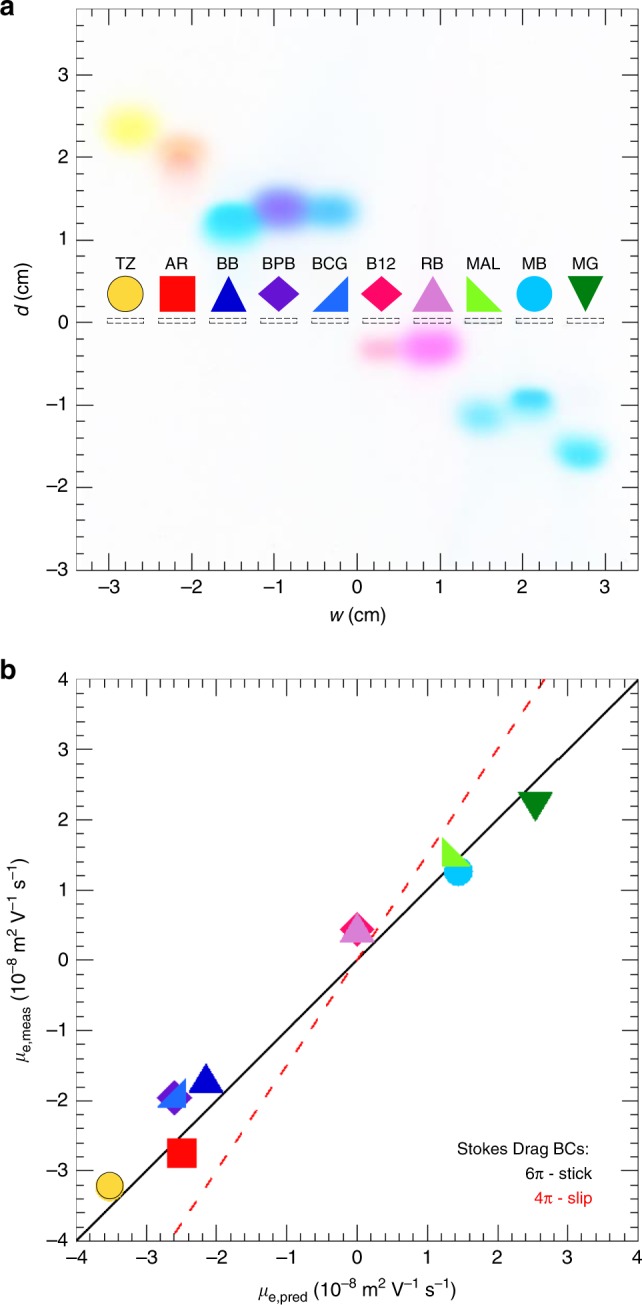
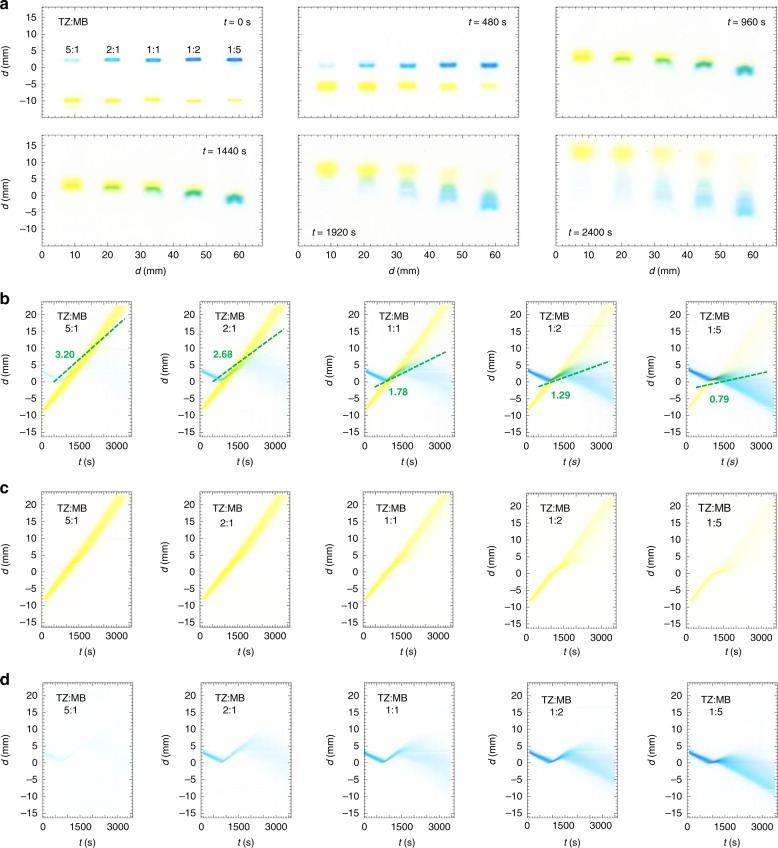
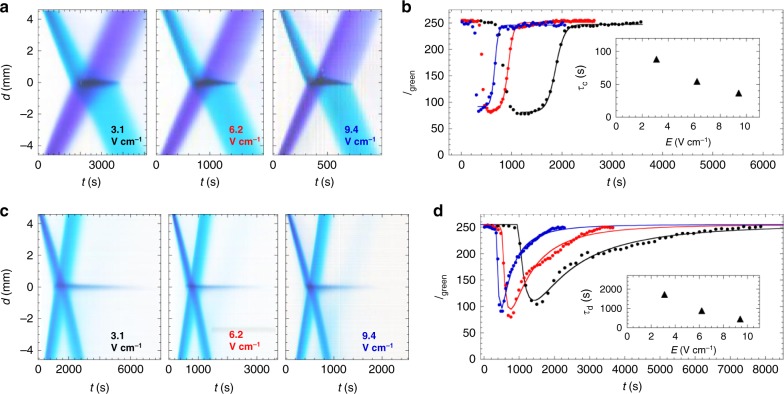
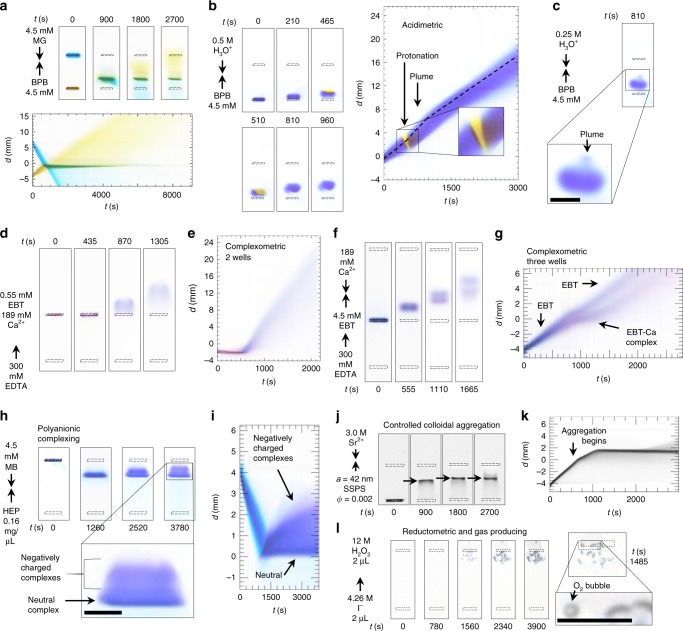
Electrophoretic mobility shift assays are widely used in gel electrophoresis to study binding interactions between different molecular species loaded into the same well. However, shift assays can access only a subset of reaction possibilities that could be otherwise seen if separate bands of reagent species might instead be collisionally reacted. Here, we adapt gel electrophoresis by fabricating two or more wells in the same lane, loading these wells with different reagent species, and applying an electric field, thereby producing collisional reactions between propagating pulse-like bands of these species, which we image optically. For certain pairs of anionic and cationic dyes, propagating bands pass through each other unperturbed; yet, for other pairs, we observe complexing and precipitation reactions, indicating strong attractive interactions. We generalize this band-collision gel electrophoresis (BCGE) approach to other reaction types, including acid-base, ligand exchange, and redox, as well as to colloidal species in passivated large-pore gels.


Conflict of interest statement

There is a pending and at present unlicensed U.S. provisional patent application assigned to and filed by UCLA relating to this work.

Figures

Fig. 1
Fig. 1
Visualizing reactions between two different optically absorbing reagent species using band-collision gel electrophoresis (BCGE). a A gel having two wells per lane is cast and transferred into a transparent horizontal gel electrophoresis chamber filled with a buffer solution at a desired pH. Pt-wires near the ends of the chamber, designated by black (−) and red ( + ), are connected to a power supply (not shown). Each well is loaded with a different reagent species, and the power supply, which generates an electric field E that lies along the x-direction, is turned on at time t = 0. A light box underneath the chamber provides uniform transmission illumination of white visible light, and time-lapse images are captured by an overhead camera with a lens selected to minimize spatial distortion. b Overhead view depicting the center locations x1(t) and x2(t) of propagating bands of reagent species 1 (blue band) and 2 (purple band), respectively, in a lane at time t; both x1 and x2 are referenced relative to the well centered at x = 0. Reagent species 1 and 2 were initially loaded into the wells centered at x = 0 and x = L, respectively. Here, the electrophoretic mobilities of reagent species 1 and 2 have μe,1 > 0 and μe,2 < 0, respectively. ce Each panel shows the evolution of bands in a single lane containing two wells during BCGE for different μe,1 and μe,2 (see the Methods section): (left) at time t = 0 when E is turned on, (middle) at some time later t < t* before band collision, and (right) full band collision at t = t*, yielding band-collision location x*. c Counter-propagating BCGE: μe,1 > 0 and μe,2 < 0, so band collision always occurs at x* between the wells. d Uni-propagating BCGE: μe,1 = 0 (as shown) or μe,2 = 0, so the band of charged reagent species collides with the stationary band of uncharged reagent species in its well. e Co-propagating BCGE: both μe,1 and μe,2 have the same sign (<0 as shown) but μe,1μe,2, so band collision occurs at x* outside the region between the wells
Fig. 2
Fig. 2
Structural diagrams and properties of organic dyes at pH = 9. a Tartrazine (TZ) anion, 465.39 g mol−1. b Allura Red (AR) anion, 450.44 g mol−1. c Brilliant Blue FCF (BB) zwitterion, 746.87 g mol−1. d Bromophenol Blue (BPB) anion, 667.95 g mol−1. e Bromocresol Green (BCG) anion, 698.02 g mol−1. f Cyanocobalamin FCF (B12) zwitterion, 1,355.39 g mol−1. g Rhodamine B (RB) zwitterion, 442.56 g mol−1. h Malachite Green (MAL) cation, 329.47 g mol−1. i Methylene Blue (MB) cation, 284.40 g mol−1. j Methyl Green (MG) cation, 387.57 g mol−1. Values in parentheses at the upper left of each panel provide predicted nearest integer charge q (e); translational hydrodynamic radius a (in nm); and measured electrophoretic mobility μe,meas (in 10−8 m2 V−1 s−1). Below this, we list reported pKa value(s) or range(s) from literature sources (see Supplementary Methods). Charges are approximate, and have been rounded to the nearest integer (see Supplementary Methods). Estimates of equivalent hydrodynamic sphere radii are made using WinHydroPro and HyperChem (see the Methods section). Corresponding minimized molecular models from HyperChem are shown in Supplementary Fig. 1
Fig. 3
Fig. 3
Measured and predicted electrophoretic mobilities of organic dyes. Conditions: 3.0% (w/w) agarose gels; 5.0 mM SBB at pH 9.0; applied electric field E = 3.1 V cm−1. a Image of bands of dye molecules after a propagation time t = 2,400 s from wells (dashed rectangles at d = 0). Propagation distance along the applied field is d and the x-direction points downward; transverse distance is designated by w. Dyes are identified by abbreviations (see Fig. 2) and assigned symbols. b μe,meas versus predicted μe,pred using the Smoluchowski equation with stick boundary conditions for Stokes drag and effective hydrodynamic radii from molecular modeling (points). Black solid line: μe,meas = μe,pred (stick) has ideal slope = 1. Source data are provided as a Source Data file
Fig. 4
Fig. 4
Optical visualization of complexing and decomplexing reactions between counter-propagating bands of organic dyes using BCGE. Conditions: 3.0% (w/w) agarose gel concentration, 5.0 mM sodium borate buffer at pH 9.0; electric field strength E = 3.1 V cm−1. Each well is loaded with 4 µL of a dye solution at 4.5 mM and measures 4 -mm wide. Shown for dyes B12 and AR: a background-subtracted overhead images at different times t after turning on E; b space–time plot of the center strip of pixels in the lane from part a, where the spatial position d along the lane is set to zero at the collision point; and c average RGB image intensity profile (corresponding to red dashed line in part b); lines guide the eye. The results for dyes MB and TZ are similarly shown in d, e, f; dyes MG and BPB in g, h, i; and dyes MB and BB in j, k, l. Arrows indicate complex formation. The x-direction points downward in spatial plots. Colors in parts c, f, i, and l are approximate guides only. Figure 2 defines dye abbreviations. Horizontal axes for b, e, h are the same as in k; horizontal axes for c, f, i are the same as in l. Source data are provided as a Source Data file
Fig. 5
Fig. 5
Concentration dependence of band collisions between complexing dyes that have different charge magnitudes using BCGE. Conditions: same as in Fig. 3. Separation between the two wells: L = 12 mm. Shown for dyes TZ(−3e, lower yellow bands) and MB( +e, upper blue bands): a background-subtracted overhead images at times t = 0, 480, 960, 1440, 1920, and 2400 s after turning on E. Upper left: lanes are marked according to concentration ratio TZ:MB at a fixed total concentration of 9.0 mM. b Space–time plots showing band trajectories of both TZ and MB. Offset green dashed lines: average trajectories of complexes containing MB immediately after collision; electrophoretic mobilities of these complexes μe,meas (green numbers) in units of 10−8 m2 V−1 s−1. Separation of color channels yields an optical absorption space–time plot of: c only TZ; and d only MB. The x-direction points downward in all plots
Fig. 6
Fig. 6
Dependence of complexing and decomplexing kinetics on the applied electric field strength using BCGE. Conditions: same as in Fig. 3, except E. a Background-subtracted space–time plots of band collisions between MG( + 2e) and BPB(−2e) at field strengths E (V cm−1) of 3.1 (black text, left); 6.2 (red text, middle); and 9.4 (blue text, right). The range of times shown for 6.2 and 9.4 V cm−1 have been reduced by factors of 2× and 3×, respectively, yielding similar X-patterns to that shown for 3.1 V cm−1. b Intensity profiles showing decomplexing kinetics, extracted from part a using the green color channel intensity Igreen taken across d = 0 mm, where the stationary product band appears, as a function of time t for different E (points color coded as in part a); lines are fits of long-time data using Fermi-like functions (see Supplementary Table 2). Inset: time constant τc(E) obtained from the fit decreases as a function of E. c, d Same as parts a and b, but instead for dyes MB(+e) and BB(−2e). In part d, Igreen(t) are fit using a modified log-normal function describing the optical absorption of the stationary band at d = 0 (lines, see Supplementary Table 3). The x-direction points downward in parts a and c. Inset: τd from the fits decreases for larger E. Source data are provided as a Source Data file
Fig. 7
Fig. 7
A wide variety of chemical reaction types are accessible using BCGE. a Protonated BPB(−e) collides with MG( +2e) in 5.0 mM CAA buffer at pH = 2.87 and E = 3.1 V cm−1. b, c Acidimetric band collisions between counter-propagating acid indicator dye BPB(−2e) and hydronium H3O+. b Overhead lane images and space–time plot revealing protonation of the leading edge of the band of BPB (yellow region) and subsequent ejection of a deprotonated BPB plume (purple region); c overhead lane image indicating less protonation of BPB, but more prominent plume ejection; d, e Two-well and f, g three-well complexometric ligand-exchange reactions between EBT, Ca2+, and EDTA (see the text). d Overhead lane images of a two-well complexometric reaction. Neutral EBT-Ca complex formed from EBT and Ca2+ remains in its well; Ca2+ is exchanged during EDTA collision, liberating EBT; e space–time plot of two-well ligand-exchange reaction. f Overhead lane images of three-well complexometric reaction where first Ca2+ collides with EBT forming the neutral complex before EDTA catches up and liberates the EBT; g space–time plot of three-well complexometric reaction. h Overhead lane images of HEP-MB collision resulting in both neutral complexes and partially negatively charged complexes, revealing spectral differences between these; i space–time plot of HEP/MB complexing reaction. j Overhead lane images of a controlled colloidal aggregation collision between Sr2+ cations and sulfate-stabilized polystyrene nanospheres (aggregates indicated by arrow); k space–time plot of the resulting colloidal aggregation reaction. l Redox reaction producing O2 gas bubbles after a band of propagating I anions collides with a band of stationary neutral H2O2 molecules. Scale: wells are indicated by dashed-line rectangles of 4.0 × 0.5 mm. Black scale bars in magnified insets: 2 mm. Unless otherwise stated, 4 μL of sample is added to every well. Conditions: same as in Fig. 3 unless otherwise noted. In all plots, the x-direction points downward

References

    1. Casse F, Boucher C, Julliot JS, Michel M, Denarie J. Identification and characterization of large plasmids in Rhizobium meliloti using agarose gel electrophoresis. J. Gen. Microbiol. 1979;113:229–242. doi: 10.1099/00221287-113-2-229. - DOI
    1. Chrambach A, Rodbard D. Polyacrylamide gel electrophoresis. Science. 1971;172:440–451. doi: 10.1126/science.172.3982.440. - DOI - PubMed
    1. Lehrach H, Diamond D, Wozney JM, Boedtker H. RNA molecular weight determinations by gel electrophoresis under denaturing conditions, a critical reexamination. Biochemistry. 1977;16:4743–4751. doi: 10.1021/bi00640a033. - DOI - PubMed
    1. Lesnaw JA, Reichmann ME. Determination of molecular weights of plant viral protein subunits by polyacrylamide gel electrophoresis. Virology. 1970;42:724–731. doi: 10.1016/0042-6822(70)90318-1. - DOI - PubMed
    1. Noble RP, et al. Comparison of lipoprotein analysis by agarose gel and paper electrophoresis with analytical ultracentrifugation. Lipids. 1969;4:55–59. doi: 10.1007/BF02531795. - DOI - PubMed

Publication types