. 2019 Aug 12;9(1):11609.
doi: 10.1038/s41598-019-47201-9.

Recent pace of change in human impact on the world's ocean

Affiliations

Recent pace of change in human impact on the world's ocean

Benjamin S Halpern et al. Sci Rep. .

Abstract

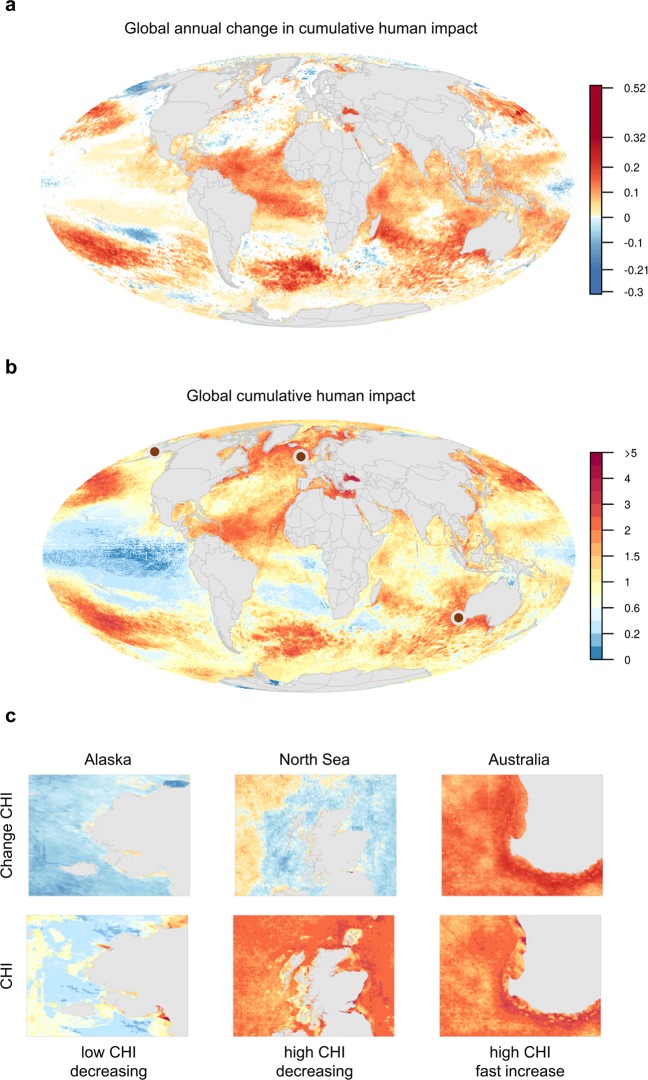
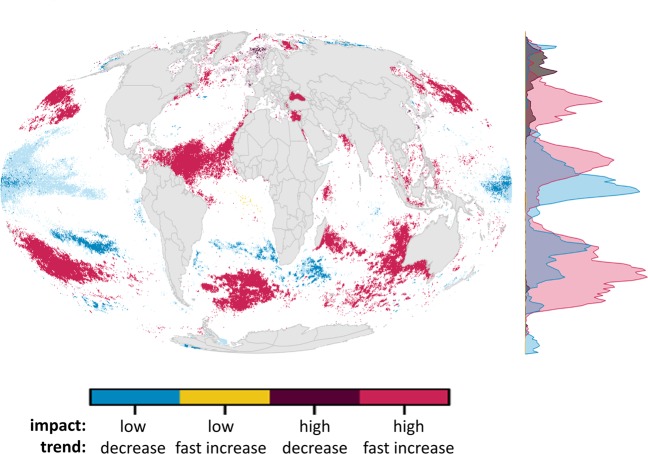
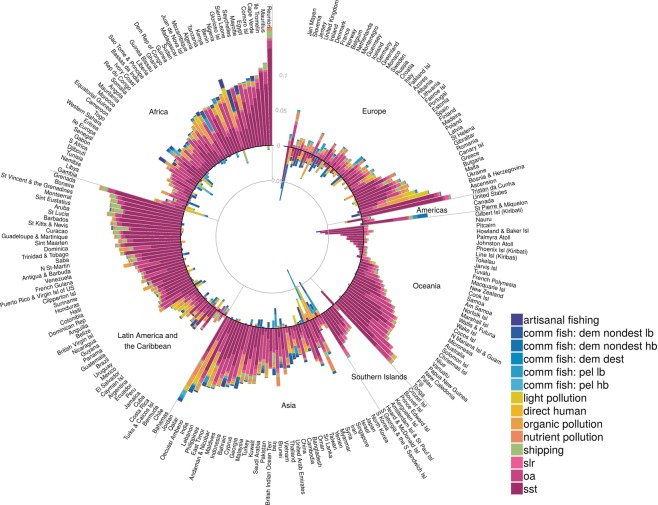
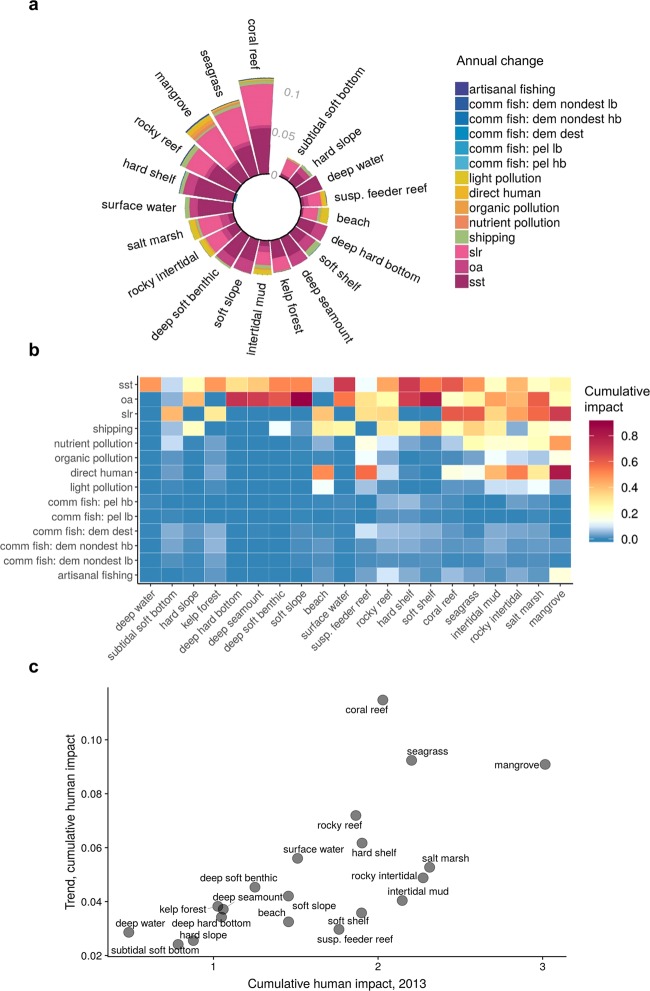
Humans interact with the oceans in diverse and profound ways. The scope, magnitude, footprint and ultimate cumulative impacts of human activities can threaten ocean ecosystems and have changed over time, resulting in new challenges and threats to marine ecosystems. A fundamental gap in understanding how humanity is affecting the oceans is our limited knowledge about the pace of change in cumulative impact on ocean ecosystems from expanding human activities - and the patterns, locations and drivers of most significant change. To help address this, we combined high resolution, annual data on the intensity of 14 human stressors and their impact on 21 marine ecosystems over 11 years (2003-2013) to assess pace of change in cumulative impacts on global oceans, where and how much that pace differs across the ocean, and which stressors and their impacts contribute most to those changes. We found that most of the ocean (59%) is experiencing significantly increasing cumulative impact, in particular due to climate change but also from fishing, land-based pollution and shipping. Nearly all countries saw increases in cumulative impacts in their coastal waters, as did all ecosystems, with coral reefs, seagrasses and mangroves at most risk. Mitigation of stressors most contributing to increases in overall cumulative impacts is urgently needed to sustain healthy oceans.


Conflict of interest statement

The authors declare no competing interests.

Figures

Figure 1
Figure 1
Global patterns of cumulative human impacts. (a) Annual change in CHI estimated using a linear regression model from 2003 to 2013 for each raster cell (white cells did not have a statistically significant trend, i.e., p > 0.05), Scale values reflect min and max raster values (−0.3 and 0.52) and 99.999th quantile values (−0.21 and 0.32). (b) Static map of 2013 CHI. (C) Coastal areas displayed for both pace of change and 2013 CHI for regions (indicated by dots on global CHI map) with dominant patterns of: high CHI, fast increasing pace of change (Southwestern Australia); high CHI, decreasing (North Sea); and low CHI, decreasing (Yukon Delta region of Alaska). There were no clear examples of low CHI, fast increasing.
Figure 2
Figure 2
Overlap of extreme impact (high, low) and trend (fast increase, decrease) in cumulative impacts. Regions of low (<20th quantile) and high (>80th quantile) cumulative impact in 2013 were combined with regions where annual cumulative impacts were decreasing (trend ≤0, lighter colors represent non-significant trends) or quickly increasing (trend >80th global quantile, corresponding to a slope estimate of 0.085, all significant trends). Trend estimates were calculated using a linear regression model from 2003–2013 cumulative human impacts. Density plot on right shows the distribution of values across latitude.
Figure 3
Figure 3
Annual pace of change in CHI per year in all 14 impacts comprising the cumulative impacts within coastal (0–3 nm) regions of each country’s EEZ. Outer bars greater than zero indicate increasing impacts and inner bars below zero indicate decreasing impacts. Countries are grouped by UN georegions.
Figure 4
Figure 4
Cumulative human impacts on marine ecosystems. (a) Annual change in all 14 impacts comprising the cumulative impacts for each ecosystem, with outer bars above zero indicating increasing impacts and inner bars below zero indicate decreasing impacts, (b) cumulative impacts on ecosystems for the current year (2013), and (c) relationship between annual trend and current cumulative impacts for each ecosystem.

References

    1. Halpern BS, et al. A global map of human impact on marine ecosystems. Science. 2008;319:948–952. doi: 10.1126/science.1149345. - DOI - PubMed
    1. Halpern BS, et al. Spatial and temporal changes in cumulative human impacts on the world’s ocean. Nature Communications. 2015;6:7615. doi: 10.1038/ncomms8615. - DOI - PMC - PubMed
    1. Scheffer M, Carpenter S, Foley JA, Folke C, Walker B. Catastrophic shifts in ecosystems. Nature. 2001;413:591–596. doi: 10.1038/35098000. - DOI - PubMed
    1. Rocha J, Yletyinen J, Biggs R, Blenckner T, Peterson G. Marine regime shifts: drivers and impacts on ecosystems services. Phil. Trans. R. Soc. B. 2015;370:20130273. doi: 10.1098/rstb.2013.0273. - DOI
    1. Jackson JBC, et al. Historical overfishing and the recent collapse of coastal ecosystems. Science. 2001;293:629–638. doi: 10.1126/science.1059199. - DOI - PubMed

Publication types