. 2019 Aug 12;9(1):11622.
doi: 10.1038/s41598-019-48063-x.

Temporal attention causes systematic biases in visual confidence

Affiliations

Temporal attention causes systematic biases in visual confidence

Samuel Recht et al. Sci Rep. .

Abstract

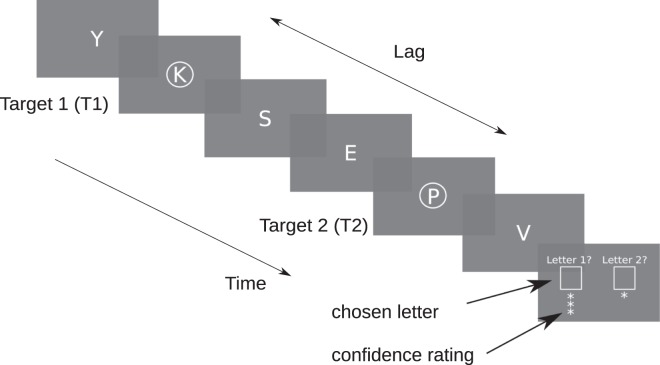
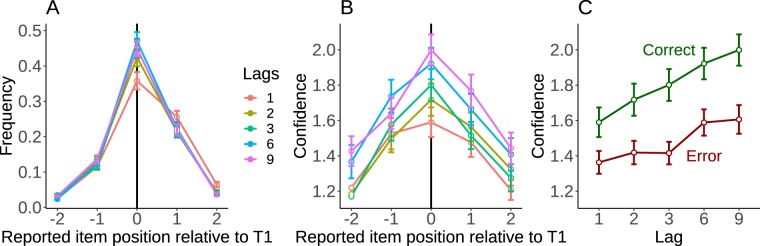
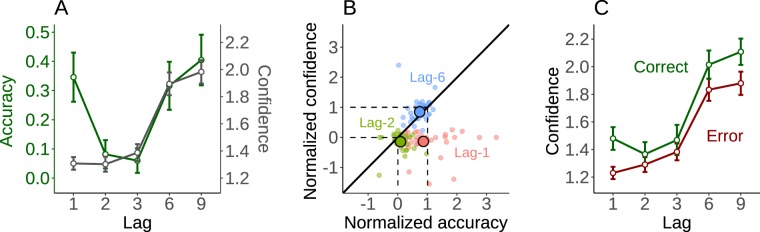
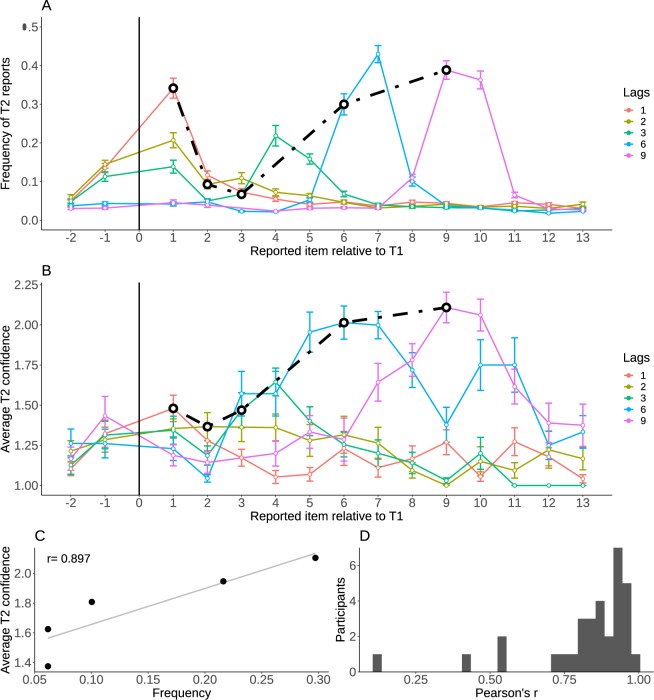
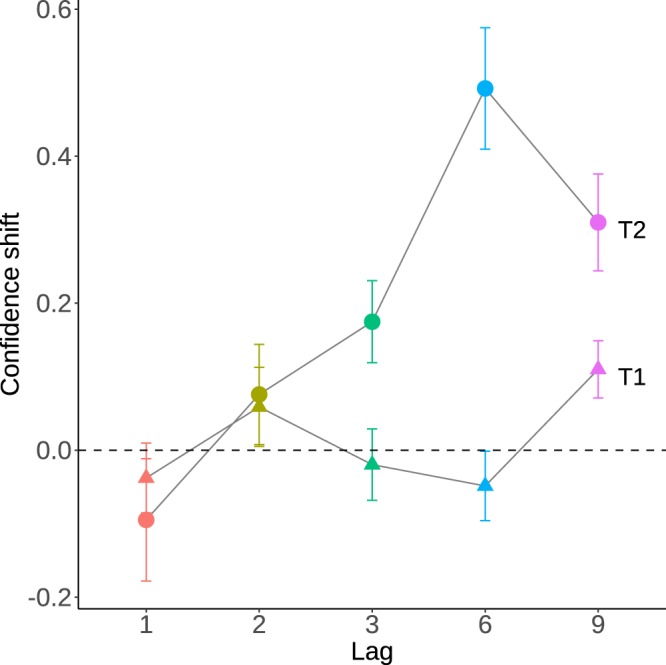
Temporal attention enhances the perceptual representation of a stimulus at a particular point in time. The number of possible attentional episodes in a given period is limited, but whether observers' confidence reflects such limitations is still unclear. To investigate this issue, we adapted an "Attentional Blink" paradigm, presenting observers with a rapid visual stream of letters containing two targets cued for subsequent perceptual reports and confidence judgments. We found three main results. First, when two targets fell within the same attentional episode, the second target underwent a strong under-confidence bias. In other words, confidence neglected that a single attentional episode can benefit to both targets. Second, despite this initial bias, confidence was strongly correlated with response probability. Third, as confidence was yoked to the evidence used in perceptual reports, it remains blind to delays in response selection for the second target. Notably, the second target was often mistaken with a later item associated with higher confidence. These results suggest that confidence does not perfectly evaluate the limits of temporal attention in challenging situations.


Conflict of interest statement

The authors declare no competing interests.

Figures

Figure 1
Figure 1
Experiment design. Participants were required to report the two cued letters in the RSVP, and rate their confidence for each reported letter (Experiment 1) or for only one of the letter (Experiment 2, see Supplementary Material) on a three-point scale. The distance in items (or lag) between the first target (T1) and second target (T2) was varied across trials (lag-3 depicted here). Each letter appeared for 33 ms, followed by a 50 ms ISI.
Figure 2
Figure 2
Reports and confidence for the first target. (A) The frequency of reports for item around target true position, separately for each lag. (B) The average confidence per position, for each lag. (C) The average confidence level for correct responses and errors, which provides an estimate of metacognition. Error bars represent standard error of the mean across participants.
Figure 3
Figure 3
Attentional Blink and early confidence bias. (A) T2 average accuracy (in green) and confidence (in grey) as a function of the lag between T1 and T2. (B) The systematic under-confidence occurring at lag-1 (83 ms after the first target) is illustrated by representing accuracy and confidence for lag-1 (in red) in the space from lag-3 to lag-9. The dashed lines represent (0, 0) coordinates corresponding to lag-3 and (1, 1) coordinates corresponding to lag-9 in this space. As a comparison, lag-2 (in green) and lag-6 (in blue) are pictured as well. Each colored point is a participant in the considered condition. The means for each condition are black-circled. Points below the diagonal represent under-confidence. (C) The average confidence level for correct T2 reports and errors, for each lag. Metacognitive sensitivity is conserved at lag-1 despite a bias for low confidence ratings. Error bars represent standard error of the mean across participants.
Figure 4
Figure 4
Reports and confidence for the second target. (A) The frequency of T2 reports as a function of the position of the reported item relative to T1, for each lag. Note that T1 position has no value, given that only trials in which T1 is correctly reported were considered here (hence T2 reports cannot correspond to T1 position). The black line connects the points corresponding to accurate T2 reports. (B) Confidence of the T2 reports, as a function of the position of the reported item relative to T1, for each lag. The black line connects the points corresponding to accurate T2 reports. Error bars represent standard error of the mean across participants. (C) Regression between frequency and confidence with 5 positions centered on T2, collapsed across lags, for a representative participant. (D) Histogram of the correlation coefficients for all the participants. The confidence-frequency relation is strong and holds for most participants.
Figure 5
Figure 5
Confidence for T2 is delayed. Confidence shift is the average confidence in post-target minus pre-target errors, evaluated separately for each lag and for T1 (triangles) and T2 (dots). A positive value corresponds to greater confidence for post-target errors, that is, a shift of the confidence peak towards more delayed items. T2 confidence is delayed for lags 3, 6 and 9, reproducing the delay generally observed in items selection after the Attentional Blink period (see Fig. 4A and Supplementary Material). Error bars represent standard error of the mean across participants.

Similar articles

Cited by

References

    1. Mamassian P. Visual Confidence. Annu. Rev. Vis. Sci. 2016;2:459–481. doi: 10.1146/annurev-vision-111815-114630. - DOI - PubMed
    1. Guggenmos, M., Wilbertz, G., Hebart, M. N. & Sterzer, P. Mesolimbic confidence signals guide perceptual learning in the absence of external feedback. Elife, 10.7554/eLife.13388 (2016). - PMC - PubMed
    1. Hainguerlot, M., Vergnaud, J. C. & De Gardelle, V. Metacognitive ability predicts learning cue-stimulus associations in the absence of external feedback. Sci. Rep., 10.1038/s41598-018-23936-9 (2018). - PMC - PubMed
    1. Desender Kobe, Boldt Annika, Yeung Nick. Subjective Confidence Predicts Information Seeking in Decision Making. Psychological Science. 2018;29(5):761–778. doi: 10.1177/0956797617744771. - DOI - PubMed
    1. Graziano M, Sigman M. The Spatial and Temporal Construction of Confidence in the Visual Scene. PLoS One. 2009;4:e4909. doi: 10.1371/journal.pone.0004909. - DOI - PMC - PubMed

Publication types