. 2019 Sep;20(9):1174-1185.
doi: 10.1038/s41590-019-0449-3. Epub 2019 Aug 12.

An Nfil3-Zeb2-Id2 pathway imposes Irf8 enhancer switching during cDC1 development

Affiliations

An Nfil3-Zeb2-Id2 pathway imposes Irf8 enhancer switching during cDC1 development

Prachi Bagadia et al. Nat Immunol. 2019 Sep.

Abstract

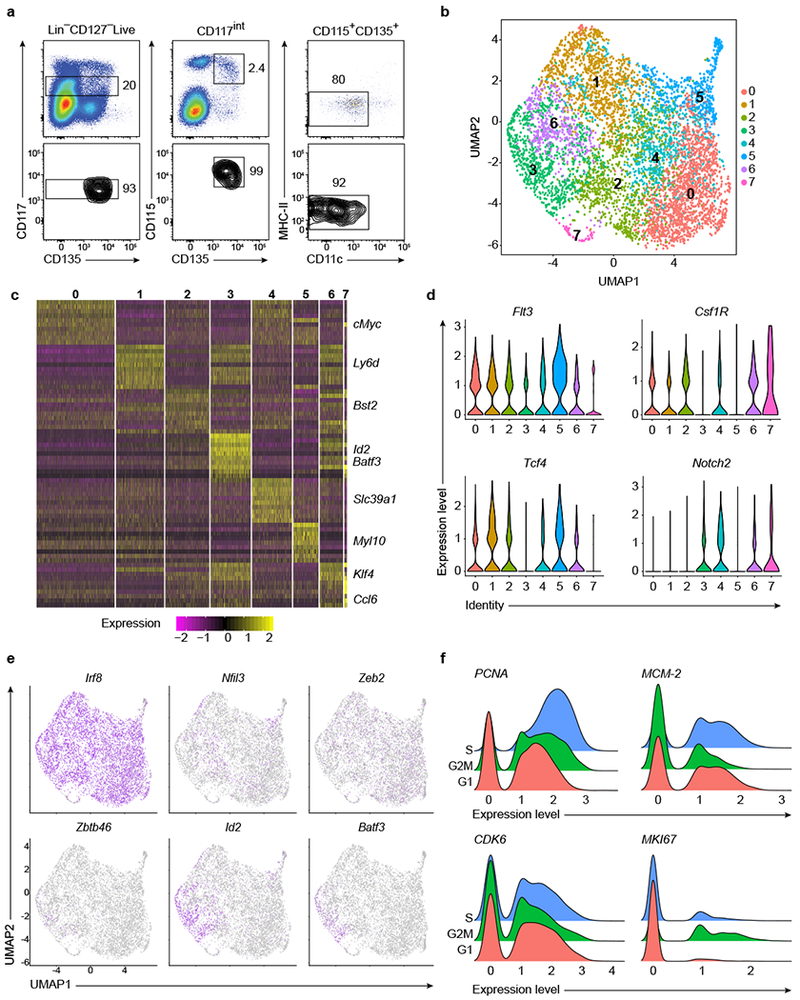
Classical type 1 dendritic cells (cDC1s) are required for antiviral and antitumor immunity, which necessitates an understanding of their development. Development of the cDC1 progenitor requires an E-protein-dependent enhancer located 41 kilobases downstream of the transcription start site of the transcription factor Irf8 (+41-kb Irf8 enhancer), but its maturation instead requires the Batf3-dependent +32-kb Irf8 enhancer. To understand this switch, we performed single-cell RNA sequencing of the common dendritic cell progenitor (CDP) and identified a cluster of cells that expressed transcription factors that influence cDC1 development, such as Nfil3, Id2 and Zeb2. Genetic epistasis among these factors revealed that Nfil3 expression is required for the transition from Zeb2hi and Id2lo CDPs to Zeb2lo and Id2hi CDPs, which represent the earliest committed cDC1 progenitors. This genetic circuit blocks E-protein activity to exclude plasmacytoid dendritic cell potential and explains the switch in Irf8 enhancer usage during cDC1 development.


Conflict of interest statement

COMPETING INTERESTS

The authors declare no competing interests.

Figures

Fig. 1:
Fig. 1:. Zbtb46-GFP Expression in CDPs Identifies the Earliest Committed cDC1 Progenitor.
a, BM from Zbtb46gfp/+ mice was analyzed by flow cytometry to identify pre-cDC1 as defined by Zbtb46-GFP or by CD24 expression. Lineage (Lin) included CD3, CD19, NK1.1, Ly-6G, TER-119, CD105, CD127 and Siglec-H. Numbers are the percent of cells in the indicated gates (representative of three independent experiments, n = 3 mice).b, BM from Zbtb46gfp/+ mice was analyzed by flow cytometry to identify the percentage of Zbtb46-GFP expression within the CDP. Lineage was defined as in (a) (representative of three independent experiments, n = 3 mice).c, Zbtb46-GFPpos CDPs, Zbtb46-GFPneg CDPs, pre-cDC1 and pre-cDC2 were sort purified from Zbtb46gfp/+ mice, cultured for 5 d in Flt3L, and analyzed by flow cytometry for development of pDCs and cDC1 (representative of three independent experiments, n = 4 for Zbtb46-GFPpos, Zbtb46-GFPneg CDPs, pre-cDC1 and n = 3 for pre-cDC2) d-e, Zbtb46-GFPpos CDPs, Zbtb46-GFPneg CDPs, pre-cDC1 and pre-cDC2 were purified as in (c) and analyzed using gene expression microarrays. Shown is expression of transcription factors with at least 4-fold differences between Zbtb46-GFPneg CDP and pre-cDC1s (d) or hierarchical clustering for genes with a least 8-fold differences between Zbtb46-GFPneg CDP and pre- cDC1s (e) (results averaged from biological triplicates for Zbtb46-GFPpos CDPs, Zbtb46-GFPneg CDPs, and pre-cDC1 or biological replicate for pre-cDC2).
Fig. 2:
Fig. 2:. Single-cell RNA Transcriptome Analysis of CDPs.
a, CDPs gated as Live,[CD105, CD3, CD19, Ly6G, Ter119]CD127CD117intCD115+CD135+MHC-IICD11c cells were purified by sorting from C57BL/6J mice. Shown are pre-sort (top) and post-sort (bottom) for cells collected for single-cell RNA-sequencing. b, UMAP clustering of CDPs from Seurat analysis (data represents combined analysis of two independent sequencing runs)c, Heatmap of 9,954 cells for the top ten genes of each cluster from Seurat analysis. Shown are names of representative genes within each cluster.d, Violin plots depicting cluster identity and expression level for the indicated genes expressed in each cluster as described in (b).e, UMAP plots for the indicated genes as described in (b).f, Joy plots depicting expression level and cell cycle stage for genes involved in the cell cycle.
Fig. 3:
Fig. 3:. Zeb2 and Id2 Heterogeneity Identifies cDC1 Specification in CDPs.
BM from Zeb2egfp/egfp (a) and Id2gfp (b) mice were analyzed by flow cytometry to identify GFP expression in CDPs and pre-cDC1s. WT mice (Zeb2+/+ and Id2+/+) are shown as gray histograms. Numbers indicate the percentage of cells in the indicated gates. (representative of three independent experiments, n = 3 mice).c-d, ZEB2-EGFPlo and ZEB2-EGFPhi CDPs (c), and Id2-GFPhi and Id2-GFPlo CDPs (d) were purified by sorting, cultured for 5 d in Flt3L, and analyzed by flow cytometry for development of cDC1 (red) and cDC2 (blue) (representative of three independent experiments, n = 5 for ZEB2-EGFPlo and ZEB2-EGFPhi CDPs and n = 4 for Id2-GFPhi and Id2-GFPlo CDPs). e, The indicated cells purified as described in (c) and (d) or in Fig. 1c were cultured as in (c) and analyzed by flow cytometry for cDC1 development shown as a percentage of total cDCs (CD45RCD317MHC-II+CD11c+) (pooled from three independent experiments, n = 5 for ZEB2-EGFPlo and ZEB2-EGFPhi CDPs, n = 4 for Id2-GFPhi or Id2-GFPlo CDPs and Zbtb46-GFPpos or Zbtb46-GFPneg CDPs). Small horizontal lines indicate the mean. f, Hierarchical clustering of genes expressed at least 5-fold differently between pre-cDC1 and ZEB2-EGFPhi CDPs (results averaged from three independent experiments). g, Expression of the indicated genes described in (f). h, Hierarchical clustering of genes expressed at least 5-fold differently between pre-cDC1 and Id2-GFPlo CDPs (results averaged from two independent experiments). i, Expression of the indicated genes described in (h). Data are presented as mean and two-tailed unpaired Student’s t test was used to compare groups. *p < 0.05, **p < 0.01, ****p < 0.0001.
Fig. 4:
Fig. 4:. Nfil3 is Required for cDC1 Specification.
a, BM from Nfil3+/+Zbtb46gfp/+ and Nfil3−/−Zbtb46gfp/+ mice was analyzed by flow cytometry for LinCD135+CD117int Zbtb46-GFPpos cells (left) or Zbtb46-GFPpos CDPs (right). Numbers indicate the percent of cells in the indicated gates (representative of five independent experiments, n = 5 mice). b, Cells from (a) are shown as a percentage of LinCD135+ (left) or CDPs (right). Small horizontal lines indicate the mean.c, BM from Nfil3+/+Zeb2egfp/+ and Nfil3−/−Zeb2egfp/+ mice was analyzed for LinCD135+CD117int ZEB2-EGFPlo cells (left) or ZEB2-EGFPlo CDPs (right) (representative of three independent experiments, n = 6 mice). d, Cells from (c) are shown as a percentage of Lin CD135+ (left) or CDPs (right). Small horizontal lines indicate the mean.e, BM from Nfil3+/+Id2gfp/+ and Nfil3−/−Id2gfp/+ mice was analyzed for LinCD135+CD117intId2-GFPhi cells (left) or Id2-GFPhi CDPs (right) (representative of three independent experiments, n = 3 for Nfil3+/+Id2gfp/+ mice and n = 4 for Nfil3−/−Id2gfp/+ mice). f, Cells from (e) are shown as a percentage of Lin CD135+ (left) or CDPs (right). Small horizontal lines indicate the mean .Data in b, d, and f are presented as mean and two-tailed unpaired Student’s t test was used to compare groups. ***p < 0.001; ****p < 0.0001.
Fig. 5:
Fig. 5:. Zeb2 is Downstream of Nfil3 in cDC1 Development.
a, Splenic cDCs from Nfil3+/+Zeb2f/f Mx1-cre (WT), Zeb2f/f Mx1-cre+ (Zeb2−/−), Nfil3−/− (Nfil3−/−), and Nfil3−/− Zeb2f/f Mx1-cre+ (Nfil3−/− Zeb2−/−) mice, gated as in Fig. 3e, were analyzed for cDC1 (red) and cDC2 (blue) frequency. Numbers are the percent of cells in the indicated gates (data representative of three independent experiments, n = 7 for WT and Zeb2−/− mice, n = 8 for Nfil3−/− mice and n = 9 for Nfil3−/− Zeb2−/− mice).b, Analysis from (a) are presented as individual mice. Small horizontal lines indicate the mean. c, cDCs derived in vitro from Flt3L-treated BM cultures from mice in (a) were analyzed for cDC1 (red) and cDC2 (blue) frequency as in (a) (data representative of three independent experiments, n = 7 for WT and Zeb2−/− mice, n = 8 for Nfil3−/− mice, and n = 9 for Nfil3−/− Zeb2−/− mice). d, Analysis from (c) are presented for individual mice. Small horizontal lines indicate the mean. e, BM from mice in (a) was analyzed for the frequency of pre-cDC1 (red). BM cells are pre-gated as Lin SiglecHCD135+ (data representative of three independent experiments, n = 7 for WT and Zeb2−/− mice, n = 8 for Nfil3−/−mice, and n = 9 for Nfil3−/− Zeb2−/− mice). f, Analysis from (e) are presented for individual mice. Small horizontal lines indicate the mean. Mean and two-tailed unpaired Student’s t test was used to compare groups. *p < 0.05; ****p < 0.0001; ns, not significant.
Fig. 6:
Fig. 6:. Expression of Id2 and Zeb2 is Mutually Repressive in the CDP.
a, Splenic cDCs harvested from WT, Zeb2f/f Rosa26(cre-ERT2/+) (Zeb2−/−), Id2f/f Rosa26(cre-ERT2/+) (Id2−/−), and Id2f/f Zeb2f/f Rosa26 (cre-ERT2/cre-ERT2) (Zeb2−/− Id2−/− ) were analyzed for cDC1 (red) and cDC2 (blue) frequency, gated as in Fig. 3e. Numbers are the percent of cells in the indicated gates (data representative of two independent experiments, n = 2 for Id2−/− mice, n = 3 for Zeb2−/− Id2−/− mice, n = 4 for Zeb2−/− mice, and n = 5 for WT mice). b, Data from (a) are presented for individual mice. Small horizontal lines indicate the mean.c, BM from mice in (a) was analyzed for the frequency of pre-cDC1 (red). BM cells are pre-gated as Lin SiglecHCD135+ (data representative of two independent experiments, n = 2 for Id2−/− mice, n = 3 for Zeb2−/− Id2−/− mice, n = 4 for Zeb2−/− mice, and n = 5 for WT mice).d, Data from (c) are presented for individual mice. Small horizontal lines indicate the mean.e, Shown is the expression of Irf8, Nfil3, and Id2 in splenic cDC1 sorted from WT, Zeb2−/−, Zeb2−/− Id2−/− , and Zeb2−/− Nfil3−/− mice (n = 3 for WT and Zeb2−/− mice, n = 2 for Zeb2−/− Id2−/− and Zeb2−/− Nfil3−/− mice). Small horizontal lines indicate the mean.f, BM from Zbtb46gfp/+(WT), Id2−/−Zbtb46gfp/gfp (Id2−/−), and Batf3−/−Zbtb46gfp/gfp (Batf3−/−) mice was gated as Lin cells, and the CD117intZbtb46-GFP−- (red) or CD117intZbtb46-GFP+ (blue) cells were separately analyzed for CD115 and CD135 expression (data representative of five independent experiments, n = 5 mice) g, CDPs and Zbtb46-GFPpos cells in (f) were sort purified and analyzed by gene expression microarray. Shown are gene expression levels for Zeb2, Nfil3, and Batf3 (data representative of three independent experiments, n = 2 for CDPs and n = 3 for Zbtb46-GFPpos cells). Small horizontal lines indicate the mean. Data are shown as mean and two-tailed unpaired Student’s t test was used to compare groups. *p < 0.05, ***p < 0.001, ns, not significant.
Fig. 7:
Fig. 7:. Id2 imposes a switch from the +41 kb Irf8 enhancer to the +32 kb Irf8 enhancer by Reducing E protein activity,
a, Conservation of E-box motifs between human (red) and mouse (blue) loci within the +41 kb Irf8 enhancer.b, GFP expression from RV reporters with (IRF8 +41) or without (empty) the 454 bp +41 kb enhancer, or with intact segment A (A), intact segment B (B), intact segment C (C), or intact segments A and B (A+B), or intact segments B and C (B+C), in pDCs, cDC1s, and cDC2s, shown as histograms (data pooled from >5 independent experiments, n > 5).c, Data shown in (b) shown as integrated MFI (data pooled from >5 independent experiments, n > 5). Small horizontal lines indicate the mean.d, GFP expression in pDCs of RV reporters without (empty) or with the 454 bp +41 kb enhancer (IRF8 +41), or with intact segment A (A), or with mutations in E-box 1 (A-m1), E-box 2 (A-m2) or both (A-m1/m2), shown as integrated MFI (data pooled from >5 independent experiments, n > 5). Small horizontal lines indicate the mean.e, GFP expression in pDCs of RV reporters without (empty) or with the 454 bp +41 kb enhancer (IRF8 +41), or with intact segment B (B), or with mutations in E-box 3 (B-m3), E-box 4 (B-m4) or both (B-m3/m4), shown as integrated MFI (data pooled from >5 independent experiments , n > 5). Small horizontal lines indicate the mean.f, GFP expression in WEHI-231 cells of RV reporters with (IRF8 +41) or without (empty) the 454 bp +41 kb enhancer, or with intact segment A (A), intact segment B (B), intact segment C (C) and co-transduced with either empty RV (gray) or ID2 RV (purple), shown as integrated MFI (data pooled from three independent experiments, n = 3). Small horizontal lines indicate the mean.g, ATAC-Seq was performed on the indicated progenitor or DC populations. Shown is the Irf8 locus, with the Irf8 +41 kb enhancer region (black box) and the +32 kb enhancer region (dotted box). (representative of three independent experiments and the Immunological Genome Project Open Chromatin Regions, n= 1 biological replicate per population). Data are presented as mean and one-way or two-way ANOVA was used to compare groups. *p < 0.05, **p < 0.01, ****p < 0.0001.

References

    1. Saxena M and Bhardwaj N Re-Emergence of Dendritic Cell Vaccines for Cancer Treatment. Trends Cancer 4, 119–137 (2018). - PMC - PubMed
    1. Steinman RM and Cohn ZA Identification of a novel cell type in peripheral lymphoid organs of mice. I. Morphology, quantitation, tissue distribution. J Exp.Med 137, 1142–1162 (1973). - PMC - PubMed
    1. Cella M et al., Plasmacytoid monocytes migrate to inflamed lymph nodes and produce large amounts of type I interferon [see comments]. Nature Medicine 5, 919–923 (1999). - PubMed
    1. Murphy TL et al., Transcriptional Control of Dendritic Cell Development. Annu.Rev Immunol 34, 93–119 (2016). - PMC - PubMed
    1. Naik SH et al., Development of plasmacytoid and conventional dendritic cell subtypes from single precursor cells derived in vitro and in vivo. Nat Immunol 8, 1217–1226 (2007). - PubMed

Publication types

MeSH terms

Substances