. 2019 Sep;20(9):1161-1173.
doi: 10.1038/s41590-019-0450-x. Epub 2019 Aug 12.

Cryptic activation of an Irf8 enhancer governs cDC1 fate specification

Affiliations

Cryptic activation of an Irf8 enhancer governs cDC1 fate specification

Vivek Durai et al. Nat Immunol. 2019 Sep.

Abstract

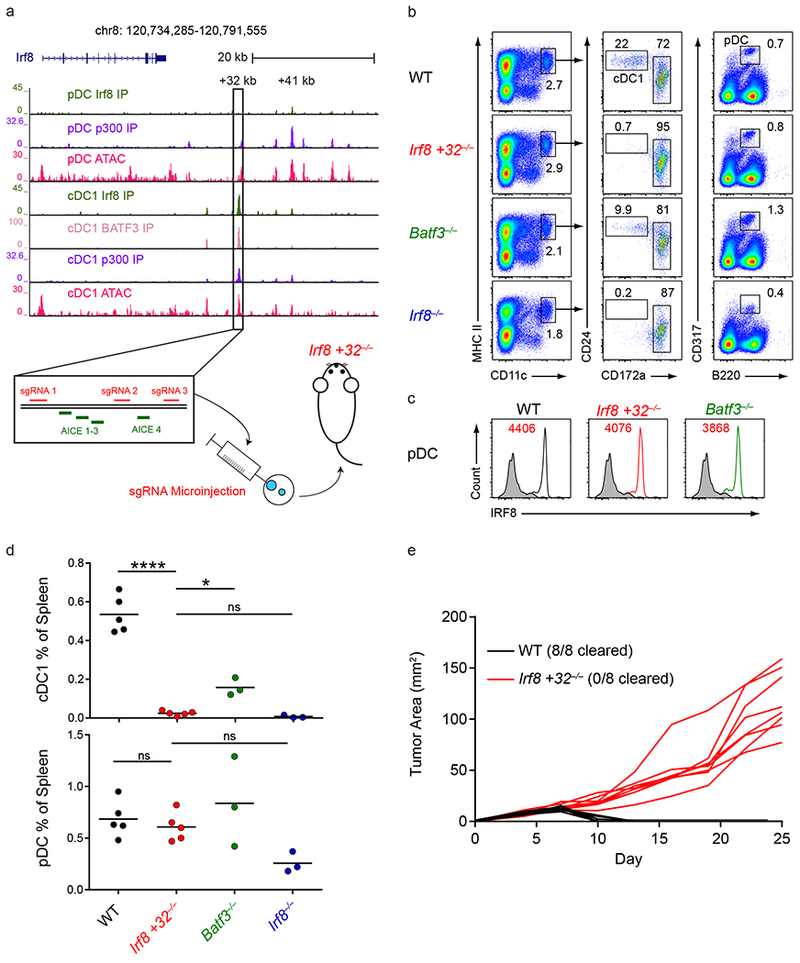
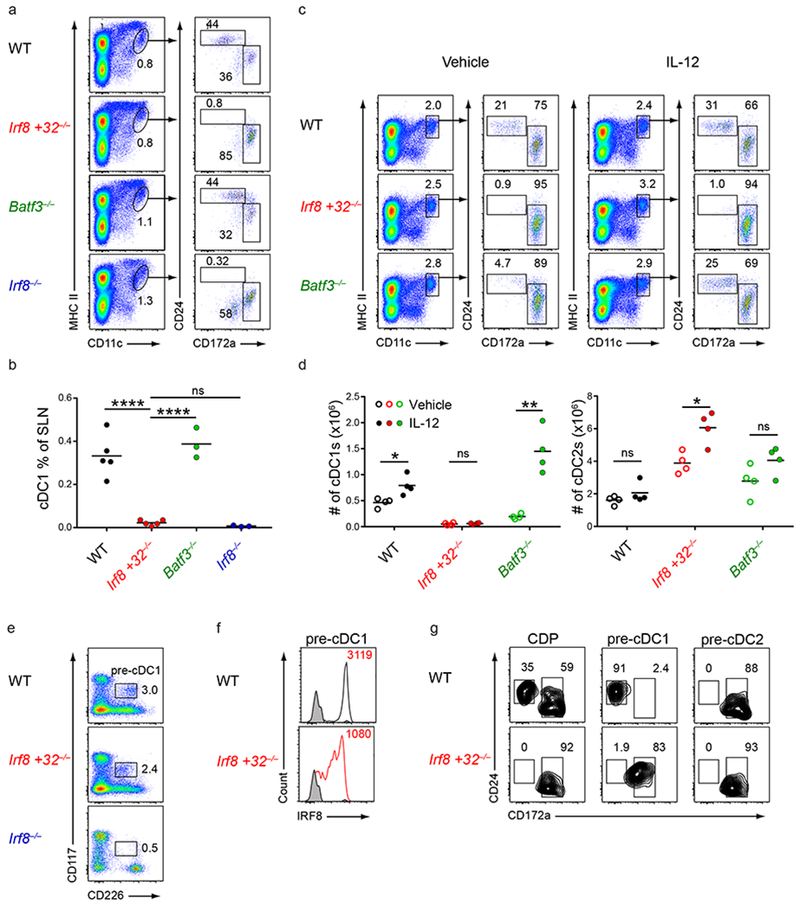
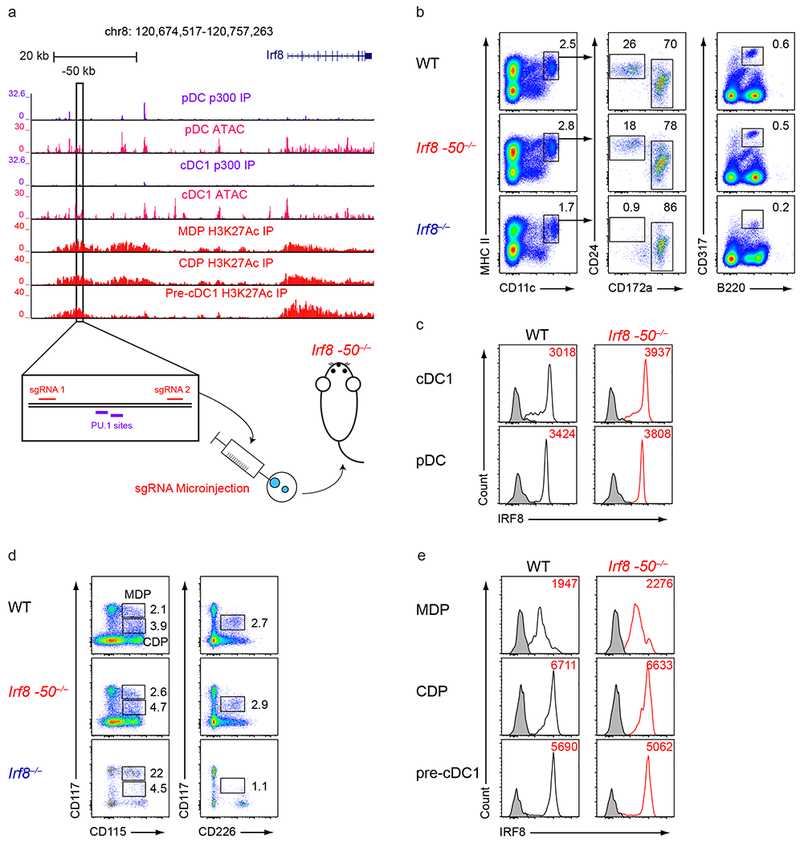
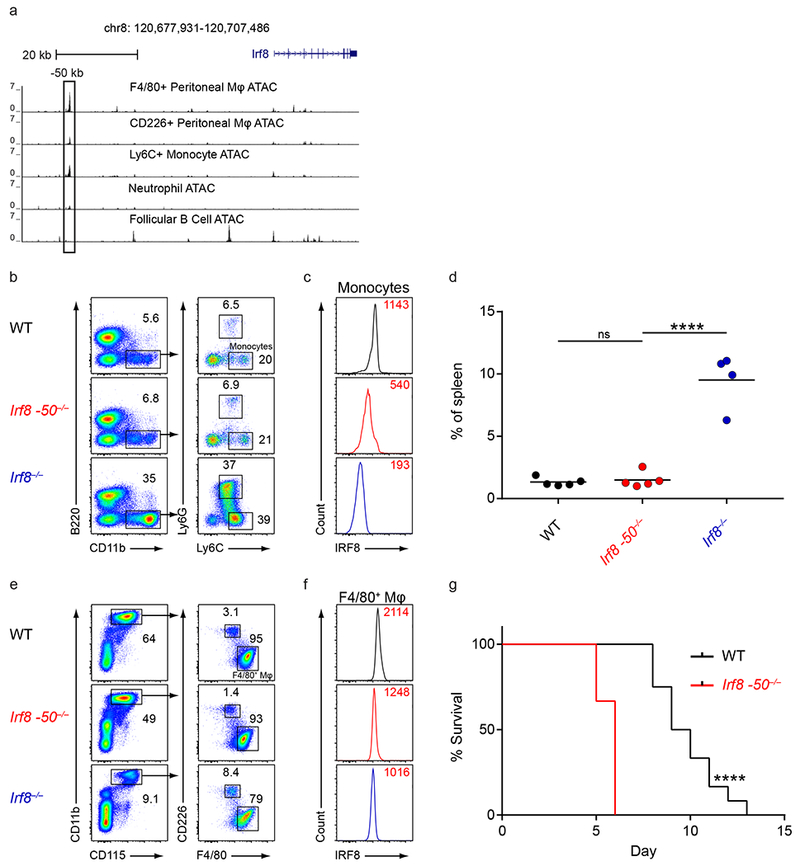
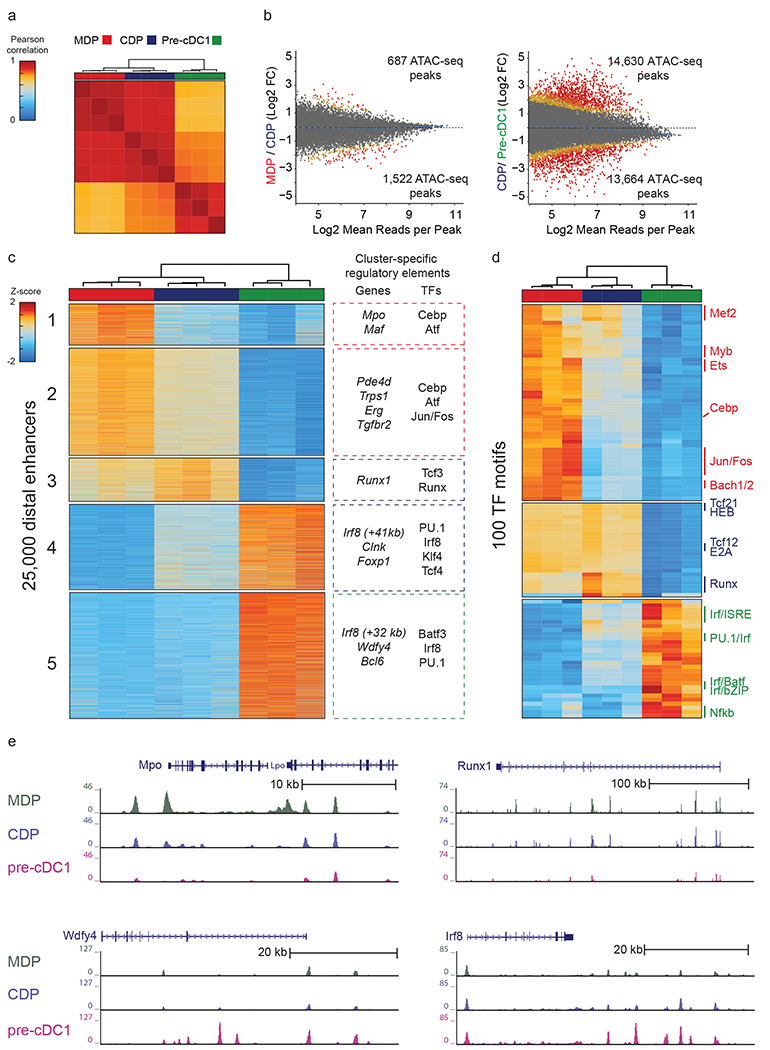
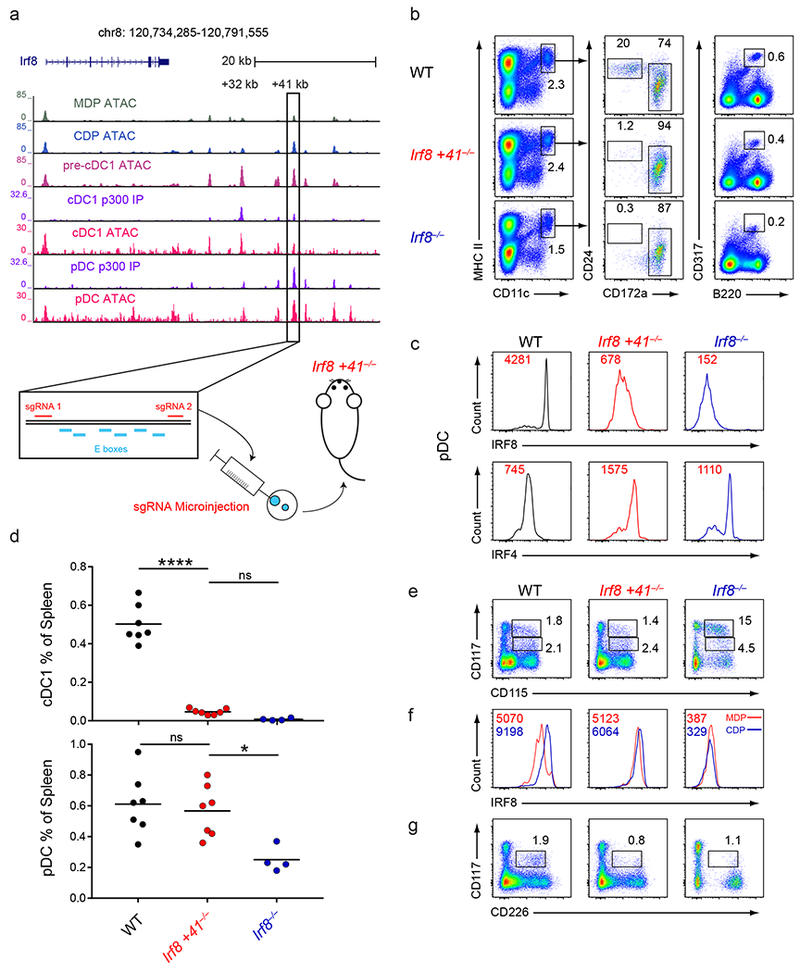
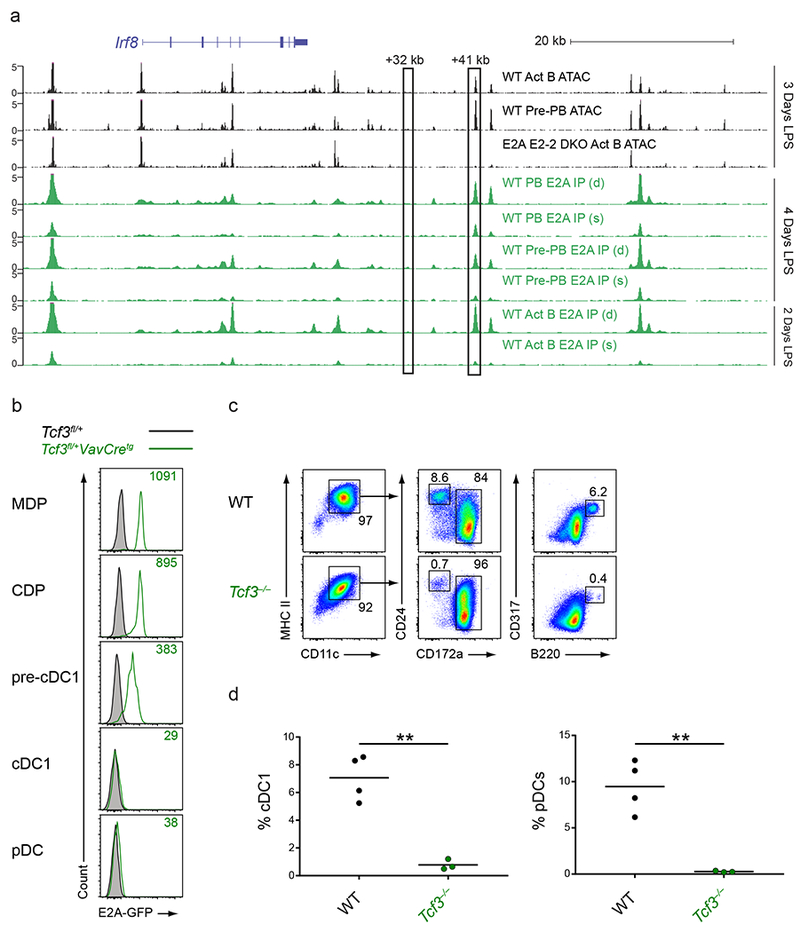
Induction of the transcription factor Irf8 in the common dendritic cell progenitor (CDP) is required for classical type 1 dendritic cell (cDC1) fate specification, but the mechanisms controlling this induction are unclear. In the present study Irf8 enhancers were identified via chromatin profiling of dendritic cells and CRISPR/Cas9 genome editing was used to assess their roles in Irf8 regulation. An enhancer 32 kilobases (kb) downstream of the Irf8 transcriptional start site (+32-kb Irf8) that was active in mature cDC1s was required for the development of this lineage, but not for its specification. Instead, a +41-kb Irf8 enhancer, previously thought to be active only in plasmacytoid dendritic cells, was found to also be transiently accessible in cDC1 progenitors, and deleting this enhancer prevented the induction of Irf8 in CDPs and abolished cDC1 specification. Thus, cryptic activation of the +41-kb Irf8 enhancer in dendritic cell progenitors is responsible for cDC1 fate specification.


Conflict of interest statement

Competing Interests

The authors declare no competing interests.

Figures

Figure 1.
Figure 1.. The +32 kb Irf8 enhancer is required for cDC1 development.
a, Normalized sequencing tracks of ChIP-seq with anti-p300, anti-BATF3, or anti-IRF8 antibodies or of ATAC-seq in the indicated populations. Boxed is the +32 kb Irf8 enhancer. Shown below is the +32 kb Irf8 enhancer with the AICE motifs and sgRNA target sequences depicted. Data are pooled from two independent experiments and the Immunological Genome Project Open Chromatin Regions (n = 1 biological replicate per population). b, Flow cytometry of live splenocytes from mice of the indicated genotypes was used to identify dendritic cell (DC) subsets. Numbers indicate the percent of cells in the indicated gates. Data are representative of four independent experiments with similar results (n = 5 mice for WT, n = 5 mice for Irf8 +32−/−, n = 3 mice for Batf3−/−, and n = 3 mice for Irf8−/−). c, Intracellular staining for IRF8 in splenic pDCs of mice of the indicated genotypes. Numbers indicate the mean fluorescence intensity (MFI) of IRF8 protein levels in pDCs. Data are representative of four independent experiments with similar results (n = 5 mice for WT, n = 5 mice for Irf8 +32−/−, n = 3 mice for Batf3−/−, and n = 3 mice for Irf8−/−). d, Statistical analysis of the frequency of splenic cDC1s and pDCs in mice of the indicated genotypes. Small horizontal lines indicate the mean. Data are pooled from four independent experiments (n = 5 mice for WT, n = 5 mice for Irf8 +32−/−, n = 3 mice for Batf3−/−, and n = 3 mice for Irf8−/−). e, Growth of 1969 regressor fibrosarcomas in WT and Irf8 +32 kb−/− mice. Data are pooled from two independent experiments (n = 8 mice for WT, n = 8 mice for Irf8 +32−/−). ns, not significant (P>0.05); *P<0.05; ****P<0.0001, ordinary one-way ANOVA (d).
Figure 2.
Figure 2.. The +32 kb Irf8 enhancer is required for compensatory cDC1 development but not for cDC1 specification.
a,b, Flow cytometry of SLNs from mice of the indicated genotypes was used to identify DC subsets. Numbers indicate the percent of cells in the indicated gates (a). Statistical analysis of the frequency of cDC1s in SLNs (b). Small horizontal lines indicate the mean. Data are pooled from four independent experiments (n = 5 mice for WT, n = 5 mice for Irf8 +32−/−, n = 3 mice for Batf3−/−, and n = 3 mice for Irf8−/−). c,d, Flow cytometry of live splenocytes from mice of the indicated genotypes after administration of vehicle or IL-12 was used to identify DC subsets. Numbers indicate the percent of cells in the indicated gates (c). Statistical analysis of the absolute number of cDC1s and cDC2s in mice of the indicated genotypes treated with either vehicle or IL-12 (d). Small horizontal lines indicate the mean. Data are pooled from two independent experiments (n = 4 mice per group for WT, n = 4 mice per group for Irf8 +32−/−, n = 4 mice per group for Batf3−/−). e, Flow cytometry of LinCD135+ bone marrow cells from mice of the indicated genotypes was used to identify pre-cDC1s. Numbers indicate the percent of cells in the indicated gates. Data are representative of three independent experiments with similar results (n = 3 mice for WT, n = 3 mice for Irf8 +32−/−, and n = 3 mice for Irf8−/−). f, Intracellular staining for IRF8 within pre-cDC1s from mice of the indicated genotypes. Numbers indicate the MFI of IRF8 protein levels in the pre-cDC1. Black shaded histograms depict IRF8 protein levels from Irf8−/− mice. Data are representative of three independent experiments with similar results (n = 3 mice for WT, n = 3 mice for Irf8 +32−/−, and n = 3 mice for Irf8−/−). g, CDPs (LinCD117intCD135+CD115+), pre-cDC1s (LinCD117intCD135+CD226+), or pre-cDC2s (LinCD117loCD135+CD115+) from mice of the indicated genotypes were sorted and cultured for 5 days with Flt3L. Cells were then stained to identify DC subsets. Cells are pregated as CD11c+MHCII+ cells to identify DCs. Data are representative of three independent experiments with similar results (n = 3 mice for WT and n = 3 mice for Irf8 +32−/−). ns, not significant (P>0.05); *P<0.05, **P<0.01; and ****P<0.0001, ordinary one-way ANOVA (b) or unpaired two-tailed Student’s t-test (d).
Figure 3.
Figure 3.. The −50 kb Irf8 enhancer is not required for dendritic cell development.
a, Normalized sequencing tracks of ChIP-seq with anti-p300 or anti-H3K27Ac antibodies or of ATAC-seq in the indicated populations. Boxed is the −50 kb Irf8 enhancer. Shown below is the −50 kb Irf8 enhancer with the PU.1 motifs and sgRNA target sequences indicated. Data are pooled from three independent experiments and the Immunological Genome Project Open Chromatin Regions (n = 1 biological replicate per population). b, Flow cytometry of live splenocytes from mice of the indicated genotypes was used to identify DC subsets. Numbers indicate the percent of cells in the indicated gates. Data are representative of four independent experiments with similar results (n = 5 mice for WT, n = 5 mice for Irf8 −50−/−, and n = 4 mice for Irf8−/−). c, Intracellular staining for IRF8 in splenic cDC1s and pDCs from mice of the indicated genotypes. Numbers indicate the MFI of IRF8 protein levels in cDC1s or pDCs as indicated. Data are representative of four independent experiments with similar results (n = 5 mice for WT, n = 5 mice for Irf8 −50−/−, and n = 4 mice for Irf8−/−). d, Flow cytometry of LinCD135+ bone marrow cells from mice of the indicated genotypes was used to identify DC progenitors. Numbers indicate the percent of cells in the indicated gates. Data are representative of three independent experiments with similar results (n = 3 mice for WT, n = 3 mice for Irf8 −50−/−, and n = 3 mice for Irf8−/−). e, Intracellular staining for IRF8 within MDPs, CDPs, and pre-cDC1s from mice of the indicated genotypes. Numbers indicate the MFI of IRF8 protein levels in the indicated populations. Black shaded histograms depict IRF8 levels from Irf8−/− mice. Data are representative of three independent experiments with similar results (n = 3 mice for WT, n = 3 mice for Irf8 −50−/−, and n = 3 mice for Irf8−/−).
Figure 4.
Figure 4.. The −50 kb Irf8 enhancer controls Irf8 expression in monocytes and macrophages.
a, Normalized sequencing tracks of ATAC-seq in the indicated populations. Boxed is the −50 kb Irf8 enhancer. Data are from the Immunological Genome Project Open Chromatin Regions (n = 1 biological replicate per population). b, Flow cytometry of live splenocytes from mice of the indicated genotypes was used to identify monocytes. Numbers indicate the percent of cells in the indicated gates. Data are representative of four independent experiments with similar results (n = 5 mice for WT, n = 5 mice for Irf8 −50−/−, and n = 4 mice for Irf8−/−). c, Intracellular staining for IRF8 in splenic monocytes of mice of the indicated genotypes. Numbers indicate the MFI of IRF8 protein levels in monocytes. Data are representative of four independent experiments with similar results (n = 5 mice for WT, n = 5 mice for Irf8 −50−/−, and n = 4 mice for Irf8−/−). d, Statistical analysis of the percent of splenic monocytes in mice of the indicated genotypes. Data are pooled from four independent experiments (n = 5 mice for WT, n = 5 mice for Irf8 −50−/−, and n = 4 mice for Irf8−/−). e, Flow cytometry of peritoneal lavage cells from mice of the indicated genotypes was used to identify peritoneal macrophages. Numbers indicate the percent of cells in the indicated gates. Data are representative of four independent experiments with similar results (n = 5 mice for WT, n = 5 mice for Irf8 −50−/−, and n = 3 mice for Irf8−/−). f, Intracellular staining for IRF8 in F4/80+ peritoneal macrophages of mice of the indicated genotypes. Numbers indicate the MFI of IRF8 protein levels in peritoneal macrophages. Data are representative of four independent experiments with similar results (n = 5 mice for WT, n = 5 mice for Irf8 −50−/−, and n = 3 mice for Irf8−/−). g, WT and Irf8 −50−/− mice were infected with Salmonella typhi and survival was monitored. Data are pooled from two independent experiments (n = 10 mice for WT and n = 10 mice for Irf8 −50−/−). ns, not significant (P>0.05); ****P<0.0001, ordinary one-way ANOVA (d) or Log-rank (Mantel-Cox) test (g).
Figure 5.
Figure 5.. ATAC-seq identifies the +41 kb Irf8 enhancer as transiently active in cDC1 progenitors
a, Pearson correlation of all distal ATAC-seq peaks for the indicated populations. Data are pooled from three independent experiments (n = 3 biological replicates per population). b, Differential ATAC-seq peaks in the indicated populations. Colors indicate orders of significance derived from DESeq2 analysis, with grey (fdr>0.1), yellow (0.1>fdr>0.01) , orange (0.01>fdr>0.001), and red (fdr<0.001) . Data are pooled from three independent experiments (n = 3 biological replicates per population). c, Heat map of k-means clusters for the top 25,000 varying distal ATAC-seq peaks. Colors indicate z-scores of reads in each peak compared with mean reads across all populations. Genes nearest to the clustered peaks and transcription factor motifs (TFs) enriched within peaks are indicated. Data are pooled from three independent experiments (n = 3 biological replicates per population). d, Heat map of k-means clusters of TF deviation z-scores for ATAC-seq profiles of the indicated populations. Data are pooled from three independent experiments (n = 3 biological replicates per population). e, Normalized sequencing tracks of ATAC-seq in the indicated populations are shown for genes in each k-means cluster. Mpo was present in k-cluster 1, Runx1 was present in k-cluster 3, Wdfy4 was present in k-cluster 4, and Irf8 was present in k-clusters 4 and 5. Data are representative of three independent experiments with similar results (n = 3 biological replicates per population).
Figure 6.
Figure 6.. The +41 kb Irf8 enhancer is required for cDC1 specification and development.
a, Normalized sequencing tracks of ChIP-seq with anti-p300 antibody or of ATAC-seq in the indicated populations. Boxed is the +41 kb Irf8 enhancer. Shown below is the +41 kb Irf8 enhancer with the E box motifs and sgRNA target sequences indicated. ATAC-seq data are representative of three independent experiments with similar results (n = 3 biological replicates for MDP ATAC, CDP ATAC, and pre-cDC1 ATAC) and ChIP-seq data are pooled from two independent experiments and the Immunological Genome Project Open Chromatin Regions (n = 1 biological replicate for cDC1 p300 IP, pDC p300 IP, cDC1 ATAC, and pDC ATAC). b, Flow cytometry of live splenocytes from mice of the indicated genotypes was used to identify DC subsets. Numbers indicate the percent of cells in the indicated gates. Data are representative of five independent experiments with similar results (n = 6 mice for WT, n = 7 mice for Irf8 +41−/−, and n = 4 mice for Irf8−/−). c, Intracellular staining for IRF8 and IRF4 in splenic pDCs of mice of the indicated genotypes. Numbers indicate the MFI of IRF8 or IRF4 protein levels in pDCs. Data are representative of four independent experiments with similar results (n = 5 mice for WT, n = 5 mice for Irf8 +41−/−, and n = 3 mice for Irf8−/−). d, Statistical analysis of the frequency of cDC1s and pDCs in spleens of mice of the indicated genotypes. Small horizontal lines indicate the mean. Data are pooled from five independent experiments (n = 6 mice for WT, n = 7 mice for Irf8 +41−/−, and n = 4 mice for Irf8−/−). e, Flow cytometry of LinCD135+ BM from mice of the indicated genotypes was used to identify MDPs and CDPs. Numbers indicate the percent of cells in the indicated gates. Data are representative of three independent experiments with similar results (n = 3 mice for WT, n = 3 mice for Irf8 +41−/−, and n = 3 mice for Irf8−/−). f, Intracellular staining for IRF8 within MDPs and CDPs from mice of the indicated genotypes. Red lines indicate the IRF8 protein level in MDPs and blue lines indicate the IRF8 protein level in CDPs. Numbers in red indicate the MFI of IRF8 protein levels in the MDP and numbers in blue indicate the MFI of IRF8 protein levels in the CDP. Data are representative of three independent experiments with similar results (n = 3 mice for WT, n = 3 mice for Irf8 +41−/−, and n = 3 mice for Irf8−/−). g, Flow cytometry of LinCD135+ BM from mice of the indicated genotypes was used to identify pre-cDC1s. Numbers indicate the percent of cells in the indicated gates. Data are representative of three independent experiments with similar results (n = 3 mice for WT, n = 3 mice for Irf8 +41−/−, and n = 3 mice for Irf8−/−). ns, not significant (P>0.05); *P<0.05; and ****P<0.0001, ordinary one-way ANOVA (d).
Figure 7.
Figure 7.. E proteins are involved in the development of cDC1s and pDCs
a, Normalized sequencing tracks of ChIP-seq with anti-E2A antibody or of ATAC-seq in lymph node B cells activated by LPS for the indicated number of days. Boxed are the +32 kb and +41 kb Irf8 enhancers. Populations analyzed were activated B cells (CD22+CD138; Act B), pre-plasmablasts (CD22CD138; pre-PB), and plasmablasts (CD22CD138+; PB) from either WT or Tcf3−/−Tcf4−/− (E2A E2-2 DKO) mice. B cells were either single (s)- or double (d)- crosslinked followed by ChIP with an E2A antibody as indicated. Data are pooled from two independent experiments (n = 1 biological replicate per population and per condition). b, Flow cytometry of LinCD135+ BM cells or live splenocytes from mice of the indicated genotypes was used to determine intracellular E2A-GFP levels in the indicated populations. Numbers indicate the MFI of E2A-GFP levels. Data are representative of four independent experiments with similar results (n = 3 mice for Tcf3fl/+ and n = 6 mice for Tcf3fl/+VavCretg). c,d, BM cells from WT or Tcf3−/− mice were cultured for 9 days in Flt3L. Cells were then analyzed by flow cytometry to identify DC subsets. Numbers indicate the percent of cells in the indicated gates (c). Statistical analysis of the frequency of cDC1s and pDCs from cultures is shown (d). Small horizontal lines indicate the mean. Data are pooled from three independent experiments (n = 3 mice for WT and n = 3 mice for Tcf3−/−). **P<0.01, unpaired two-tailed Student’s t-test (d).

References

    1. Graf T and Enver T Forcing cells to change lineages. Nature 462, 587–594 (2009). - PubMed
    1. Orkin SH and Zon LI Hematopoiesis: an evolving paradigm for stem cell biology. Cell 132, 631–644 (2008). - PMC - PubMed
    1. Miyamoto T et al. , Myeloid or lymphoid promiscuity as a critical step in hematopoietic lineage commitment. Dev.Cell 3, 137–147 (2002). - PubMed
    1. Hoppe PS et al. , Early myeloid lineage choice is not initiated by random PU.1 to GATA1 protein ratios. Nature 535, 299–302 (2016). - PubMed
    1. Long HK, Prescott SL, and Wysocka J Ever-Changing Landscapes: Transcriptional Enhancers in Development and Evolution. Cell 167, 1170–1187 (2016). - PMC - PubMed

Methods-only References

    1. Durai V et al. , Altered compensatory cytokine signaling underlies the discrepancy between Flt3(−/−) and Flt3l(−/−) mice. J Exp.Med 215, 1417–1435 (2018). - PMC - PubMed
    1. Ranganath S et al. , GATA-3-dependent enhancer activity in IL-4 gene regulation. Journal of Immunology 161, 3822–3826 (1998). - PubMed
    1. Sedy JR et al. , B and T lymphocyte attenuator regulates T cell activation through interaction with herpesvirus entry mediator. Nat.Immunol . 6, 90–98 (2005). - PubMed
    1. Zhu H et al. , Unexpected characteristics of the IFN-gamma reporters in nontransformed T cells. Journal of Immunology 167, 855–865 (2001). - PubMed
    1. McKinney J et al. , Tightly regulated gene expression system in Salmonella enterica serovar Typhimurium. J Bacteriol . 184, 6056–6059 (2002). - PMC - PubMed

Publication types

MeSH terms

Substances