. 2019 Aug 8:8:24.
doi: 10.1186/s40035-019-0164-x. eCollection 2019.

Efficient RT-QuIC seeding activity for α-synuclein in olfactory mucosa samples of patients with Parkinson's disease and multiple system atrophy

Affiliations

Efficient RT-QuIC seeding activity for α-synuclein in olfactory mucosa samples of patients with Parkinson's disease and multiple system atrophy

Chiara Maria Giulia De Luca et al. Transl Neurodegener. .

Abstract

Background: Parkinson's disease (PD) is a neurodegenerative disorder whose diagnosis is often challenging because symptoms may overlap with neurodegenerative parkinsonisms. PD is characterized by intraneuronal accumulation of abnormal α-synuclein in brainstem while neurodegenerative parkinsonisms might be associated with accumulation of either α-synuclein, as in the case of Multiple System Atrophy (MSA) or tau, as in the case of Corticobasal Degeneration (CBD) and Progressive Supranuclear Palsy (PSP), in other disease-specific brain regions. Definite diagnosis of all these diseases can be formulated only neuropathologically by detection and localization of α-synuclein or tau aggregates in the brain. Compelling evidence suggests that trace-amount of these proteins can appear in peripheral tissues, including receptor neurons of the olfactory mucosa (OM).

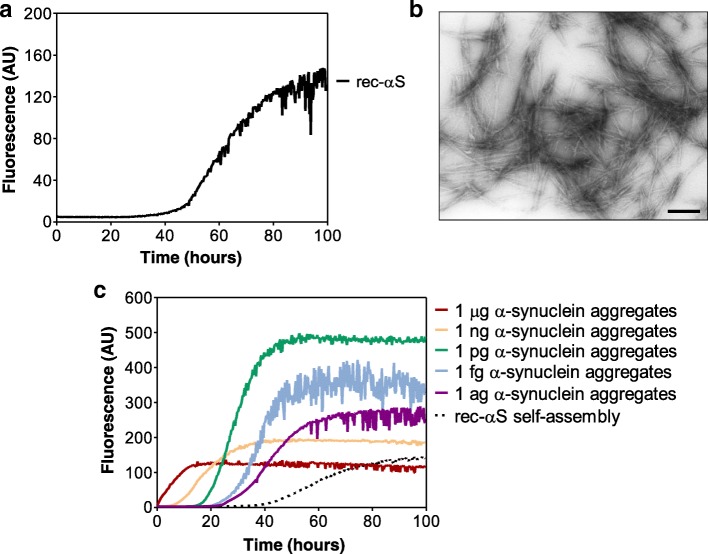
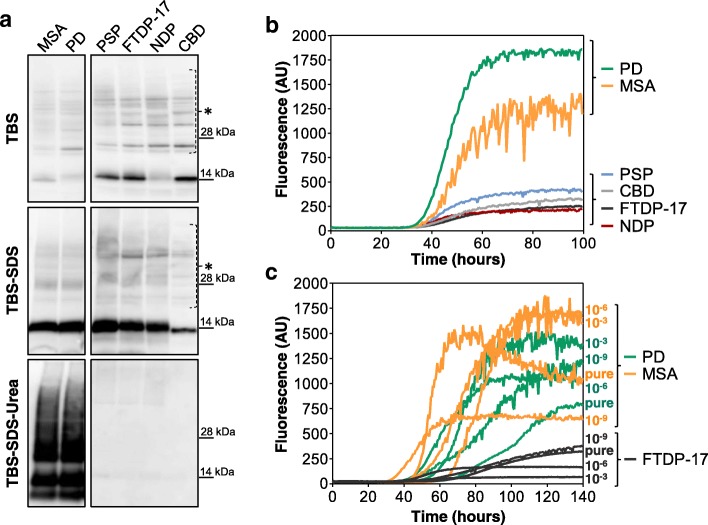
Methods: We have set and standardized the experimental conditions to extend the ultrasensitive Real Time Quaking Induced Conversion (RT-QuIC) assay for OM analysis. In particular, by using human recombinant α-synuclein as substrate of reaction, we have assessed the ability of OM collected from patients with clinical diagnoses of PD and MSA to induce α-synuclein aggregation, and compared their seeding ability to that of OM samples collected from patients with clinical diagnoses of CBD and PSP.

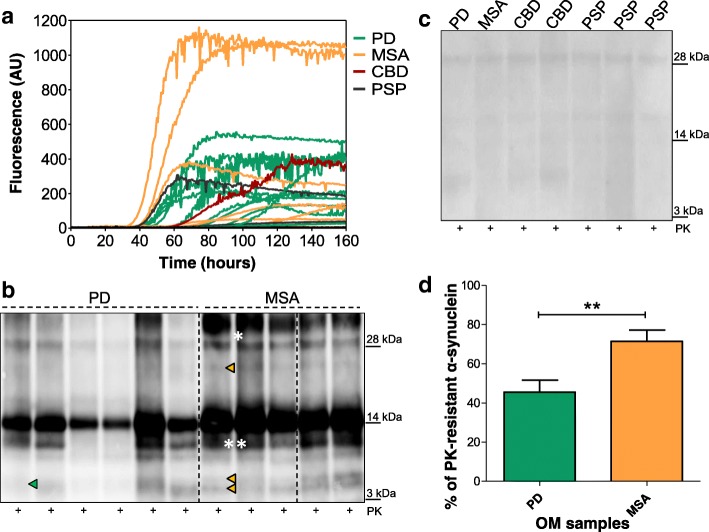
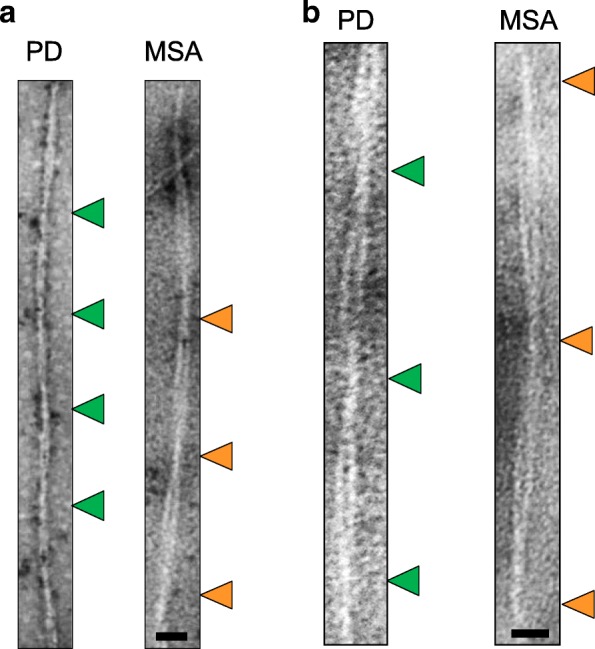
Results: Our results showed that a significant percentage of MSA and PD samples induced α-synuclein aggregation with high efficiency, but also few samples of patients with the clinical diagnosis of CBD and PSP caused the same effect. Notably, the final RT-QuIC aggregates obtained from MSA and PD samples owned peculiar biochemical and morphological features potentially enabling their discrimination.

Conclusions: Our study provide the proof-of-concept that olfactory mucosa samples collected from patients with PD and MSA possess important seeding activities for α-synuclein. Additional studies are required for (i) estimating sensitivity and specificity of the technique and for (ii) evaluating its application for the diagnosis of PD and neurodegenerative parkinsonisms. RT-QuIC analyses of OM and cerebrospinal fluid (CSF) can be combined with the aim of increasing the overall diagnostic accuracy of these diseases, especially in the early stages.

Keywords: Neurodegenerative parkinsonisms; Olfactory mucosa; Parkinson’s disease; RT-QuIC; α-Synuclein.


Conflict of interest statement

Competing interestsThe authors declare that they have no competing interests.

Figures

Fig. 1
Fig. 1
RT-QuIC analysis of in vitro generated α-synuclein aggregates. a In vitro generation of α-synuclein aggregates (artificial seeds). rec-αS [140 μM] was induced to aggregate by alternating cycles of incubation and shaking. Average ThT fluorescence intensity was plotted against time; b TEM analysis of final α-synuclein aggregates. Amyloid fibrils were efficiently generated in vitro under well controlled experimental conditions. Scale bar: 500 nm; c Assessment of the RT-QuIC detection limits. Serial dilutions of the artificial seeds previously produced were analyzed by means of RT-QuIC. All dilutions efficiently accelerated the kinetics of rec-αS aggregation. Average ThT fluorescence intensity was plotted against time. Self-assembly refers to unseeded rec-αS reactions
Fig. 2
Fig. 2
RT-QuIC analysis of brain homogenates of patients with PD and neurodegenerative parkinsonisms. a Extraction of soluble and insoluble α-synuclein fractions from brain homogenates of patients with PD, MSA, PSP, CBD, FTDP-17 or NDP control. Western blot analyses confirmed the presence of insoluble α-synuclein only in PD and MSA samples. Blots were immunostained with the AS08 358 antibody. Numbers in the right indicate the position of molecular weights. Asterisks indicate unspecific binding. b RT-QuIC analysis of BH samples. Two μL of sonicated BH collected from PD, MSA, PSP, CBD, FTDP-17 and NDP patients was added to rec-αS substrate and analyzed by means of RT-QuIC. PD and MSA samples efficiently induced rec-αS aggregation that reached higher levels of fluorescence intensities compared to those of PSP, CBD, FTDP-17 and NDP. Average ThT fluorescence intensity was plotted against time. c Assessment of the RT-QuIC detection limits. Serial dilutions (undiluted, 10− 3, 10− 6, 10− 9) of sonicated BH collected from PD, MSA and FTDP-17 subjects were analyzed by means of RT-QuIC. All dilutions efficiently induced rec-αS aggregation but those of FTDP-17 were characterized by lower fluorescence intensities compared to those of PD and MSA. Average ThT fluorescence intensity was plotted against time
Fig. 3
Fig. 3
RT-QuIC analysis of OM samples collected from patients with PD and neurodegenerative parkinsonisms. a Kinetics of rec-αS aggregation after the addition of OM samples. Two μL of OM collected from PD (n = 18), MSA (n = 11), CBD (n = 6) and PSP (n = 12) was added to rec-αS substrate and analyzed by means of RT-QuIC. 10/18 samples of PD, 9/11 samples of MSA, 1/6 sample of CBD and 2/12 samples of PSP induced the aggregation of the substrate. Average ThT fluorescence intensity was plotted against time. b Biochemical analyses of RT-QuIC products of OM samples collected from PD and MSA patients that induced rec-αS aggregation (representative image). Ten μL of final RT-QuIC products were digested with PK and analyzed by means of Western blot. Green arrows indicate peculiar bands of RT-QuIC products seeded with PD samples. One band migrating at around 6–8 kDa is found in these samples. Orange arrows indicate peculiar band of RT-QuIC products seeded with MSA samples. Two bands are detected at around 6–8 kDa and a third band is detected at around 22 kDa. Blots were immunostained with the AS08 358 antibody. One asterisk (*) indicates the presence of aggregated species of α-synuclein, while two asterisks (**) indicate partially digested protein. Numbers in the right indicate the position of molecular weights. Dashed lines indicate cropped images from separate gels. c Biochemical analyses of RT-QuIC products of OM samples collected from PD, MSA, CBD and PSP patients that did not induce rec-αS aggregation. Ten μL of final RT-QuIC products were digested with PK and analyzed by means of Western blot and revealed the lack of PK-resistant bands. Blots were immunostained with the AS08 358 antibody. Numbers in the right indicate the position of molecular weights. d Densitometric analysis of RT-QuIC products seeded with PD (n = 4) or MSA (n = 4) samples. Three replicates per sample were subjected to PK treatment (100 μg/mL, 37 °C, 60 min) and immunostained with the AS08 358 antibody before quantification. This analysis confirmed that differences in PK resistance between PD and MSA samples were statistically significant (p = 0.0061)
Fig. 4
Fig. 4
Representative TEM images of RT-QuIC products seeded with OM samples derived from PD and MSA patients. a Measurements of the distance between over-twists in final RT-QuIC fibrils seeded with samples of PD (n = 5) and samples of MSA (n = 5). As shown, the distance between over-twists in α-synuclein fibrils obtained from RT-QuIC products seeded with OM of MSA patients (orange arrows) was about 142 ± 1.3 nm (mean ± standard error of the mean) while that of PD patients (green arrows) was shorter and about 131 ± 1.1 nm and such differences were statistically significant (p < 0.0001, Mann-Withney U test). Scale bar: 35 nm. b TEM images of the same samples taken at higher magnification. Scale bar: 23 nm

References

    1. Lee A, Gilbert RM. Epidemiology of Parkinson disease. Neurol Clin. 2016;34(4):955–965. doi: 10.1016/j.ncl.2016.06.012. - DOI - PubMed
    1. Safarpour D, Willis AW. Clinical epidemiology, evaluation, and Management of Dementia in Parkinson disease. Am J Alzheimers Dis Other Dement. 2016;31(7):585–594. doi: 10.1177/1533317516653823. - DOI - PMC - PubMed
    1. Levin J, Kurz A, Arzberger T, Giese A, Hoglinger GU. The differential diagnosis and treatment of atypical parkinsonism. Dtsch Arztebl Int. 2016;113(5):61–69. - PMC - PubMed
    1. Bhidayasiri R, Rattanachaisit W, Phokaewvarangkul O, Lim TT, Fernandez HH. Exploring bedside clinical features of parkinsonism: a focus on differential diagnosis. Parkinsonism Relat Disord. 2018. - PubMed
    1. McFarland NR. Diagnostic Approach to Atypical Parkinsonian Syndromes. Continuum (Minneap Minn) 2016;22(4 Movement Disorders):1117–1142. - PMC - PubMed