. 2020 May 1;112(5):507-515.
doi: 10.1093/jnci/djz159.

Identification and Characterization of Tumor-Initiating Cells in Multiple Myeloma

Affiliations

Identification and Characterization of Tumor-Initiating Cells in Multiple Myeloma

Minjie Gao et al. J Natl Cancer Inst. .

Abstract

Background: Treatment failures in cancers, including multiple myeloma (MM), are most likely due to the persistence of a minor population of tumor-initiating cells (TICs), which are noncycling or slowly cycling and very drug resistant.

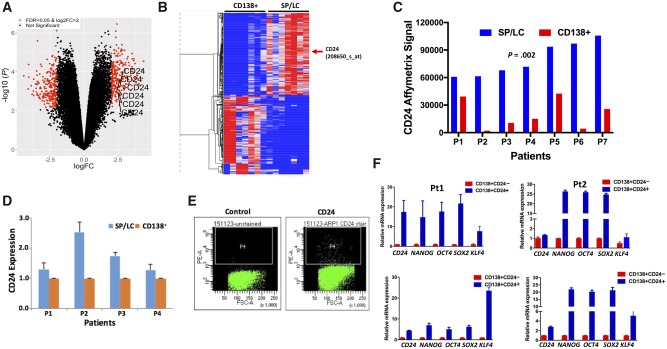
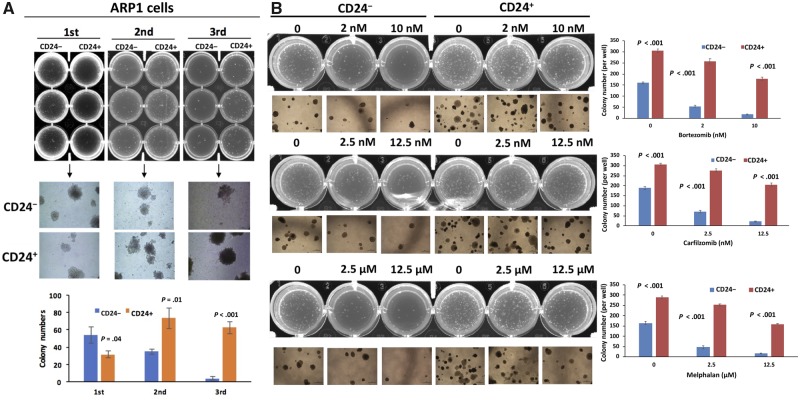
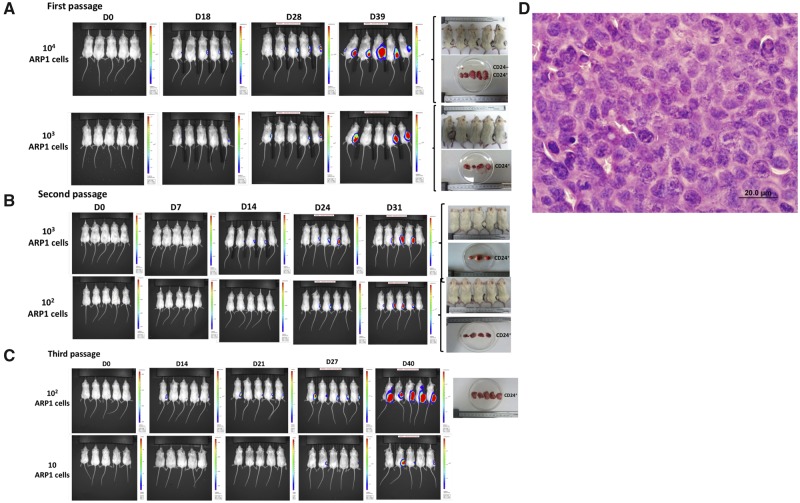
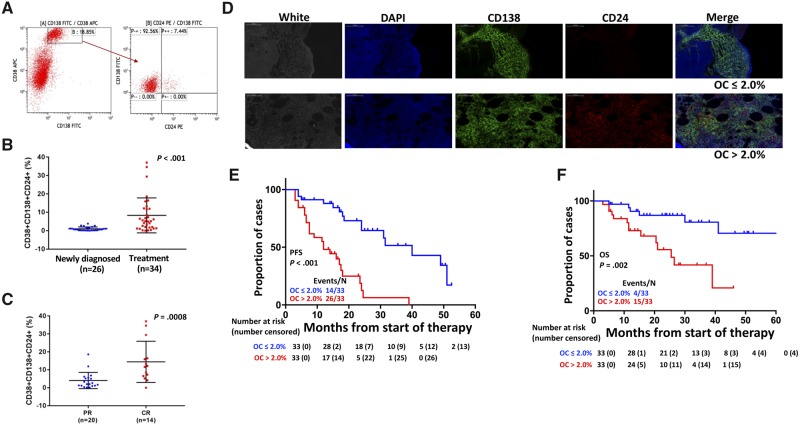
Methods: Gene expression profiling and real-time quantitative reverse transcription polymerase chain reaction were employed to define genes differentially expressed between the side-population cells, which contain the TICs, and the main population of MM cells derived from 11 MM patient samples. Self-renewal potential was analyzed by clonogenicity and drug resistance of CD24+ MM cells. Flow cytometry (n = 60) and immunofluorescence (n = 66) were applied on MM patient samples to determine CD24 expression. Therapeutic effects of CD24 antibodies were tested in xenograft MM mouse models containing three to six mice per group.

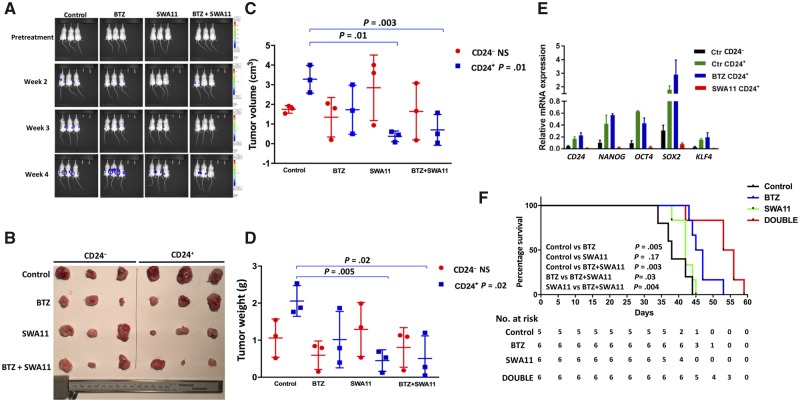
Results: CD24 was highly expressed in the side-population cells, and CD24+ MM cells exhibited high expression of induced pluripotent or embryonic stem cell genes. CD24+ MM cells showed increased clonogenicity, drug resistance, and tumorigenicity. Only 10 CD24+ MM cells were required to develop plasmacytomas in mice (n = three of five mice after 27 days). The frequency of CD24+ MM cells was highly variable in primary MM samples, but the average of CD24+ MM cells was 8.3% after chemotherapy and in complete-remission MM samples with persistent minimal residual disease compared with 1.0% CD24+ MM cells in newly diagnosed MM samples (n = 26). MM patients with a high initial percentage of CD24+ MM cells had inferior progression-free survival (hazard ratio [HR] = 3.81, 95% confidence interval [CI] = 5.66 to 18.34, P < .001) and overall survival (HR = 3.87, 95% CI = 16.61 to 34.39, P = .002). A CD24 antibody inhibited MM cell growth and prevented tumor progression in vivo.

Conclusion: Our studies demonstrate that CD24+ MM cells maintain the TIC features of self-renewal and drug resistance and provide a target for myeloma therapy.


Figures

Figure 1.
Figure 1.
Identification of CD24 as a tumor-initiating cell marker in multiple myeloma (MM). A) The volcano plot was used to visualize gene fold change (FC) and statistical significance between side-population (SP)/light-chain (LC) and CD138+ MM cells from seven paired primary MM samples (n = 14). We used linear models with a false discovery rate (FDR) of less than .05 and logFC greater than 2 as the cutoff for differential expressed genes analysis. B) The heatmap was generated by Morpheus. Normalized log2 expression Affymetrix Signals were subtracted from row mean and divided by row SD. The color of each cell in the tabular image represents the expression level of each gene, with red representing an expression greater than the mean, blue representing an expression less than the mean, and the deeper color intensity representing a greater magnitude of deviation from the mean. The red arrow indicates the CD24 gene. C) The CD24 Affymetrix Signal was presented from seven paired MM samples (n = 14) with SP/LC and CD138+ detected by gene expression profiles. The two-sided paired t test was used to calculate the P value. D) CD24 messenger RNA (mRNA) expression from four MM patients with paired SP/LC and CD138+ MM cells was detected by quantitative reverse transcription polymerase chain reaction (qRT-PCR). E) Dot plots by flow cytometry presented CD24+ MM cells in MM cell lines. The figure shows a representative ARP1 MM cell line. F) The qRT-PCR results showed the expression of induced pluripotent or embryonic stem cell genes (NANOG, OCT4, SOX2, and KLF4) between CD138+CD24+ and CD138+CD24 cells derived from four primary MM samples. The data are presented as the mean (SD) of triplicates. FSC-A = forward scatter area; PE-A = phycoerythrin area; Pt = patient.
Figure 2.
Figure 2.
Characterization of tumor-initiating cell features of CD24+ myeloma cells in vitro. A) CD24+ and CD24 cells from the ARP1 cell line were serially plated in methylcellulose in triplicate up to three passages. The colony quantification is shown at the bottom panel for each passage after 2 weeks. B) CD24+ and CD24 ARP1 cells from the second passage were plated for colony formation and treated with the indicated drugs and different doses. The colony quantification is shown in the right panels for each drug. The data are presented as the mean (SD) of triplicate samples. P values were calculated using two-sided Student t test.
Figure 3.
Figure 3.
Determination of tumorigenesis of CD24+ myeloma cells in vivo. A–C) CD24+ multiple myeloma (MM) cells developed tumors in NOD-Rag1null mice. The CD24+ (right flank) and CD24 (left flank) ARP1 cells were injected into NOD-Rag1null mice from the first through third generations. Representative IVIS imaging shows the tumor growth from the first, second, and third transplantations of ARP1 MM cells. Only 10 CD24+ MM cells were sufficient to generate tumors in three of five mice by day 27 (the third generation). D) Hemotoxylin and eosin staining of a tumor section from the indicated mouse (×60 magnification).
Figure 4.
Figure 4.
Determination of the clinical relevance of CD24+ myeloma cells in primary patient samples. A) Flow cytometry shows a representative sample analyzed by CD138-, CD38-, and CD24-specific antibodies. B) The percentages of CD24+ multiple myeloma (MM) cells were compared in newly diagnosed MM patients and MM patients after treatment, with samples collected for evaluating response to bortezomib (BTZ)-based therapy immediately after two to three cycles of therapy. The two-sided t test was used to calculate the P value. C) The percentages of CD24+ MM cells were compared between partial remission (PR) and complete remission (CR) with minimal residual disease. The two-sided t test was used to calculate the P value. D) Double staining immunofluorescence of CD138 and CD24 in primary MM samples: Representative immunostaining showed the expression of CD138 (green) and CD24 (red) in primary human MM bone marrow (BM). DAPI was used for cell nuclear counterstains; scale bars represent 100 μm (black and white). E,F) Kaplan-Meier analyses showed progression-free survival (PFS; E) and overall survival (OS; F) of 66 newly diagnosed MM patients. Overlap coefficient (OC) scores were used to determine the degree of overlap of CD138 and CD24 fluorescence signals. The P values presented in this figure were based on the log-rank test. Each line represents different subgroups determined by the CD24 expression and described in the figure and color coded as indicated. The 60 samples for flow cytometry were freshly isolated from BM aspirates and included newly diagnosed and treated MM patients. These samples were collected for evaluating response to BTZ-based therapy immediately after two to three cycles of therapy, whereas the 66 samples used for immunofluorescence were stored BM biopsies embedded in paraffin blocks from newly diagnosed MM patients. The two sample sets were collected at different time points and did not overlap. APC = allophycocyanin; DAPI = 4′,6-diamidino-2-phenylindole; FITC = fluorescein isothiocyanate; PE = phycoerythrin.
Figure 5.
Figure 5.
The therapeutic effects of CD24 antibody (SWA11) in xenografted myeloma mouse models. Approximately 12 000 CD24+ and CD24 ARP1 cells were injected into the right and left flanks of NOD-Rag1null mice. Mice were treated with bortezomib (BTZ), SWA11, the combination of BTZ with SWA11, or the control with phosphate-buffered saline for 3 weeks after 1-week injection of tumor cells. A) Multiple myeloma tumors were measured by bioluminescence assay with or without treatments for 4 weeks. B) Tumors from mice described in A were harvested and photographed. C, D) Quantifications of tumors volume (C) and weight (D) from dissected tumors shown in A and B. For the multiple group comparisons, such as Figure 5, C and D, one-way analysis of variance test was used to analyze the four groups in the CD24+ and CD24 populations, respectively. The data are presented as the mean (SD) of triplicate samples. The two-sided t test was used to analyze the differences in tumor volume and weight in CD24+ groups between control (without treatment) vs SWA11; control vs BTZ; control vs BTZ + SWA11; SWA11 vs BTZ + SWA11; and BTZ vs BTZ + SWA11. Only significant comparisons (control vs SWA11 and control vs BTZ + SWA11) are labeled in the figure. E) Quantitative reverse transcription polymerase chain reaction was performed in dissected tumors described in A and B. The data are presented as the mean (SD) of triplicate samples. P values were calculated using two-sided Student t test. F) Kaplan-Meier curves showing survival of mice treated with BTZ, SWA11, BTZ + SWA11, or vehicle control. The P values presented in this figure were based on the log-rank test. mRNA = messenger RNA; NS = not statistically significant.

Similar articles

Cited by

References

    1. Lapidot T, Sirard C, Vormoor J, et al. A cell initiating human acute myeloid leukaemia after transplantation into SCID mice. Nature. 1994;367(6464):645–648. - PubMed
    1. Bonnet D, Dick JE.. Human acute myeloid leukemia is organized as a hierarchy that originates from a primitive hematopoietic cell. Nat Med. 1997;3(7):730–737. - PubMed
    1. Al-Hajj M, Wicha MS, Benito-Hernandez A, et al. Prospective identification of tumorigenic breast cancer cells. Proc Natl Acad Sci USA. 2003;100(7):3983–3988. - PMC - PubMed
    1. Singh SK, Hawkins C, Clarke ID, et al. Identification of human brain tumour initiating cells. Nature. 2004;432(7015):396–401. - PubMed
    1. Ricci-Vitiani L, Lombardi DG, Pilozzi E, et al. Identification and expansion of human colon-cancer-initiating cells. Nature. 2007;445(7123):111–115. - PubMed

Publication types