. 2019 Sep;73(8-9):429-441.
doi: 10.1007/s10858-019-00235-7. Epub 2019 Aug 12.

Importance of time-ordered non-uniform sampling of multi-dimensional NMR spectra of Aβ1-42 peptide under aggregating conditions

Affiliations

Importance of time-ordered non-uniform sampling of multi-dimensional NMR spectra of Aβ1-42 peptide under aggregating conditions

Jinfa Ying et al. J Biomol NMR. 2019 Sep.

Abstract

Although the order of the time steps in which the non-uniform sampling (NUS) schedule is implemented when acquiring multi-dimensional NMR spectra is of limited importance when sample conditions remain unchanged over the course of the experiment, it is shown to have major impact when samples are unstable. In the latter case, time-ordering of the NUS data points by the normalized radial length yields a reduction of sampling artifacts, regardless of the spectral reconstruction algorithm. The disadvantage of time-ordered NUS sampling is that halting the experiment prior to its completion will result in lower spectral resolution, rather than a sparser data matrix. Alternatively, digitally correcting for sample decay prior to reconstruction of randomly ordered NUS data points can mitigate reconstruction artifacts, at the cost of somewhat lower sensitivity. Application of these sampling schemes to the Alzheimer's amyloid beta (Aβ1-42) peptide at an elevated concentration, low temperature, and 3 kbar of pressure, where approximately 75% of the peptide reverts to an NMR-invisible state during the collection of a 3D 15N-separated NOESY spectrum, highlights the improvement in artifact suppression and reveals weak medium-range NOE contacts in several regions, including the C-terminal region of the peptide.

Keywords: Aggregation; High pressure; SMILE; Sampling scheme; Sparse sampling; Time ordering.


Figures

Fig. 1
Fig. 1
Simulation of the impact of sample decay on (a–c) the time domain in the indirect dimension of a fully sampled 2D experiment, and (d–f) corresponding frequency domain NMR data. (a) Interferogram, S(t1, ω2) of a fully sampled, noise-free, on-resonance signal of 116 ms duration and an intrinsic T2 of 87 ms, in the absence of sample decay. (b) Simulated time domain data, recorded conventionally, while the sample exponentially degrades with a time constant that results in a decrease in sample concentration by 50% at the end of data collection. (c) Simulated time domain decay when the ordering in the t1 dimension is randomized, as applies to common NUS data collection. (d–f) Fourier transforms of the time domain signals of (a–c), after apodization with a cosine bell function and zero filling. Red boxes mark segments of the baseline that are upscaled 10-fold.
Fig. 2
Fig. 2
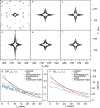
Impact of time ordering on the apparent noise level, lineshape, and peak intensity when reconstructing a noise-free simulated time-domain signal, on-resonance in the F1 and F2 dimensions. Sample decay is accounted for by an exponential decrease of the amplitude of the FIDs by exp{−1.4(k−1)/N}, where N is the total number of acquired FIDs, and k is the FID number (k=1 for the first FID, and k=N for the last FID). The length of the simulated time domain data is set to the transverse relaxation time in both the t1 and t2 dimensions (53.6 ms, t1; 30.8 ms, t2). The 2D planes are (F2, F1) cross sections taken at the center of the peak in the F3 dimension for spectra with different FID acquisition order. (a) Randomly ordered, or sorted by (b) the sum: ∑i = 1,2ki; (c) the normalized sum: ∑i = 1,2(ki/Ni); (d) conventional ordering (k1 first and then k2), (e) radial length: i=1,2(ki)2 and (f) normalized radial length: i=1,2(ki/Ni)2.A low first contour level (0.2% of the peak height) is used for panels (bf), while a four times higher level is used for (a). (g) S(ω1, t2, ω3) and (h) S(t1, ω2, ω3) interferograms, corresponding to the six modes of ordering of the detected FIDs. Plots of panels b, c, e, and f at four times lower contour levels are shown in SI Fig. S1.
Fig. 3
Fig. 3
Plot of the Aβ1–42 signal intensity decay during the interleaved 3D NOESY-HSQC experiment. Blue circles represent the normalized intensity measured from the 1D spectra, corresponding to t1,t2 = 0,0 time points, spiked every hour during the 3D data collection. The red line represents a bi-exponential fit, I(t) = 0.191 exp(−t/5.1) + 0.815 exp(−t/33.4) to the intensity decay, where t is the time in units of hours after the start of the measurement.
Fig. 4
Fig. 4
Skyline-projected regions of 3D NOESY-HSQC spectra on the 1H-1H plane. The projection was limited to the 120.27–124.17 ppm region 15N chemical shifts and therefore only includes amide signals of residues resonating in this region (depicted between the two dashed lines in SI Fig. S2). Two separate but fully interleaved sets of 3D time domain data were recorded, using duplicates of a single sampling list, but with the order of these sampling points randomized for (a) and sorted for (b). Panel (c) was reconstructed from the same experimental data as used for (a) but utilized upscaling of each FID by the inverse of the fitted, bi-exponential decay function of Fig. 3. Panels (a) and (b) are plotted at the same contour levels, while the lowest contour level is 1.6 times higher in (c) reflecting the increase of the peak intensity by a factor of ca 1.6 resulting from the signal upscaling, which increases the intrinsic thermal noise level by a factor of ca 2.4. Individual cross sections through the 3D spectrum are compared in Fig. 5.
Fig. 5
Fig. 5
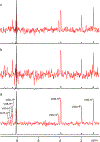
Cross sections taken through the 3D spectra for which projected regions are shown in Fig. 4. F1 cross sections for V39 are taken at (F2, F3) = (8.08, 120.56) ppm from the SMILE-reconstructed 3D NOESY-HSQC spectra acquired using (a) the normalized radial length and (b) randomly ordered sampling schedules, containing the same time points and a sparsity of 12% for each spectrum. (c) The same cross section obtained from the randomly ordered data set but with FID intensities corrected for sample decay prior to NUS reconstruction. In all panels, black traces are scaled to display the full amplitude of the diagonal resonance; red traces are upscaled 10-fold.
Fig. 6
Fig. 6
Strip plot of the time-ordered 3D NOESY-HSQC for the last 9 residues of Aβ1–42. Sequential NOEs are marked by blue arrowed lines, unless there is a longer-range NOE passing through the sequential one. Red lines represent medium-range NOEs, with the inter-residue peaks circled in red. Noise and reconstruction artifacts above the contour threshold, as well as off-strip peaks, are marked ×. Each strip is taken from the 1H-1H plane and labeled with its HN chemical shift and residue. A complete strip plot is presented in Fig. S4, with the corresponding 1H-15N HSQC spectrum shown in Fig. S2.

References

    1. Barna JCJ, Laue ED, Mayger MR, Skilling J & Worrall SJP Exponential Sampling, an Alternative Method for Sampling in Two-Dimensional Nmr Experiments. J. Magn. Reson 73, 69–77 (1987).
    1. Rovnyak D et al. Accelerated acquisition of high resolution triple-resonance spectra using non-uniform sampling and maximum entropy reconstruction. J. Magn. Reson 170, 15–21 (2004). - PubMed
    1. Mobli M, Maciejewski MW, Schuyler AD, Stern AS & Hoch JC Sparse sampling methods in multidimensional NMR. Phys. Chem. Chem. Phys 14, 10835–10843 (2012). - PMC - PubMed
    1. Coggins BE, Werner-Allen JW, Yan A & Zhou P Rapid Protein Global Fold Determination Using Ultrasparse Sampling, High-Dynamic Range Artifact Suppression, and Time-Shared NOESY. J. Am. Chem. Soc 134, 18619–18630 (2012). - PMC - PubMed
    1. Bermel W et al. Speeding up sequence specific assignment of IDPs. J. Biomol. NMR 53, 293–301 (2012). - PubMed

LinkOut - more resources