. 2019 Dec 15;145(12):3376-3388.
doi: 10.1002/ijc.32624. Epub 2019 Sep 10.

JAK-STAT inhibition impairs K-RAS-driven lung adenocarcinoma progression

Affiliations

JAK-STAT inhibition impairs K-RAS-driven lung adenocarcinoma progression

Julian Mohrherr et al. Int J Cancer. .

Abstract

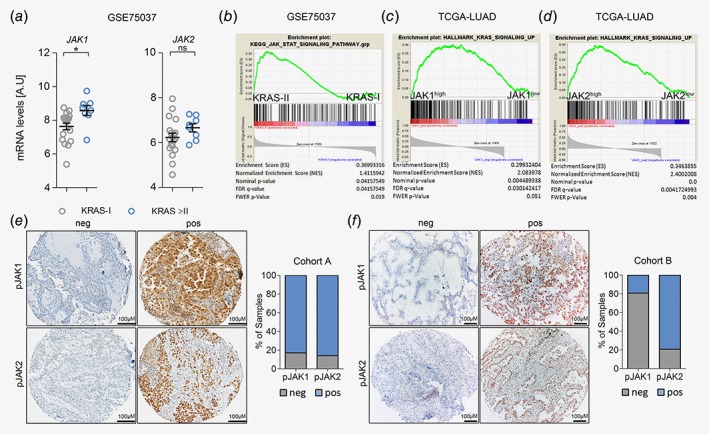
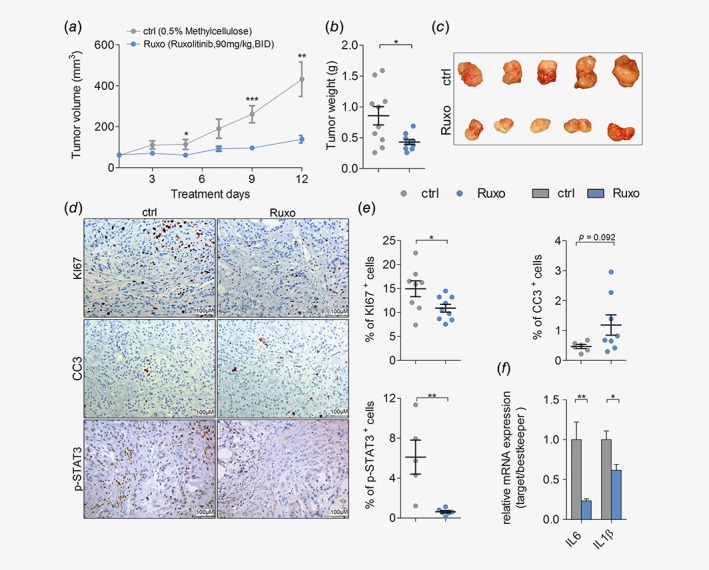
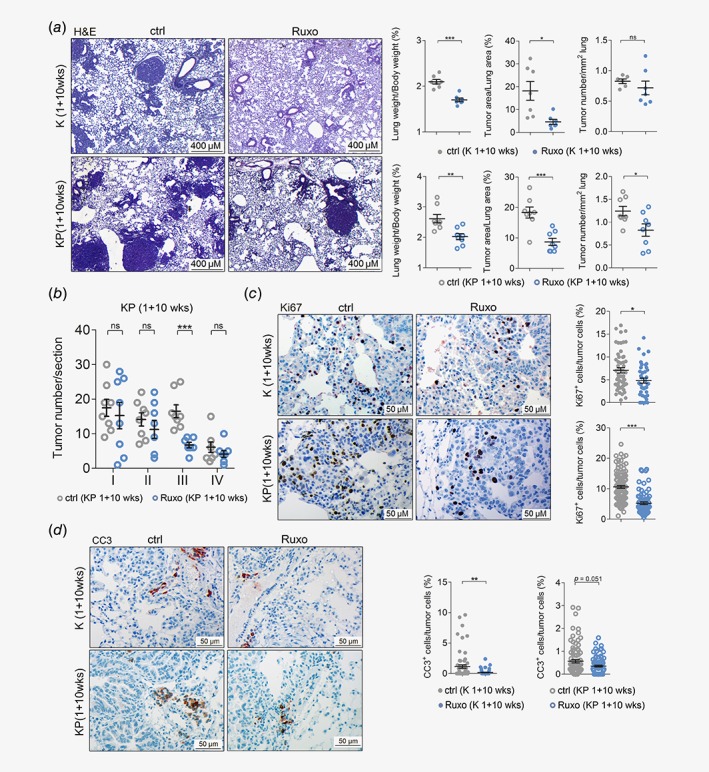
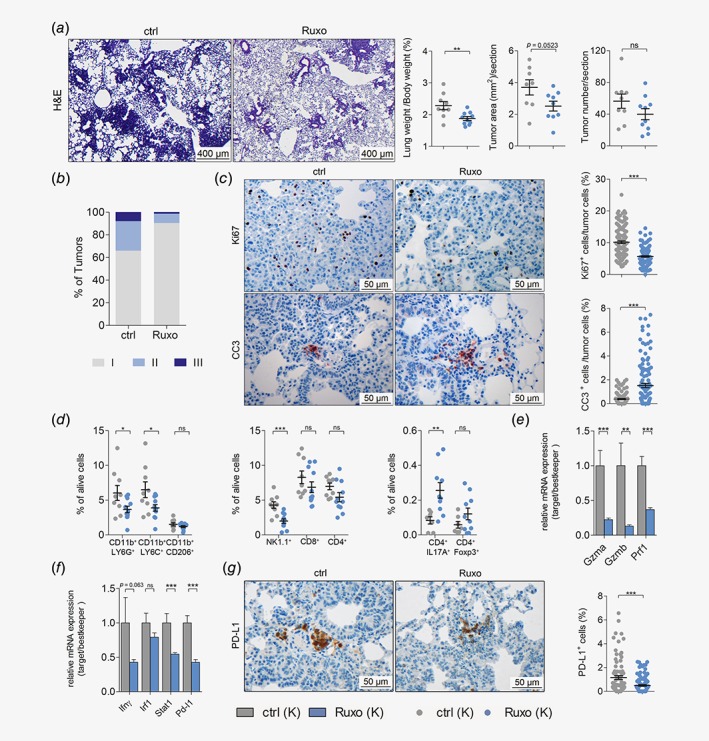
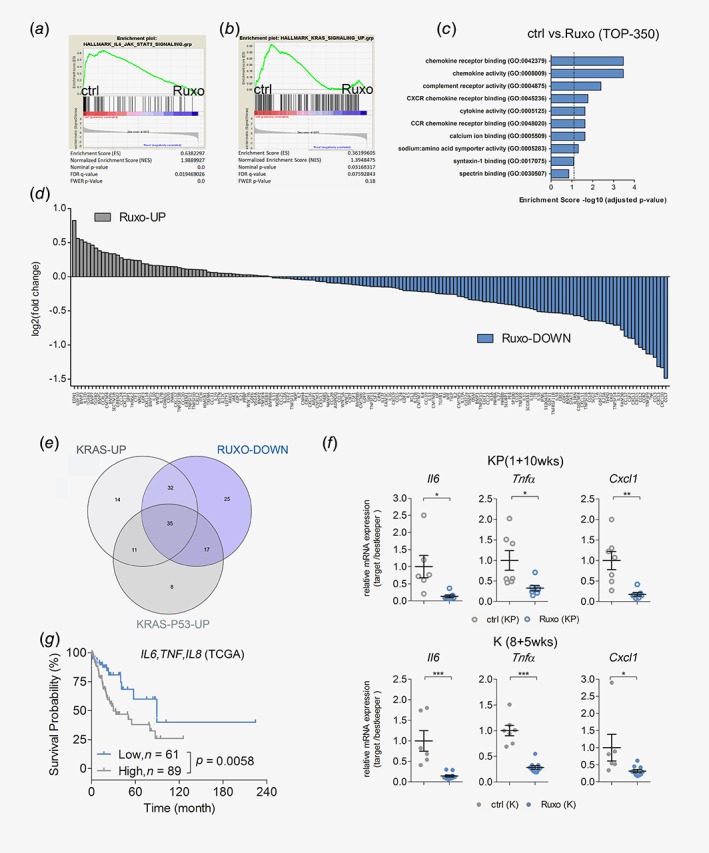
Oncogenic K-RAS has been difficult to target and currently there is no K-RAS-based targeted therapy available for patients suffering from K-RAS-driven lung adenocarcinoma (AC). Alternatively, targeting K-RAS-downstream effectors, K-RAS-cooperating signaling pathways or cancer hallmarks, such as tumor-promoting inflammation, has been shown to be a promising therapeutic strategy. Since the JAK-STAT pathway is considered to be a central player in inflammation-mediated tumorigenesis, we investigated here the implication of JAK-STAT signaling and the therapeutic potential of JAK1/2 inhibition in K-RAS-driven lung AC. Our data showed that JAK1 and JAK2 are activated in human lung AC and that increased activation of JAK-STAT signaling correlated with disease progression and K-RAS activity in human lung AC. Accordingly, administration of the JAK1/2 selective tyrosine kinase inhibitor ruxolitinib reduced proliferation of tumor cells and effectively reduced tumor progression in immunodeficient and immunocompetent mouse models of K-RAS-driven lung AC. Notably, JAK1/2 inhibition led to the establishment of an antitumorigenic tumor microenvironment, characterized by decreased levels of tumor-promoting chemokines and cytokines and reduced numbers of infiltrating myeloid derived suppressor cells, thereby impairing tumor growth. Taken together, we identified JAK1/2 inhibition as promising therapy for K-RAS-driven lung AC.

Keywords: Janus kinase (JAK); Kirsten rat sarcoma viral proto-oncogene (K-RAS); cell-line derived xenografts; genetically engineered mouse models; lung adenocarcinoma (AC); non-small cell lung cancer; ruxolitinib; tumor microenvironment (TME); tumor promoting inflammation.


Figures

Figure 1
Figure 1
JAK‐mediated signaling is activated in progressing K‐RAS‐mutated human lung AC. (a) Graph showing relative JAK1 and JAK2 mRNA expression levels in human K‐RAS‐mutated lung AC tissue of stage I (n = 19) versus stage II or higher (≥II, n = 8). Data represent mean ± SEM, A.U (arbitrary units), Student's t‐test, *p < 0.05. (b) GSEA for Kyoto encyclopedia of genes and genomes‐JAK–STAT pathway signature geneset comparing human K‐RAS‐mutated tumors of stage I versus stage II, using tumor versus healthy parenchyma mRNA expression ratios. Data in (a) and (b) were retrieved from the Gene Expression Omnibus (GSE75037). (c) GSEA using gene expression data of the Cancer Genome Atlas‐LUAD cohort and HALLMARK_KRAS_SIGNALING_UP geneset, stratifying patients according to JAK1 and (d) JAK2 expression levels (n = 154). (e) Representative pictures of lung AC biopsies of patients included in cohort A (unknown K‐RAS mutation status; pJAK1 n = 303, pJAK2 n = 318) and (f) cohort B (K‐RAS mutated; pJAK1 n = 26, pJAK2 n = 24) with negative and positive staining reactions for pJAK1 and pJAK2 in tumor cells. Graphs represent percentage of positive and negative cases within the respective cohort. Staining intensities and percentage of positive tumor cells were determined by a board‐certified pathologist (H.P.). [Color figure can be viewed at http://wileyonlinelibrary.com]
Figure 2
Figure 2
JAK inhibition impairs growth of human K‐RAS‐mutated lung AC cells in vivo. (a) Mean volumes of xenografted A549 derived tumors in mice treated with vehicle control (ctrl) or ruxolitinib (Ruxo) at 90 mg/kg body weight, seven times per week, BID, and (b) the endpoint tumor weight. (c) Representative pictures of A549 tumor‐derived xenografts after ctrl or Ruxo treatment. (d) Representative pictures of immunohistochemical stainings for KI67, cleaved caspase 3 (CC3) and p‐STAT3 staining of A549 cell line derived xenograft tumors upon ctrl and Ruxo treatment (scale bar: 100 μm), and (e) quantitation of positive cells for respective stainings. (f) Relative mRNA expression of human transcript variants of indicated genes normalized to human housekeeping genes (28S, TBP, ACTB) in A549 derived xenografted tumors. (df) n = ≥ 5 tumors per group. For all graphs Student's t‐test: *p < 0.05, **p < 0.01, ***p < 0.001. For all graphs data presented as means ± SEM. [Color figure can be viewed at http://wileyonlinelibrary.com]
Figure 3
Figure 3
Ruxolitinib attenuates tumorigenesis of autochthonous K‐RAS‐driven lung AC. (a) Left panel: representative pictures of hematoxylin and eosin stained lung sections of vehicle control (ctrl) or ruxolitinib (Ruxo) treated Kras G12D (K) mice (n = 7 per group) and Kras G12D:p53 fl/fl (KP) mice (n = 8 per group). Treatment was started 1 week post tumor initiation, and continued for 10 weeks, with ruxolitinib being administered at 90 mg/kg body weight, seven times per week, BID (scale bars: 400 μm). Right panel: quantitation of hematoxylin and eosin stained lung sections from K mice (upper) and KP‐mice (lower) treated with ctrl or Ruxo started 1 week post tumor initiation and continued for 10 weeks. (b) Graph depicts tumor numbers per section stratified by tumor grades. Per mouse, one section was analyzed (n = 8 mice per group). (c) Left panel: representative pictures of immunohistochemical stainings for KI67 positive cells of lungs stemming from ctrl and Ruxo treated K and KP mice. Right panel: quantitation of indicated stainings. (d) Left panel: cleaved caspase‐3 positive cells of lungs of ctrl and Ruxo treated K and KP mice. Right panel: quantitation of indicated stainings (scale bars: 50 μm). (c, d) Mann–Whitney U‐test, *p < 0.05, **p < 0.01, ***p < 0.001. Others: Student's t‐test. *p < 0.05, **p < 0.01, ***p < 0.001. For all graphs data presented as means ± SEM. [Color figure can be viewed at http://wileyonlinelibrary.com]
Figure 4
Figure 4
JAK inhibition impairs progression of established K‐RAS‐mutated lung AC and alters TME. (a) Left panel: representative pictures of hematoxylin and eosin stained lung sections of vehicle control (ctrl) or ruxolitinib (Ruxo) treated Kras G12D (K) mice. Right panel: quantitation of hematoxylin and eosin stained lung sections of ctrl or Ruxo treated Kras G12D (K) mice. Treatment was started 8 week post tumor initiation, and continued for 5 weeks (8 + 5wks), with ruxolitinib being administered at 90 mg/kg body weight, seven times per week, BID (scale bars: 400 μm) (n ≥ 9 per group). (b) Graph represents the percentage of tumors with indicated grades in vehicle control and ruxolitinib treated K mice. (c) Left panel: representative pictures of immunohistochemical stainings for KI67 and cleaved caspase‐3 positive cells, comparing lungs of ctrl or Ruxo treated K mice (8 + 5 weeks). Right panel: quantitation of indicated stainings (scale bars: 50 μm). (d) Results of flow cytometric analysis depicting the percentage of myeloid cells (left), lymphoid cells (middle) and CD4+ subsets (right) in tumor‐harboring lung lysates of ctrl and Ruxo treated K mice (8 + 5 weeks). (e) Graph displaying relative mRNA expression of the indicated genes normalized to housekeeping genes (28s, Tbp, Actb) in tumor harboring lungs of ctrl versus Ruxo treated K mice (8 + 5 weeks). (f) Graph indicating relative mRNA expression of the indicated genes normalized to housekeeping genes (28s, Tbp, Actb) in tumor harboring lungs of ctrl versus Ruxo treated K mice (8 + 5 weeks). (g) Left panel: representative pictures of immunohistochemical staining for PD‐L1 positive cells of lungs stemming from ctrl and Ruxo treated K mice (8 + 5 weeks). Right panel: quantitation of indicated staining. (c, g) Mann–Whitney U‐test. Others: Student's t‐test. For all graphs data presented as means ± SEM. *p < 0.05, **p < 0.01, ***p < 0.001. [Color figure can be viewed at http://wileyonlinelibrary.com]
Figure 5
Figure 5
JAK inhibition abrogates expression of oncogenic chemokines and cytokines. (a) GSEA of RNA‐seq data of lungs of Kras G12D (K) mice 8 weeks post tumor induction, treated with vehicle control (ctrl) or ruxolitinib (Ruxo) for four consecutive days before harvesting (n = 4 per group). The used genesets are HALLMARK_IL6_STAT3_SIGNALING and (b) HALLMARK_KRAS_SIGNALING_UP, comparing ctrl and Ruxo treatment. (c) Graph depicting the adjusted p‐values of enrichment scores of indicated GO‐molecular function pathways in ctrl versus Ruxo treated K mice. The top 350 genes downregulated in lungs of Ruxo treated mice compared to ctrl treated mice were included in the analysis. (d) Graph shows DESeq calculated log2 fold changes in mRNA expression of indicated up‐ or downregulated chemokine/cytokine related genes in tumor bearing lungs of Ruxo treated compared to ctrl treated K mice. (e) Venn diagram depicting amount of overlapping chemokine and cytokine related genes in all three groups. The defined 35 common genes were found by intersecting the after gene data sets: genes downregulated in tumor bearing lungs of Ruxo treated mice compared to ctrl treated mice (RUXO‐DOWN), genes upregulated in K‐ras G12D mutated alveolar type‐II cells compared to WT alveolar type‐II cells (KRAS‐UP, GSE113146) and genes upregulated in K‐ras‐p53‐mutated tumor‐harboring lungs compared to WT lungs from KP mice (KRAS‐P53‐UP). (f) Relative mRNA expression of the indicated genes normalized to housekeeping genes (28s, Tbp, Actb) in tumor harboring lungs of vehicle control versus ruxolitinib treated KP mice (upper) and K mice (lower). (g) Graph depicts prognostic value of indicated genes in human K‐RAS‐mutated lung AC samples. Patients were stratified according to auto best cut‐off selection. Data were retrieved from the Cancer Genome Atlas (n = 150). Log‐rank test was used for statistical analysis. For (f) Student's t‐test. *p < 0.05, **p < 0.01, ***p < 0.001. Data presented as means ± SEM. [Color figure can be viewed at http://wileyonlinelibrary.com]

References

    1. Siegel RL, Miller KD, Jemal A. Cancer statistics, 2016. CA Cancer J Clin 2016;66:7–30. - PubMed
    1. Zappa C, Mousa SA. Non‐small cell lung cancer: current treatment and future advances. Transl Lung Cancer Res 2016;5:288–300. - PMC - PubMed
    1. Cancer Genome Atlas Research Network . Comprehensive molecular profiling of lung adenocarcinoma. Nature 2014;511:543–50. - PMC - PubMed
    1. Swanton C, Govindan R. Clinical implications of genomic discoveries in lung cancer. N Engl J Med 2016;374:1864–73. - PubMed
    1. Yang Z, Hackshaw A, Feng Q, et al. Comparison of gefitinib, erlotinib and afatinib in non‐small cell lung cancer: a meta‐analysis. Int J Cancer 2017;140:2805–19. - PubMed

Publication types

MeSH terms