. 2019 Dec;8(1):318-329.
doi: 10.1080/21623945.2019.1649578.

Identification of biomarkers, pathways and potential therapeutic agents for white adipocyte insulin resistance using bioinformatics analysis

Affiliations

Identification of biomarkers, pathways and potential therapeutic agents for white adipocyte insulin resistance using bioinformatics analysis

Yemin Zhang et al. Adipocyte. 2019 Dec.

Abstract

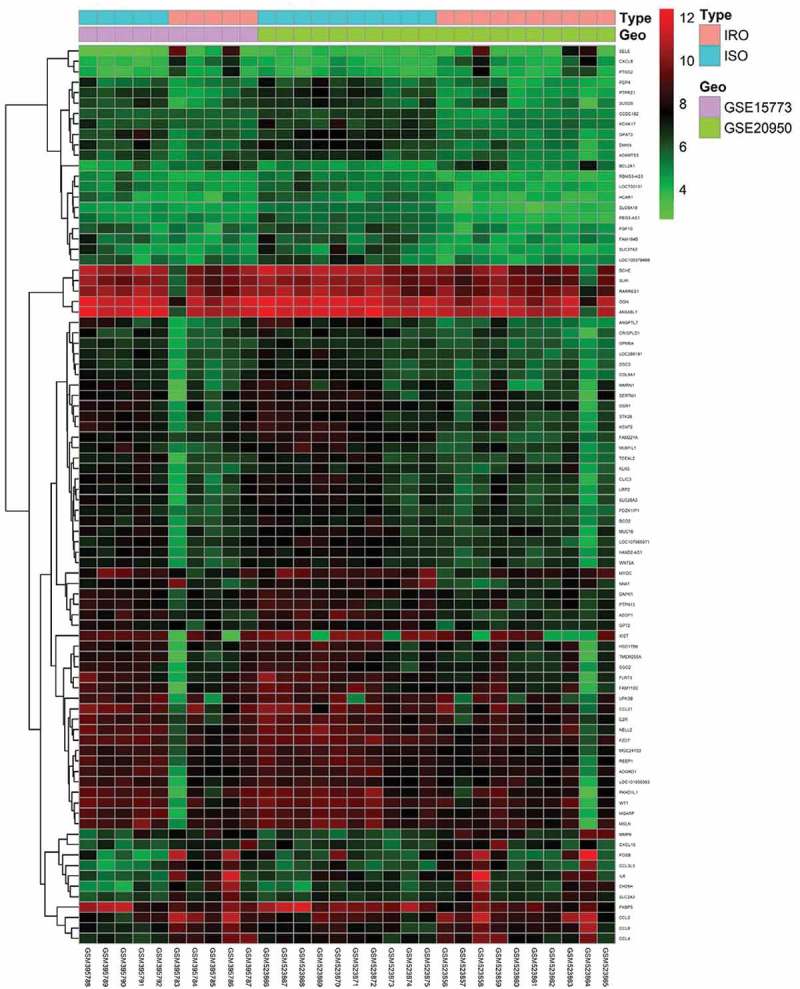
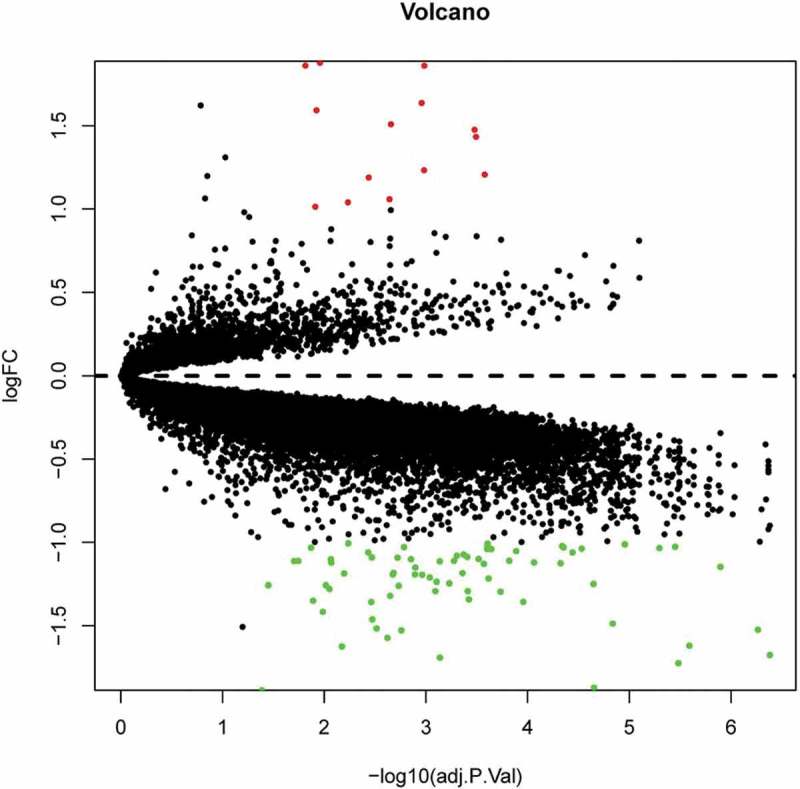
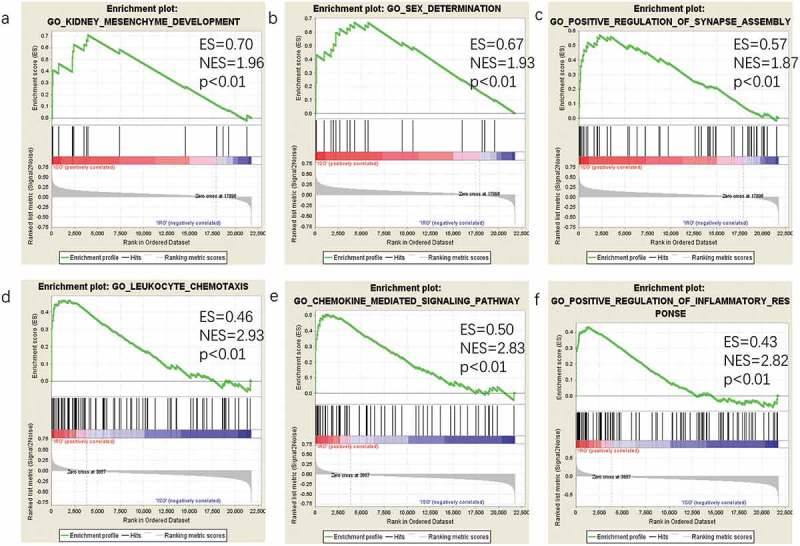
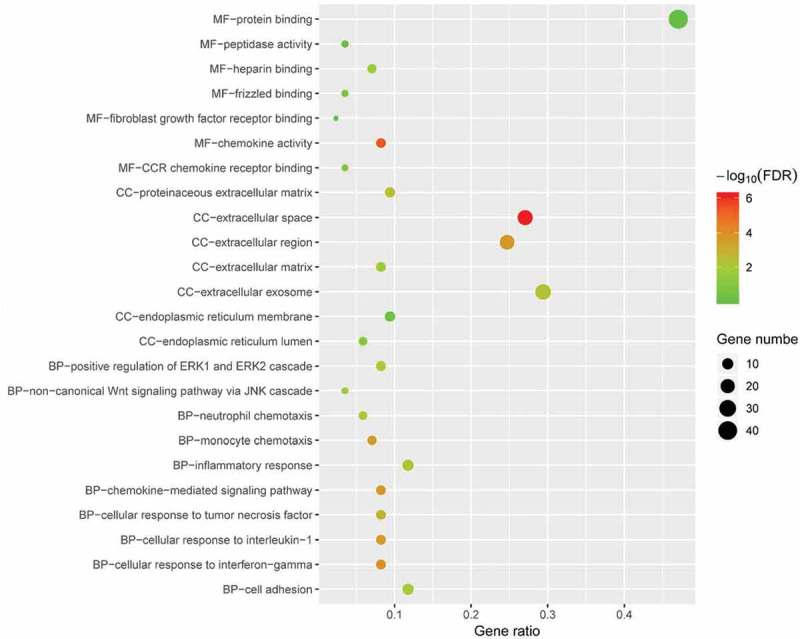
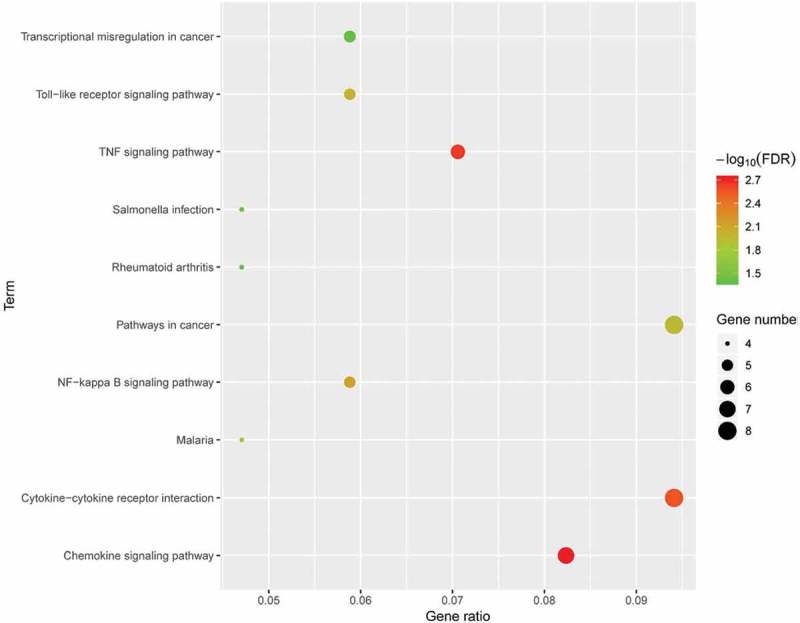
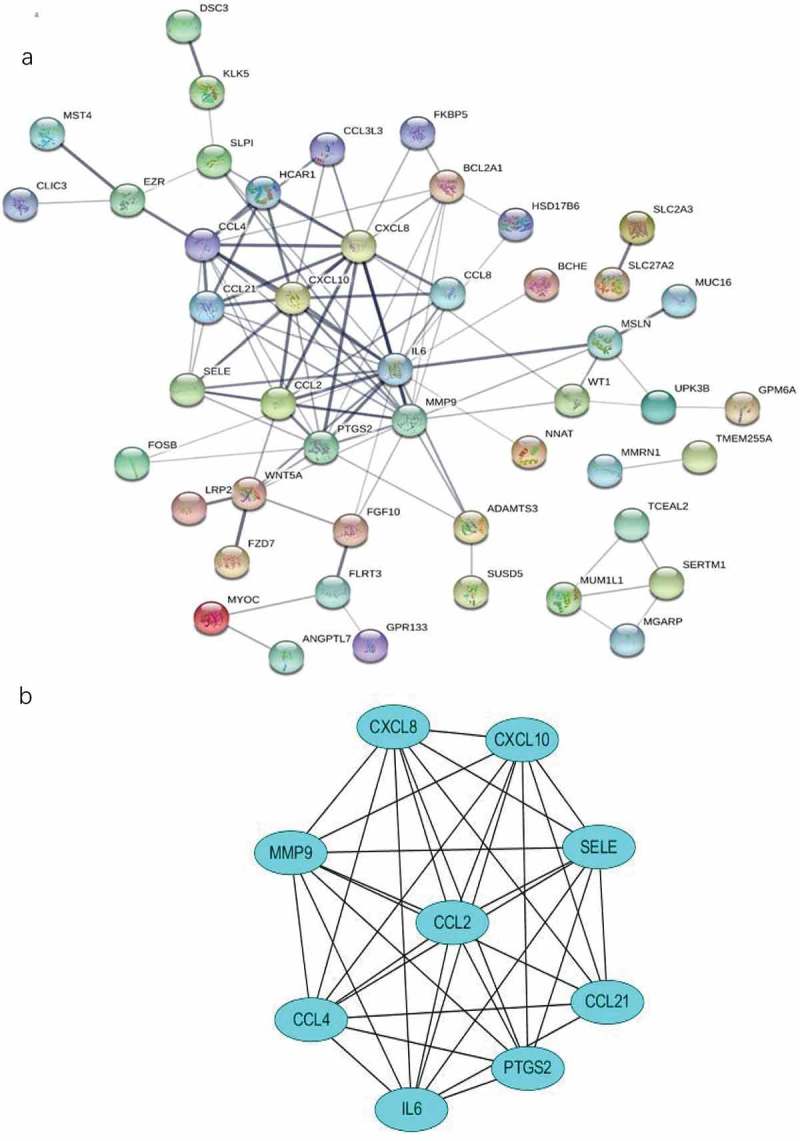
For the better understanding of insulin resistance (IR), the molecular biomarkers in IR white adipocytes and its potential mechanism, we downloaded two mRNA expression profiles from Gene Expression Omnibus (GEO). The white adipocyte samples in two databases were collected from the human omental adipose tissue of IR obese (IRO) subjects and insulin-sensitive obese (ISO) subjects, respectively. We identified 86 differentially expressed genes (DEGs) between the IRO and ISO subjects using limma package in R software. Gene Set Enrichment Analysis (GSEA) provided evidence that the most gene sets enriched in kidney mesenchyme development in the ISO subjects, as compared with the IRO subjects. The Gene Ontology (GO) analysis indicated that the most significantly enriched in cellular response to interferon-gamma. The Kyoto Encyclopedia of Genes and Genomes (KEGG) pathway analysis revealed that the DEGs were most significantly enriched in cytokine-cytokine receptor interaction. Protein-Protein Interaction (PPI) network was performed with the STRING, and the top 10 hub genes were identified with the Cytohubba. CMap analysis found several small molecular compounds to reverse the altered DEGs, including dropropizine, aceclofenac, melatonin, and so on. Our outputs could empower the novel potential targets to treat omental white adipocyte insulin resistance, diabetes, and diabetes-related diseases.

Keywords: DEGs; Insulin resistance; bioinformatics; hub gene; omental adipocyte.


Figures

Figure 1.
Figure 1.
Heatmap of 86 DEGs screened by limma package in R software. Red areas represent highly expressed genes and green areas represent lowly expressed genes in omental adipose from IRO subjects compared with ISO subjects. DEG: differentially expressed gene; IRO: insulin-resistant obesity; ISO: insulin sensitivity obesity.
Figure 2.
Figure 2.
Volcano plot analysis identifies DEGs. Red dots represent 12 upregulated genes and green dots represent 64 downregulated genes in omental adipocyte from IRO subjects compared with ISO subjects.
Figure 3.
Figure 3.
GSEA plot showing most enriched gene sets of all detected genes in the IRO subjects. The top-three most significant down-regulated enriched gene sets in the IRO subjects: kidney mesenchyme development (a), sex determination (b), positive regulation of synaspse assembly (c). The top-three most significant up-regulated enriched gene sets in the IRO subjects: leukocyte chemotaxis (d), chemokine-mediated signalling pathway (e), positive regulation of inflammatory response (f). GSEA: gene set enrichment analysis; NES: normalized enrichment score.
Figure 4.
Figure 4.
GO enrichment result of DEGs. The x-axis label represents gene ratio and y-axis label represents GO terms. The size of circle represents gene count. Different colour of circles represents different adjusted p value. DEG: differentially expressed gene; FDR: false discovery rate; GO: Gene Ontology.
Figure 5.
Figure 5.
KEGG pathway analysis of differentially expressed genes. Advanced bubble chart shows enrichment of DEGs in signalling pathways. Y-axis label represents pathway, and X-axis label represents rich factor (rich factor = amount of DEGs enriched in the pathway/amount of all DEGs in background gene set). Size and colour of the bubble represent amount of DEGs enriched in pathway and enrichment significance, respectively. KEGG: Kyoto Encyclopedia of Genes and Genomes; DEG: differentially expressed gene; FDR: false discovery rate.
Figure 6.
Figure 6.
The PPI network and the most significant modules of DEGs. (a) The PPI network was analyzed by String software. Here were 47 nodes and 102 edged in the PPI network. (b) The most significant module identified by MCODE (score = 8.5). DEG: differentially expressed gene; PPI: protein–protein interaction.
Figure 7.
Figure 7.
The expression of genes significantly upregulated in the adipose of the 10-weeks obese diabetic mice. (a) CCL2 gene expression was significantly upregulated in the adipocyte of the 10-weeks obese diabetic mice (p < 0.001). (b) IL6 gene expression was significantly upregulated in the adipocyte of the 10-weeks obese diabetic mice (p < 0.05). (c) CCL4 gene expression was significantly upregulated in the adipocyte of the 10-weeks obese diabetic mice (p < 0.001).

Similar articles

Cited by

References

    1. Kahn BB, Flier JS.. Obesity and insulin resistance. J Clin Invest. 2000;106:473–481. - PMC - PubMed
    1. Ye J. Mechanisms of insulin resistance in obesity. Front Med. 2013;7:14–24. - PMC - PubMed
    1. Fantuzzi G. Adipose tissue, adipokines, and inflammation. J Allergy Clin Immunol. 2005;115: 911–919. quiz 920. - PubMed
    1. Fabbrini E, Sullivan S, Klein S. Obesity and nonalcoholic fatty liver disease: biochemical, metabolic, and clinical implications. Hepatology. 2010;51:679–689. - PMC - PubMed
    1. Jia G, DeMarco VG, Sowers JR. Insulin resistance and hyperinsulinaemia in diabetic cardiomyopathy. Nat Rev Endocrinol. 2016;12:144–153. - PMC - PubMed

Publication types

MeSH terms

Substances