. 2019 Aug 13;322(6):546-556.
doi: 10.1001/jama.2019.10255.

Association Between Long-term Exposure to Ambient Air Pollution and Change in Quantitatively Assessed Emphysema and Lung Function

Affiliations

Association Between Long-term Exposure to Ambient Air Pollution and Change in Quantitatively Assessed Emphysema and Lung Function

Meng Wang et al. JAMA. .

Abstract

Importance: While air pollutants at historical levels have been associated with cardiovascular and respiratory diseases, it is not known whether exposure to contemporary air pollutant concentrations is associated with progression of emphysema.

Objective: To assess the longitudinal association of ambient ozone (O3), fine particulate matter (PM2.5), oxides of nitrogen (NOx), and black carbon exposure with change in percent emphysema assessed via computed tomographic (CT) imaging and lung function.

Design, setting, and participants: This cohort study included participants from the Multi-Ethnic Study of Atherosclerosis (MESA) Air and Lung Studies conducted in 6 metropolitan regions of the United States, which included 6814 adults aged 45 to 84 years recruited between July 2000 and August 2002, and an additional 257 participants recruited from February 2005 to May 2007, with follow-up through November 2018.

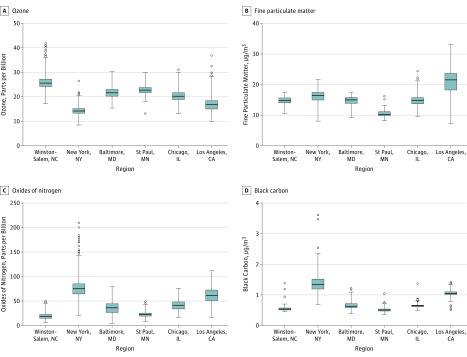
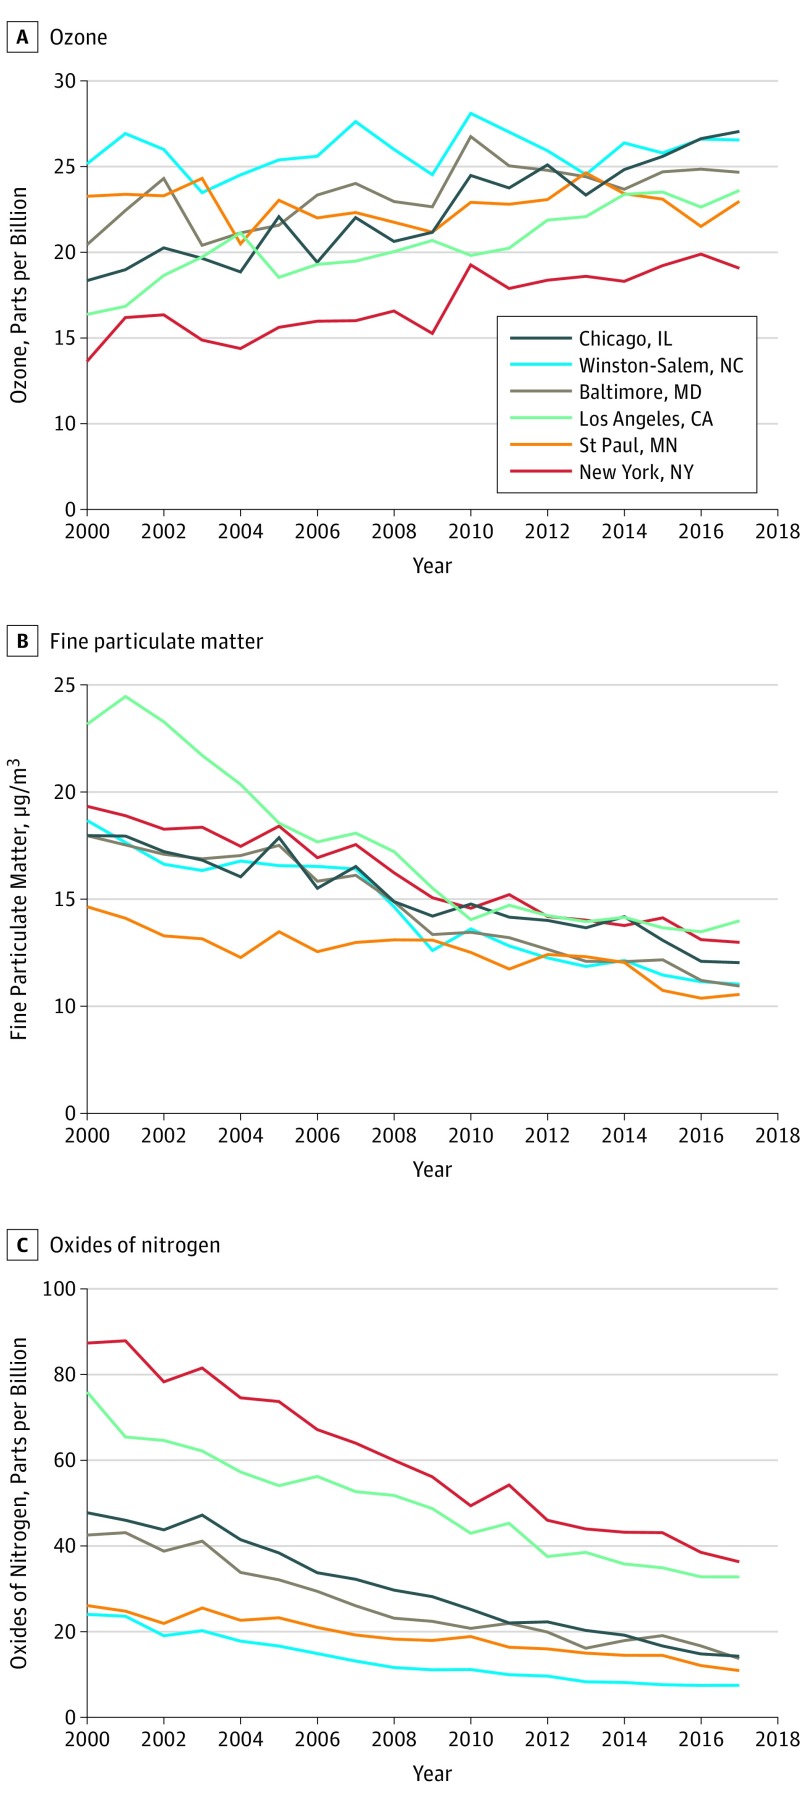
Exposures: Residence-specific air pollutant concentrations (O3, PM2.5, NOx, and black carbon) were estimated by validated spatiotemporal models incorporating cohort-specific monitoring, determined from 1999 through the end of follow-up.

Main outcomes and measures: Percent emphysema, defined as the percent of lung pixels less than -950 Hounsfield units, was assessed up to 5 times per participant via cardiac CT scan (2000-2007) and equivalent regions on lung CT scans (2010-2018). Spirometry was performed up to 3 times per participant (2004-2018).

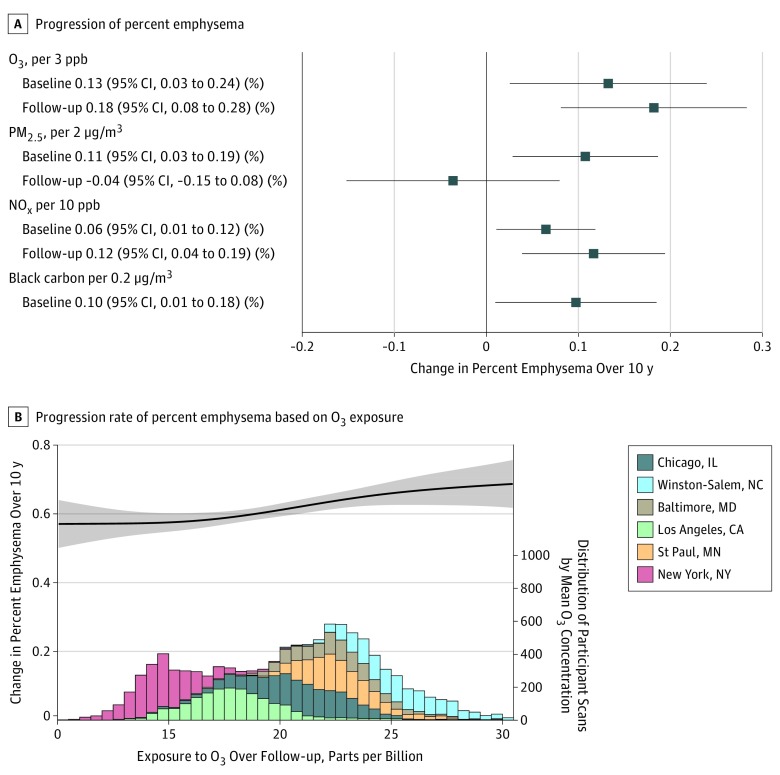
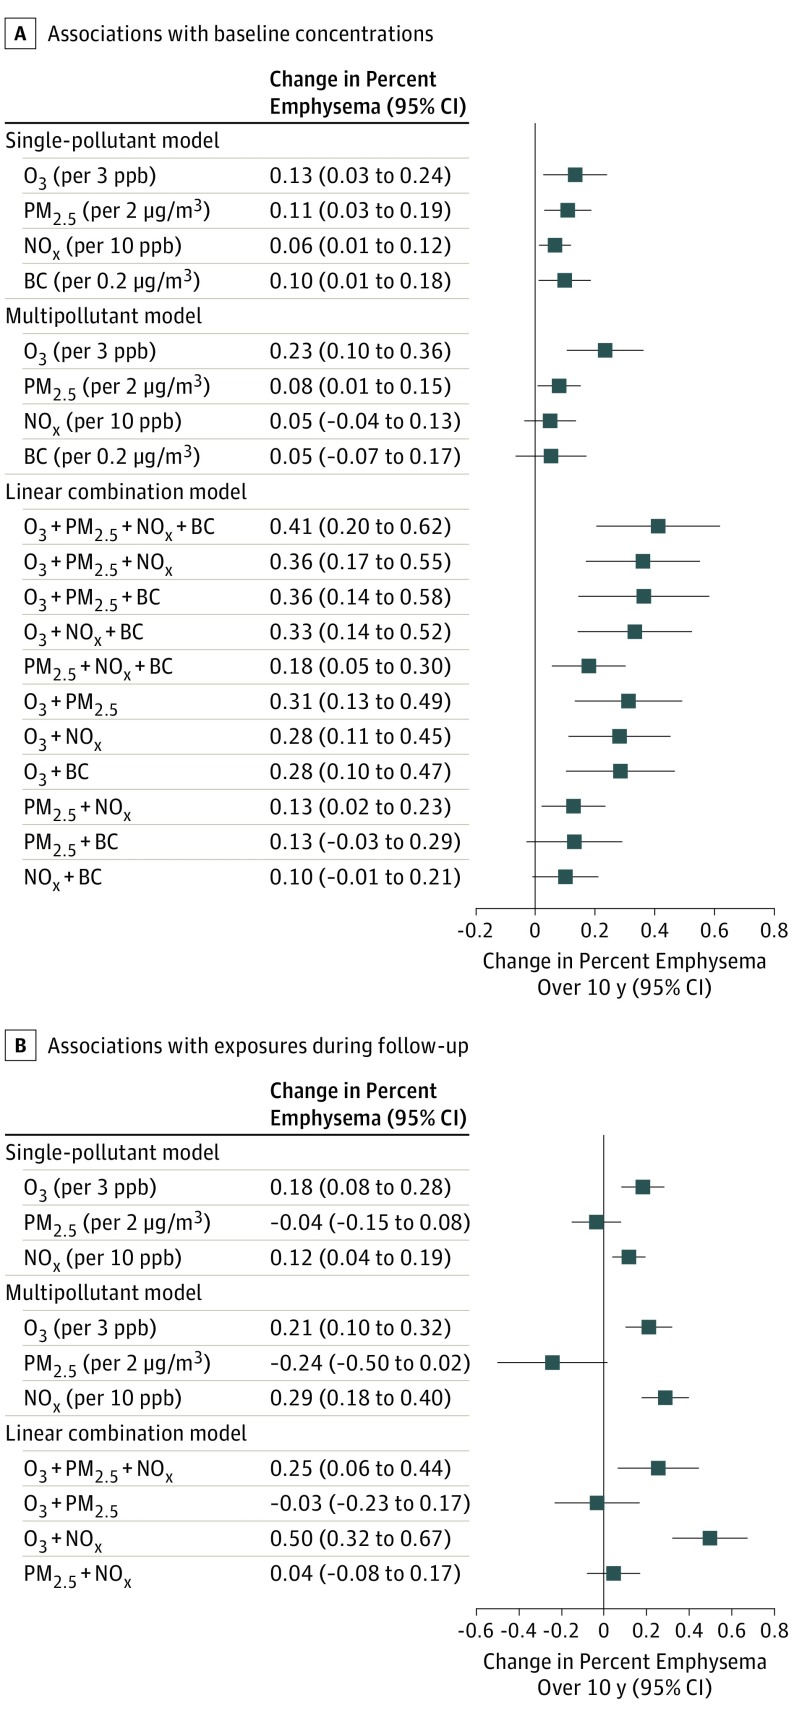
Results: Among 7071 study participants (mean [range] age at recruitment, 60 [45-84] years; 3330 [47.1%] were men), 5780 were assigned outdoor residential air pollution concentrations in the year of their baseline examination and during the follow-up period and had at least 1 follow-up CT scan, and 2772 had at least 1 follow-up spirometric assessment, over a median of 10 years. Median percent emphysema was 3% at baseline and increased a mean of 0.58 percentage points per 10 years. Mean ambient concentrations of PM2.5 and NOx, but not O3, decreased substantially during follow-up. Ambient concentrations of O3, PM2.5, NOx, and black carbon at study baseline were significantly associated with greater increases in percent emphysema per 10 years (O3: 0.13 per 3 parts per billion [95% CI, 0.03-0.24]; PM2.5: 0.11 per 2 μg/m3 [95% CI, 0.03-0.19]; NOx: 0.06 per 10 parts per billion [95% CI, 0.01-0.12]; black carbon: 0.10 per 0.2 μg/m3 [95% CI, 0.01-0.18]). Ambient O3 and NOx concentrations, but not PM2.5 concentrations, during follow-up were also significantly associated with greater increases in percent emphysema. Ambient O3 concentrations, but not other pollutants, at baseline and during follow-up were significantly associated with a greater decline in forced expiratory volume in 1 second per 10 years (baseline: 13.41 mL per 3 parts per billion [95% CI, 0.7-26.1]; follow-up: 18.15 mL per 3 parts per billion [95% CI, 1.59-34.71]).

Conclusions and relevance: In this cohort study conducted between 2000 and 2018 in 6 US metropolitan regions, long-term exposure to ambient air pollutants was significantly associated with increasing emphysema assessed quantitatively using CT imaging and lung function.


Conflict of interest statement

Conflict of Interest Disclosures: Dr Wang reported receiving grants from University of Washington (US EPA RD831697, US EPA RD83479601-01, NIEHS K24ES013195, NIEHS P30ES07033) during the conduct of the study. Dr Aaron reported receiving grants from the National Institutes of Health (NIH) during the conduct of the study, grants from the Stony Wold-Herbert Fund and the Alpha1 Foundation, and personal fees from Lancet Respiratory Medicine outside the submitted work. Dr Madrigano reported receiving grants from National Oceanic and Atmospheric Administration during the conduct of the study and personal fees from the NIH outside the submitted work. Dr Hoffman reported receiving grants from the NIH; is a founder and shareholder of VIDA Diagnostics, a company commercializing lung image analysis software developed, in part, at the University of Iowa; and holds patents for an apparatus for analyzing CT images to determine the presence of pulmonary tissue pathology (US6466687B1), an apparatus for image display and analysis (WO1990016056A1), and a method for multiscale meshing of branching biological structures (US20110093243A1). Dr Yang reported receiving grants from the NIH (NIH R01-HL121270) during the conduct of the study. Dr Sampson reported receiving grants from the EPA (RD831697, RD83479601-01) during the conduct of the study. Dr Sheppard reported receiving grants from the EPA during the conduct of the study and grants from the NIH and personal fees from the Health Effects Institute outside the submitted work. Dr Szpiro reported receiving grants from the EPA and the National Institute of Environmental Health Sciences during the conduct of the study and personal fees from Health Effects Institute and the Electric Power Research Institute outside the submitted work. Dr Smith reported receiving grants from the NIH during the conduct of the study and grants from Quebec Health Research Fund, AstraZeneca, and McGill University Health Center Research Institute outside the submitted work. Dr Lederer reported receiving personal fees from Roche, Sanofi Genzyme, Philips Respironics, Fibrogen, Global Blood Therapeutics, Boehringer-Ingelheim, Veracyte, and Galapagos outside the submitted work; institutional grant support from Fibrogen, Global Blood Therapeutics, and Boehringer-Ingelhim; performing unpaid consulting work for Galecto, Pliant Therapeutics, and Bristol-Myers Squibb; and is now a full-time employee of Regeneron Pharmaceuticals (but was a was a full-time employee of Columbia University during the conduct of the study). Dr Diez-Roux reported receiving grants from the EPA and the NIH during the conduct of the study and Wellcome Trust outside the submitted work. Dr Kaufman reported receiving grants from the EPA and the NIH during the conduct of the study and the US National Institutes for Occupational Safety and Health, the Health Effects Institute, the Kresge Foundation, and the Global Alliance for Clean Cookstoves outside the submitted work. Dr Vedal reported receiving grants from the EPA during the conduct of the study and support for a research chair from AXA Research Fund outside the submitted work. Dr Barr reported receiving grants from the COPD Foundation and the Alpha1 Foundation outside the submitted work and grants from the EPA and NIH during the conduct of the study. No other disclosures were reported.

Figures

Figure 1.
Figure 1.. Distribution of Air Pollution Exposure at Baseline and Over Follow-up Examinations From 2000 to 2018 by Study Area
Boxplots included baseline air pollution concentrations in 2000 or for the years of 2006-2008 (for black carbon) and follow-up air pollution exposures aggregated from the year of the baseline examination to that of the follow-up clinic examination from 2000 to 2018 for each participant at each scan. The boxes indicate the interquartile range (IQR) and the line in the center indicates the median concentration. Whiskers extend to 1.5 times the IQR to the most distant observation within that distance (ie, the largest or smallest observations within quartile 3 + 1.5 × IQR or quartile 1 − 1.5 × IQR). Outlier observations are shown as circles. Exposure data are shown by study areas, which included 1037 participants (2837 scans) in Winston-Salem, NC; 1182 (3227 scans) in New York, NY, and Rockland County, NY; 1054 (2842 scans) in Baltimore, MD; 1021 (2933 scans) in St Paul, MN; 1142 (3396 scans) in Chicago, IL; and 1424 (3339 scans) in the Los Angeles Basin area.
Figure 2.
Figure 2.. Annual Mean Air Pollution Concentrations per Year Based on Location
Metropolitan area temporal trends in air pollution exposures are shown based on annual mean concentrations for all participants in each area from continuous 2-week average concentrations from 2000 through follow-up. The exposure data included 1037 participants in Winston-Salem, NC; 1182 in New York, NY, and Rockland County, NY; 1054 in Baltimore, MD; 1021 in St Paul, MN; 1142 in Chicago, IL; and 1424 in the Los Angeles Basin area.
Figure 3.
Figure 3.. Longitudinal Associations of Exposure to Air Pollution With Progression of Percent Emphysema Over 10 Years in 6860 Participants
A, The linear longitudinal association of baseline exposure to O3, PM2.5, and NOx in 2000 or 2006 to 2008 for black carbon (18 902 scans) and mean follow-up air pollution exposures from the year of the baseline examination to that of the follow-up clinic examination from 2000 to 2018 (18 574 scans) for each scan. Progression of percent emphysema shown via computed tomographic (CT) imaging (percentage of lung pixels less than −950 Hounsfield units) over 10 years shown from linear mixed model. Associations were presented per rounded interquartile range increment of exposure to O3, PM2.5, NOx, and black carbon. Models are adjusted for age, sex, race/ethnicity, height, weight, temperature, smoking status, secondhand smoking, pack-years, cigarettes per day, body mass index, physical activity, income, employment status, education, neighborhood socioeconomic status (SES) index, study region, the interaction between SES and study region, and interactions of these variables with time as well as variables without interactions with time, such as CT scanners, pixel size, and baseline exposure. B, The concentration-response curve with 95% CI for the overall change of percent emphysema (progression rate associated with O3 concentrations over follow-up) with the same model adjustments as in panel A. The curve is based on a mixed model that includes a thin plate regression spline with 4 degrees of freedom to more flexibly assess the potentially nonlinear relationship. The highest and lowest 1% of overall concentrations have been trimmed for visualization because the relationship at the extremes is uncertain and might rely on concentrations from a single region. The histogram shows the distribution of O3 concentration over follow-up in this cohort, with the contribution of each area to the total distribution indicated by color; the height of each bar in the histogram represents the number of scans analyzed in each 0.5 parts per billion (ppb) bin of O3 concentration.
Figure 4.
Figure 4.. Effect Estimates for the Associations Between Air Pollutants and Progression of Percent Emphysema
Associations are presented as rounded interquartile range (IQR) increment of exposure to O3, PM2.5, NOx, and black carbon (BC). A, Results of a single-pollutant model derived from main analyses for the associations between each of the air pollutants and progression of percent emphysema (percentage of lung pixels less than −950 Hounsfield units) are shown. The multipollutant model presents the associations of the fully adjusted model with all measured air pollutants modeled simultaneously. Linear combination models were implemented by combining the associations from any pairs of the air pollutants, based on associations from the multi-pollutant model. A, The associations with baseline air pollution exposure in 2000 or 2006 to 2008 (for black carbon) in 18 902 scans. B, The associations with follow-up air pollution exposures aggregated from the year of the baseline examination to that of the follow-up clinic examination from 2000 to 2018 in 18 574 scans. Details of the exact numbers for the associations from the single-pollutant, multipollutant and linear combination models are shown in eTable 6 in the Supplement.

Comment in

References

    1. Kochanek KD, Murphy SL, Xu JQ, Arias E. Mortality in the United States, 2016. NCHS Data Brief, No. 293. Hyattsville, MD: National Center for Health Statistics; 2017. - PubMed
    1. GBD 2017 Causes of Death Collaborators Global, regional, and national age-sex-specific mortality for 282 causes of death in 195 countries and territories, 1980-2017: a systematic analysis for the Global Burden of Disease Study 2017. Lancet. 2018;392(10159):1736-1788. doi:10.1016/S0140-6736(18)32203-7 - DOI - PMC - PubMed
    1. Vogelmeier CF, Criner GJ, Martinez FJ, et al. . Global Strategy for the Diagnosis, Management, and Prevention of Chronic Obstructive Lung Disease 2017 Report: GOLD Executive Summary. Am J Respir Crit Care Med. 2017;195(5):557-582. doi:10.1164/rccm.201701-0218PP - DOI - PubMed
    1. Oelsner EC, Hoffman EA, Folsom AR, et al. . Association between emphysema-like lung on cardiac computed tomography and mortality in persons without airflow obstruction: a cohort study. Ann Intern Med. 2014;161(12):863-873. doi:10.7326/M13-2570 - DOI - PMC - PubMed
    1. Gevenois PA, De Vuyst P, de Maertelaer V, et al. . Comparison of computed density and microscopic morphometry in pulmonary emphysema. Am J Respir Crit Care Med. 1996;154(1):187-192. doi:10.1164/ajrccm.154.1.8680679 - DOI - PubMed

Publication types

MeSH terms