. 2019 Aug 13;129(11):4922-4936.
doi: 10.1172/JCI123859.

Myocardial infarction triggers cardioprotective antigen-specific T helper cell responses

Affiliations

Myocardial infarction triggers cardioprotective antigen-specific T helper cell responses

Max Rieckmann et al. J Clin Invest. .

Abstract

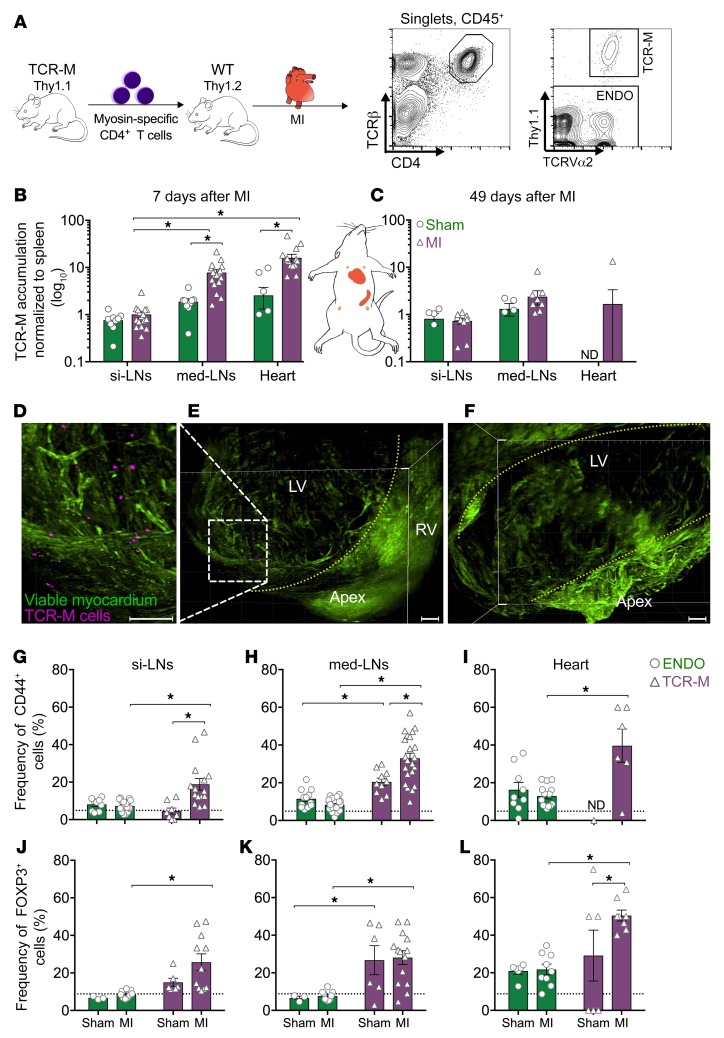
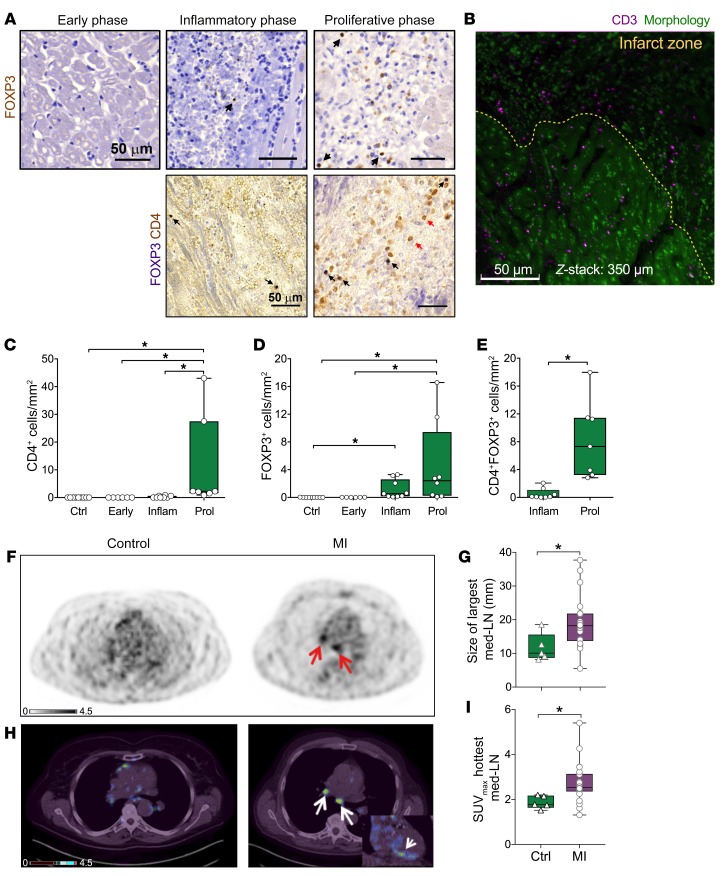
T cell autoreactivity is a hallmark of autoimmune diseases but can also benefit self-maintenance and foster tissue repair. Herein, we investigated whether heart-specific T cells exert salutary or detrimental effects in the context of myocardial infarction (MI), the leading cause of death worldwide. After screening more than 150 class-II-restricted epitopes, we found that myosin heavy chain alpha (MYHCA) was a dominant cardiac antigen triggering post-MI CD4+ T cell activation in mice. Transferred MYHCA614-629-specific CD4+ T (TCR-M) cells selectively accumulated in the myocardium and mediastinal lymph nodes (med-LN) of infarcted mice, acquired a Treg phenotype with a distinct pro-healing gene expression profile, and mediated cardioprotection. Myocardial Treg cells were also detected in autopsies from patients who suffered a MI. Noninvasive PET/CT imaging using a CXCR4 radioligand revealed enlarged med-LNs with increased cellularity in MI-patients. Notably, the med-LN alterations observed in MI patients correlated with the infarct size and cardiac function. Taken together, the results obtained in our study provide evidence showing that MI-context induces pro-healing T cell autoimmunity in mice and confirms the existence of an analogous heart/med-LN/T cell axis in MI patients.

Keywords: Adaptive immunity; Cardiology; Heart failure; Immunology; T cells.


Conflict of interest statement

Conflict of interest: HJW is the founder and a shareholder of Scintomics, which provided the CXCR4 radiotracer.

Figures

Figure 1
Figure 1. Cardiac epitope mapping.
(A) Heatmaps depicting the number of specific T cell responses to defined antigens of interest. Splenocytes purified from MI or sham-operated mice (day 7) were cultured in the presence of peptide pools (15 mers, MHC-II–restricted) covering the most important heart-enriched proteins, and the production of IL-2 and IFN-γ was monitored by ELISPOT as a readout for antigen-specific stimulation. The single peptides MYHCA614–628 (included in the MYHCA pool) and OVA323–339 (irrelevant antigen, not expressed in the heart) were also tested. (B and C) Quantification of IL-2–producing cells per well in response to (B) the MYHCA peptide pool and (C) MYHCA614–628. (D and E) Representative ELISPOT images of these antigens. The number of responder cells found in each well is shown directly next to the representative images. The bar graphs display the group mean values, the SEM, and the distribution of each individual value. Statistical analysis was determined with a 2-tailed, unpaired t test (B and C). *P < 0.05. The data were acquired from 3 independent experiments.
Figure 2
Figure 2. TCR-M cells selectively accumulate in the infarcted heart.
(A) Experimental design and gating strategy. Thy1.1 TCR-M cells were transferred into Thy1.2 WT recipients prior to MI or sham operations. The contour plots are representative of the med-LNs 7 days after MI. The frequencies of TCR-M cells found in the si-LNs, med-LNs (heart-draining), and heart were assessed on (B) day 7 and (C) day 49 after MI. The accumulation index refers to the spleen-normalized frequencies. (D and F) 3D reconstruction of infarcted hearts (original magnification, ×5) on day 7 (D and E) and day 49 (F) after MI. The morphological information was obtained from the autofluorescence levels acquired in the green channel. The viable myocardium appears in bright green, and the necrotic myocardium appears in dark green. Scale bars: 300 μm. TCR-M cells (Thy1.1+) appear in magenta, and the yellow dotted lines indicate the infarct borders. (GL) Frequency of CD44+ cells (GI) and FOXP3+ cells (JL) in the ENDO and TCR-M compartments harvested from different sites on day 7 after MI. The dotted lines indicate the baseline frequencies (pre-transfer) of CD44+ and FOXP3+ among TCR-M cells. The graphs display the group mean values (bars), the SEM, and the distribution of each individual value. (B and C) The green and magenta bars represent sham-operated and infarcted mice, respectively. (GL) The green and magenta bars represent endogenous CD4+ T cells and TCR-M cells, respectively. The data were acquired in at least 2 independent experiments; MI (n = 7–23 mice) and sham (n = 3–12 mice). *P < 0.05, by 2-way ANOVA followed by Sidak’s multiple comparisons test. LV, left ventricle; RV, right ventricle; ND, not determined.
Figure 3
Figure 3. In vivo TCR-M conversion to FOXP3+ Tregs.
(A) Experimental design and gating strategy. Before adoptive transfer, Thy1.1+ TCR-M cells were enriched for Tconv cells (CD25) and Tregs (CD25+) through magnetic cell sorting and labeled with distinct, subset-specific cell-tracer dyes (CFSE and VIO, respectively). Treg and Tconv TCR-M cell populations were mixed at a 1:20 ratio (resembling the physiological condition) and then transferred into Thy1.2 WT recipients 1 day before MI or sham operation. The flow cytometric plots depict the pre-transfer levels of FOXP3 in each compartment. (B) Analysis of Treg conversion from TCR-M cells in si-LNs, med-LNs, and heart tissues from mice 5 days after MI. Converted Tregs are defined as Thy1.1+CFSE+ cells that acquired FOXP3 expression after MI, as the CFSE+ cells were FOXP3 prior to cell transfer. (C and D) Proliferation of Tconv TCR-M cells (Thy1.1+CFSE+FOXP3) and Treg TCR-M cells (Thy1.1+VIO+FOXP3+) was assessed through the dilution of CFSE and VIO dyes, respectively. Histograms show the dilution of intracellular fluorescent tracers (CFSE or VIO), indicating the frequency of proliferating cells in each compartment analyzed. **P < 0.01, by 2-way ANOVA followed by Tukey’s multiple comparisons test (B); *P < 0.05 and P = 0.06, by 2-tailed, unpaired t test (C and D).
Figure 4
Figure 4. TCR-M cells activated in the MI context acquire a nonclassical gene expression signature enriched with prohealing factors.
Adoptively transferred TCR-M cells (defined as CD4+TCRβ+Thy1.1+TCVα2+ singlets) and polyclonal endogenous CD4+ ENDO cells (defined as CD4+TCRβ+Thy1.1 singlets) were sorted from the med-LNs of infarcted and sham-operated mice 7 days after MI and used for downstream gene expression profiling. (A) Volcano plots comparing the gene expression levels of ENDO and TCR-M cells after MI or sham operation. The repressed and induced genes (±2-fold change, P < 0.05) are highlighted in green and purple, respectively. (B) Total number of up- and downregulated genes in each T cell subset. (C) Top 30 differentially expressed genes (MI vs. sham, P < 0.05) in each T cell subset. (D) Unsupervised pathway enrichment analyses and gene clustering according to molecular function (TCR-M subset). The bar lengths indicate the adjusted P values (Fisher’s exact test). (E) Normalized relative expression levels (MI vs. sham) of specific gene sets related to T cell activation (checkpoint receptors), tissue repair, and purinergic metabolism. The color scale represents the normalized gene expression levels (MI vs. sham) in ENDO and TCR-M cells. Data for MI (n = 5) and sham (n = 3) were acquired from 1 experiment.
Figure 5
Figure 5. Heart-specific CD4+ T cells activated in the MI context exert cardioprotective effects.
(A) Experimental design: TCR-M cells (specific for the cardiac antigen MYCA614–629) and DO11.10 cells (specific for the irrelevant antigen OVA323–339) were adoptively transferred into DO11.10 mice prior to MI or sham operation, and the cardiac outcomes were monitored at the peak of the healing phase (day 7). (B) The infarct size and long parasternal axis (apex-aortic valve) were assessed by echocardiography. The (C) FAC, (D) ESA, and (E) EDA at the mid-papillary level were assessed by echocardiography. (F) Cardiac macrophages, defined as CD45+CD11b+Ly6GCD64+ singlets, were stratified into 4 major subsets according to CCR2 and MHC-II expression, and the effects in DO11.10 versus TCR-M cells on each subset’s distribution were assessed (day 5). (G) The collagen area in scar tissue 5 days after MI in DO11.10- and TCR-M–transferred mice was quantified by Picrosirius red staining (PSR). (H) Immunofluorescence of collagen III and its quantification in scar tissue 5 days after MI in DO11.10- and TCR-M–transferred mice. Scale bars: 100 μM. The bar graphs display the group mean values (bars), the SEM, and the distribution of each individual sample. Statistical significance was determined by 2-tailed, unpaired t test. *P < 0.05 and **P < 0.01. The data from TCR-M (n = 5–10) and DO11.10 (n = 7–9) recipients were acquired in 3 experiments.
Figure 6
Figure 6. CD4+ T cells infiltrating the murine infarcted myocardium are clonally expanded and exhibit a unique repertoire signature.
(A) Th cells from the heart and med-LNs of infarcted and sham-operated mice (day 7) were purified by FACS. (B) Tree maps of representative repertoires from each group. Each spot represents a unique TRBV-CDR3 recombination, and the size of each spot denotes its relative frequency. The unevenness of the spots indicates clonal expansions. (C) Repertoire evenness was assessed by the Gini coefficient. (D) Repertoire diversity was assessed on the basis of 1-Simpson’s diversity index. (E) Heatmap depicting the TRBV gene usage in each group. The asterisks at the top of the graph indicate a statistically significant difference (P < 0.05) between the cardiac and LN repertoires, as determined by 2-way ANOVA followed by Tukey’s multiple comparisons test. (F) Correlation among the frequencies of the TRBV gene segment between any 2 given samples. (G) Heatmap showing the degree of TRBV CDR3 sequence sharing (Jaccard index) between any 2 given samples. The bar graphs in C and D display the group mean values (bars), the SEM of 3 to 4 samples per group, and the distribution of each individual value. Statistical significance for C and D was determined by 1-way ANOVA followed by Dunnett’s multiple comparisons test. *P < 0.05 compared with all the other groups.
Figure 7
Figure 7. A heart/T cell axis in MI patients.
(AE) Histological analyses of cardiac autopsy samples revealed that Th cells also accumulated in the human infarcted myocardium, particularly during the proliferative (wound-healing) phase. (A) Representative IHC micrographs show the presence of FOXP3+ (black arrows) and CD4+ (red arrows) cells in cardiac tissues. Scale bars: 50 μm. (B) LSFM showing the presence of CD3+ T cells in the infarcted human myocardium. Z-stack: 350 μm. (CE) Numbers of CD4+, FOXP3+, and CD4+FOXP3+ cells/mm2 in each phase after MI (early, inflammatory, proliferative). The whiskers represent the percentile range, with the medians ± CIs from 6 to 9 samples per group. *P < 0.05, by nonparametric Kruskal-Wallis test corrected for multiple comparisons using Dunn’s test. (FH) Transaxial slices of (F) PET and (H) fused PET/CT showing increased CXCR4 expression in med-LNs after MI (arrows) and in the infarcted myocardium (inset). Both the (G) med-LN sizes and (I) CXCR4 expression (as assessed by SUVs) were found to be increased after MI. The data are presented as box plots showing the medians, 25th–75th percentiles (boxes), and 5th–95th percentiles (whiskers) of 6 to 9 cardiac autopsy samples, or 26 patients (PET/CT) per group. *P < 0.05, by Fisher’s exact test (CE) and Welch’s t test (G and I).

Comment in

References

    1. Amit U, et al. New role for interleukin-13 receptor α1 in myocardial homeostasis and heart failure. J Am Heart Assoc. 2017;6(5):e005108. - PMC - PubMed
    1. Monnerat G, et al. Macrophage-dependent IL-1β production induces cardiac arrhythmias in diabetic mice. Nat Commun. 2016;7:13344. - PMC - PubMed
    1. Hulsmans M, et al. Macrophages facilitate electrical conduction in the heart. Cell. 2017;169(3):510–522.e20. doi: 10.1016/j.cell.2017.03.050. - DOI - PMC - PubMed
    1. Ramos GC, et al. Myocardial aging as a T-cell-mediated phenomenon. Proc Natl Acad Sci U S A. 2017;114(12):E2420–E2429. doi: 10.1073/pnas.1621047114. - DOI - PMC - PubMed
    1. Hofmann U, Frantz S. Role of lymphocytes in myocardial injury, healing, and remodeling after myocardial infarction. Circ Res. 2015;116(2):354–367. doi: 10.1161/CIRCRESAHA.116.304072. - DOI - PubMed

Publication types

MeSH terms