

Post-acquisition processing confounds in brain volumetric quantification of white matter hyperintensities
- PMID: 31408649
- PMCID: PMC6746343
- DOI: 10.1016/j.jneumeth.2019.108391
Post-acquisition processing confounds in brain volumetric quantification of white matter hyperintensities
Abstract
Background: Disparate research sites using identical or near-identical magnetic resonance imaging (MRI) acquisition techniques often produce results that demonstrate significant variability regarding volumetric quantification of white matter hyperintensities (WMH) in the aging population. The sources of such variability have not previously been fully explored.
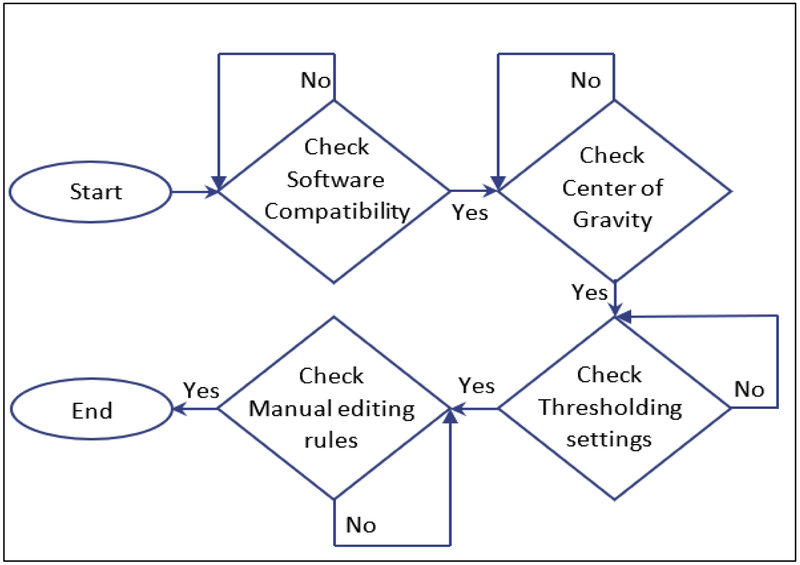
New method: 3D FLAIR sequences from a group of randomly selected aged subjects were analyzed to identify sources-of-variability in post-acquisition processing that can be problematic when comparing WMH volumetric data across disparate sites. The methods developed focused on standardizing post-acquisition protocol processing methods to develop a protocol with less than 0.5% inter-rater variance.
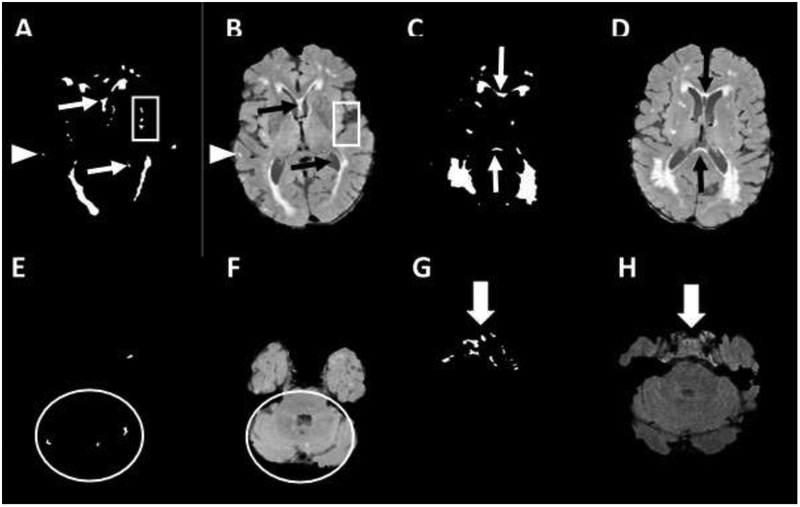
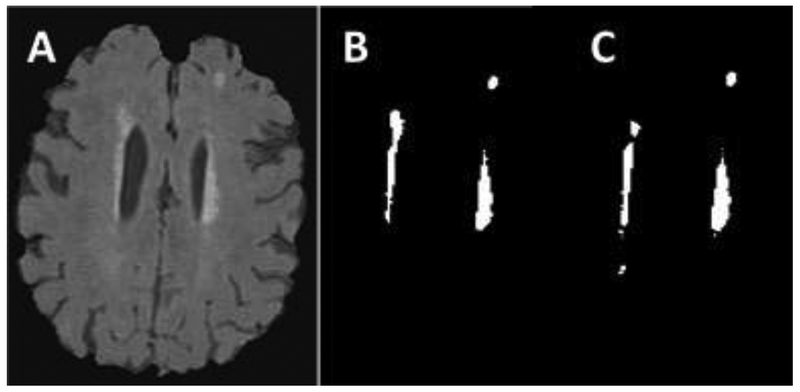
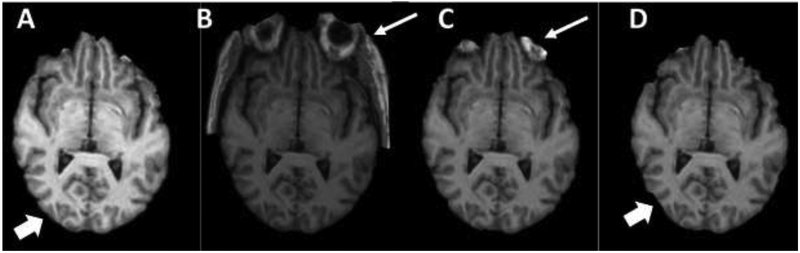
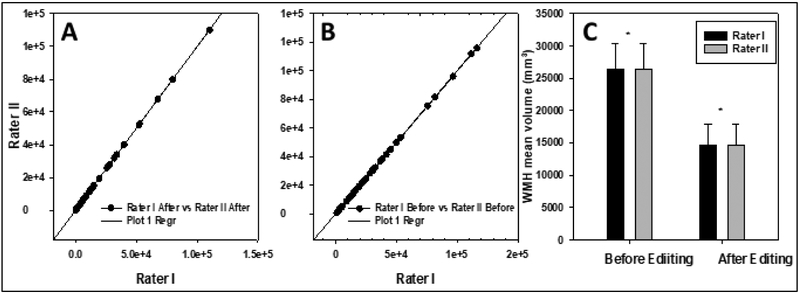
Results: A series of experiments using standard MRI acquisition sequences explored post-acquisition sources-of-variability in the quantification of WMH volumetric data. Sources-of-variability included: the choice of image center, software suite and version, thresholding selection, and manual editing procedures (when used). Controlling for the identified sources-of-variability led to a protocol with less than 0.5% variability between independent raters in post-acquisition WMH volumetric quantification.
Comparison with existing method(s): Post-acquisition processing techniques can introduce an average variance approaching 15% in WMH volume quantification despite identical scan acquisitions. Understanding and controlling for such sources-of-variability can reduce post-acquisition quantitative image processing variance to less than 0.5%.
Discussion: Considerations of potential sources-of-variability in MRI volume quantification techniques and reduction in such variability is imperative to allow for reliable cross-site and cross-study comparisons.
Keywords: Cerebrovascular disease; Sources of variability; Volumetric analysis; White matter hyperintensity.
Copyright © 2019 Elsevier B.V. All rights reserved.
Figures
References
-
- Bahrani AA, Powell DK, Yu G, Johnson ES, Jicha GA, & Smith CD (2017). White Matter Hyperintensity Associations with Cerebral Blood Flow in Elderly Subjects Stratified by Cerebrovascular Risk. J Stroke Cerebrovasc Dis, 26(4), 779–786. doi: 10.1016/j.jstrokecerebrovasdis.2016.10.017 - DOI - PMC - PubMed
Publication types
MeSH terms
Grants and funding
LinkOut - more resources
Full Text Sources
