. 2019 Aug 12;8(8):282.
doi: 10.3390/plants8080282.

Transient Heat Waves May Affect the Photosynthetic Capacity of Susceptible Wheat Genotypes Due to Insufficient Photosystem I Photoprotection

Affiliations

Transient Heat Waves May Affect the Photosynthetic Capacity of Susceptible Wheat Genotypes Due to Insufficient Photosystem I Photoprotection

Erik Chovancek et al. Plants (Basel). .

Abstract

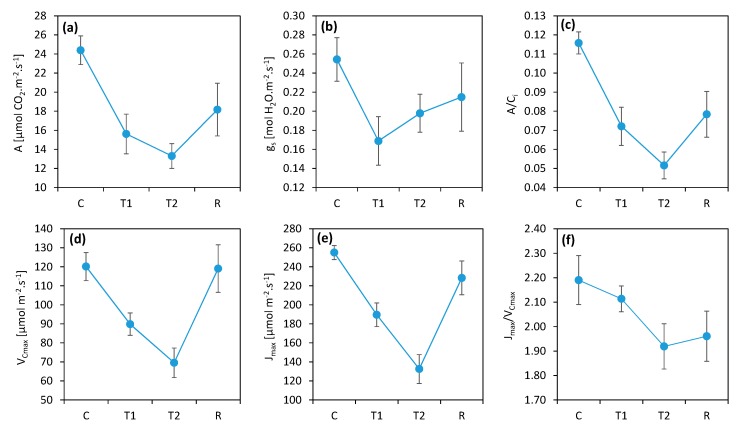
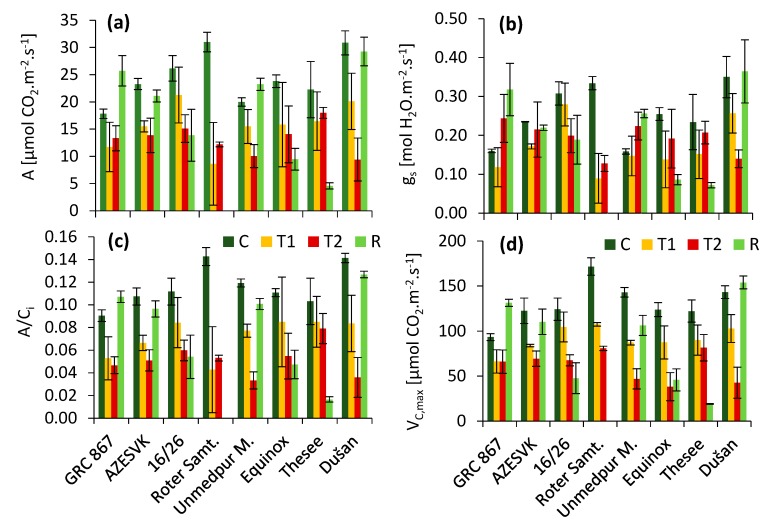
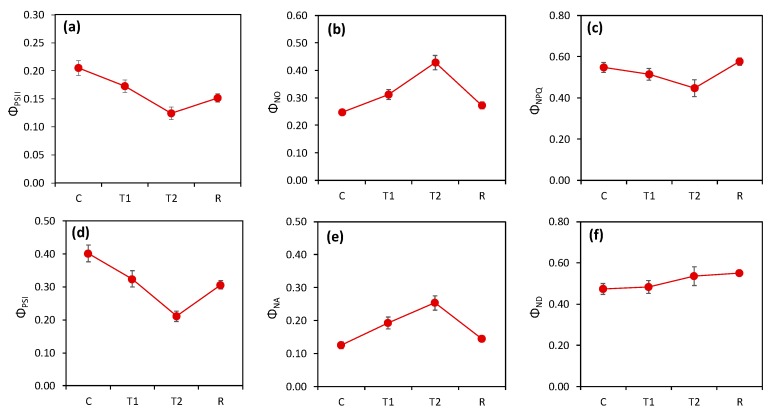
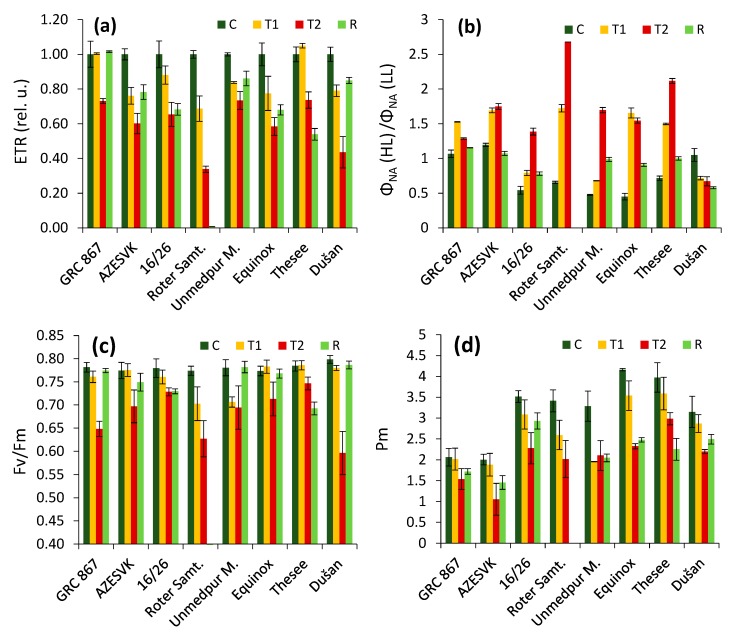
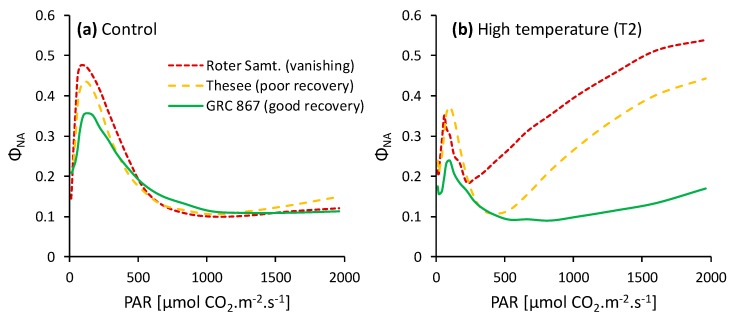
We assessed the photosynthetic responses of eight wheat varieties in conditions of a simulated heat wave in a transparent plastic tunnel for one week. We found that high temperatures (up to 38 °C at midday and above 20 °C at night) had a negative effect on the photosynthetic functions of the plants and provided differentiation of genotypes through sensitivity to heat. Measurements of gas exchange showed that the simulated heat wave led to a 40% decrease in photosynthetic activity on average in comparison to the control, with an unequal recovery of individual genotypes after a release from stress. Our results indicate that the ability to recover after heat stress was associated with an efficient regulation of linear electron transport and the prevention of over-reduction in the acceptor side of photosystem I.

Keywords: heat stress; high temperatures; photoinhibition; photoprotection; photosynthesis; photosystem I; wheat.


Conflict of interest statement

The authors declare no conflicts of interest.

Figures

Figure 1
Figure 1
Heat effects on the parameters derived from the gas exchange measurements (a) A: photosynthesis rate; (b) gs: stomatal conductance; (c) Ci: internal CO2 concentration; (d) VCmax: maximum carboxylation rate; (e) Jmax: maximum electron transport velocity; (f) Jmax/VCmax ratio. C: control; T1: thermal effect in the first phase; T2: thermal effect in the second phase; R: recovery phase. The points represent the mean values for all measured wheat plants of all genotypes. The error bars represent the standard error of the means.
Figure 2
Figure 2
Heat effect on parameters measured by Li-6400 (a) A, photosynthesis rate; (b) gs, stomatal conductance; (c) A/Ci, photosynthetic rate per unit of internal CO2 concentration; (d) VCmax, maximum rate of carboxylation based on analyses of A/Ci curves; C, control; T1, thermal effect in the first phase; T2, thermal effect in the second phase; R, recovery phase. Mean values ± SE are presented.
Figure 3
Figure 3
Heat effect on parameters measured by Dual-PAM (the average from all varieties): C, control; T1, thermal effect in the first phase; T2, thermal effect in the second phase; R, recovery phase. (a) The effective quantum yield of photosystem II (PSII) (ФPSII); (b) the fraction of energy captured by PSII passively dissipated in the form of heat and fluorescence (ФNO); (c) the quantum yield of regulated nonphotochemical quenching in PSII (ФNPQ); (d) the effective quantum yield of PSI (ФPSI); (e) the quantum yield of PSI nonphotochemical quenching caused by the acceptor side limitation, i.e., the fraction of overall P700 that could not be oxidized in a given state (ФNA); (f) the quantum yield of PSI nonphotochemical quenching caused by the donor side limitation, i.e., the fraction of overall P700 that was oxidized in a given state (ФND). The points represent the mean values for all measured wheat plants of all genotypes. The error bars represent the standard error of the means.
Figure 4
Figure 4
Effects of heat stress on parameters measured by Dual-PAM in different varieties: C, control; T1, thermal effect in the first phase; T2, thermal effect in the second phase; R, recovery phase. (a) The relative values of the electron transport rate (the average value of the control plants of each genotype equals 1). (b) The ratio of the acceptor side limitation measured in high light (HL, ~2000 µmol m−2 s−1) and the value measured in low light (LL, ~40 µmol m−2 s−1). (c) Maximum quantum efficiency of PSII photochemistry. (d) The maximum amplitude of P700 kinetics. Average values ± SE are presented.
Figure 5
Figure 5
Examples of the light response curves of the PSI acceptor side limitation parameter (ΦNA) measured in control plants (a) and in plants exposed to the heat wave (b) of three genotypes differing in their capacity to recover after the withdrawal of heat stress.

References

    1. Pachauri R.K., Meyer L.A., editors. Climate Change 2014: Synthesis Report. IPCC; Geneva, Switzerland: 2014. Intergovernmental Panel on Climate Change.
    1. Duan H., Wu J., Huang G., Zhou S., Liu W., Liao Y., Yang X., Xiao Z., Fan H. Individual and interactive effects of drought and heat on leaf physiology of seedlings in an economically important crop. AoB Plants. 2017;9:plw090. doi: 10.1093/aobpla/plw090. - DOI - PMC - PubMed
    1. Nuttall J.G., Barlow K.M., Delahunty A.J., Christy B.P., O’Leary G.J. Acute high temperature response in wheat. Agron. J. 2018;110:1296–1308. doi: 10.2134/agronj2017.07.0392. - DOI
    1. FAOSTAT Production of Wheat in World. [(accessed on 23 February 2019)]; Available online: http://www.fao.org/faostat/en/#data/QC/visualize.
    1. Slafer G.A., Savin R., Sadras V.O. Coarse and fine regulation of wheat yield components in response to genotype and environment. Field Crops Res. 2014;157:71–83. doi: 10.1016/j.fcr.2013.12.004. - DOI

LinkOut - more resources