

Dynamic Chromatin Targeting of BRD4 Stimulates Cardiac Fibroblast Activation
- PMID: 31409188
- PMCID: PMC7310347
- DOI: 10.1161/CIRCRESAHA.119.315125
Dynamic Chromatin Targeting of BRD4 Stimulates Cardiac Fibroblast Activation
Abstract
Rationale: Small molecule inhibitors of the acetyl-histone binding protein BRD4 have been shown to block cardiac fibrosis in preclinical models of heart failure (HF). However, since the inhibitors target BRD4 ubiquitously, it is unclear whether this chromatin reader protein functions in cell type-specific manner to control pathological myocardial fibrosis. Furthermore, the molecular mechanisms by which BRD4 stimulates the transcriptional program for cardiac fibrosis remain unknown.
Objective: We sought to test the hypothesis that BRD4 functions in a cell-autonomous and signal-responsive manner to control activation of cardiac fibroblasts, which are the major extracellular matrix-producing cells of the heart.
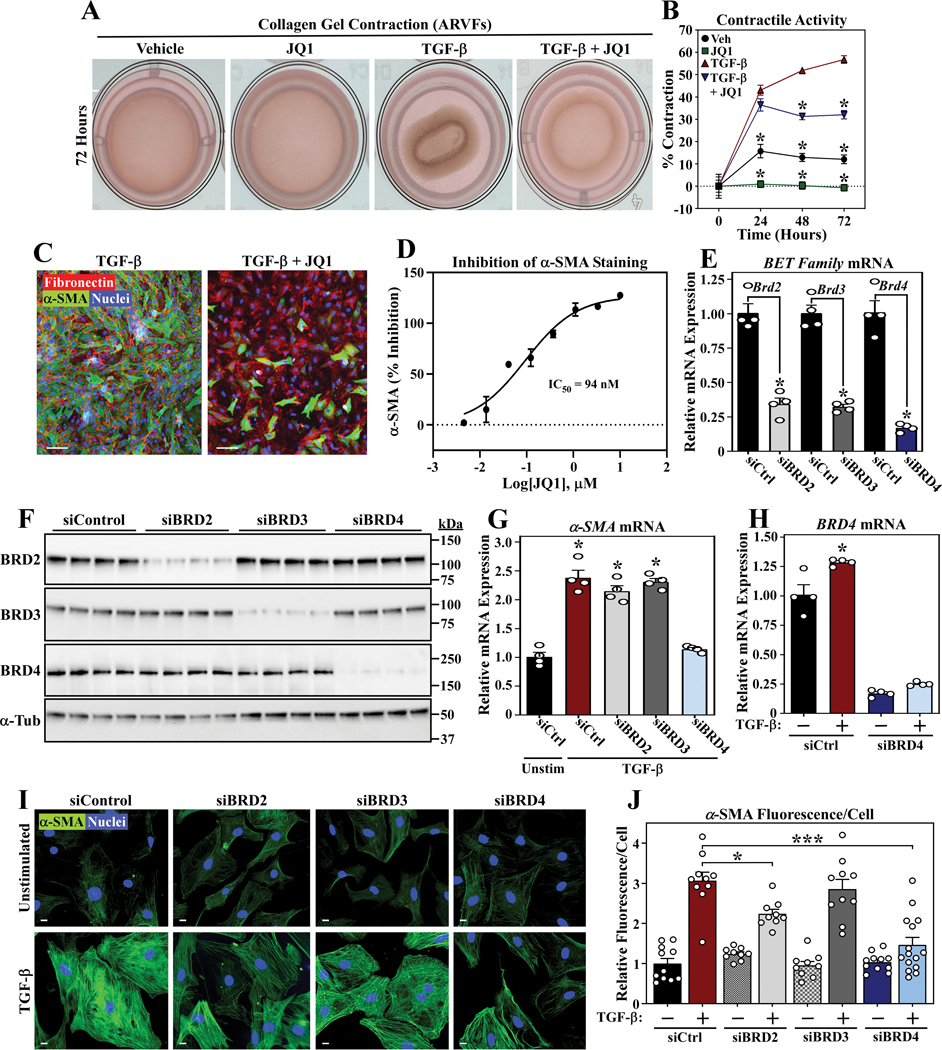
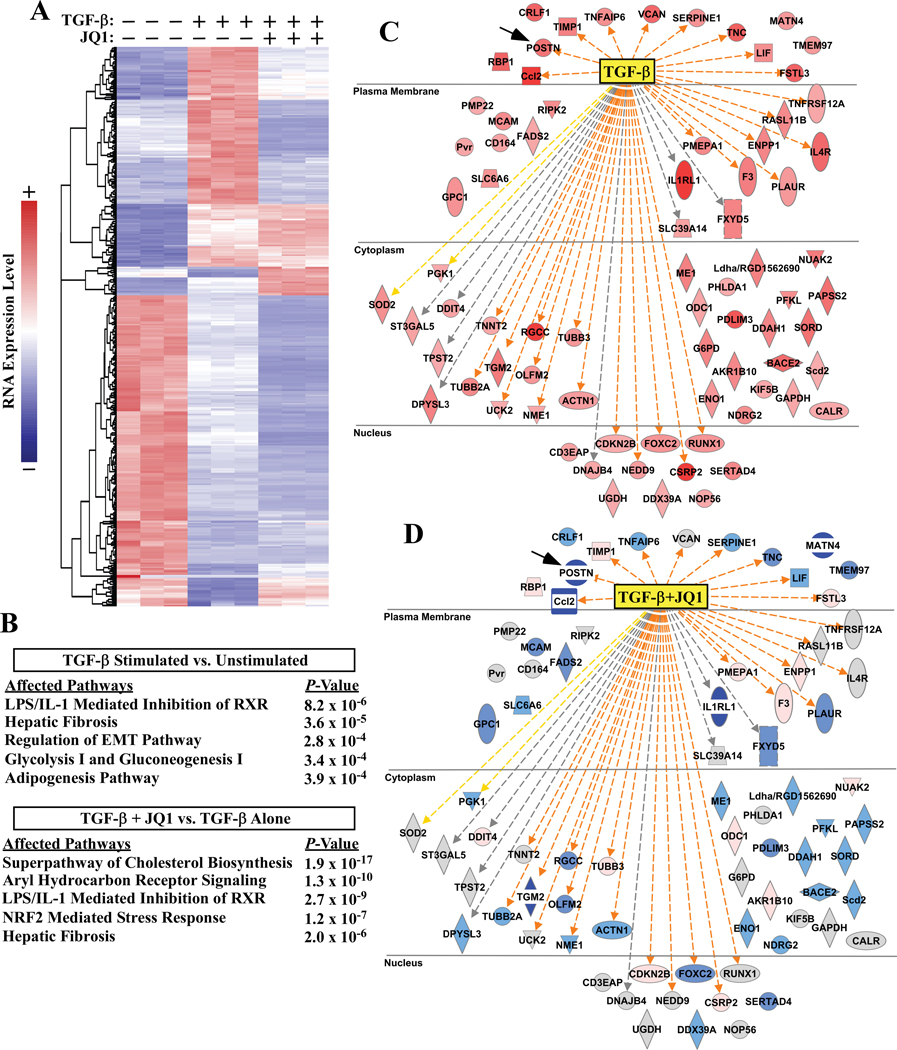
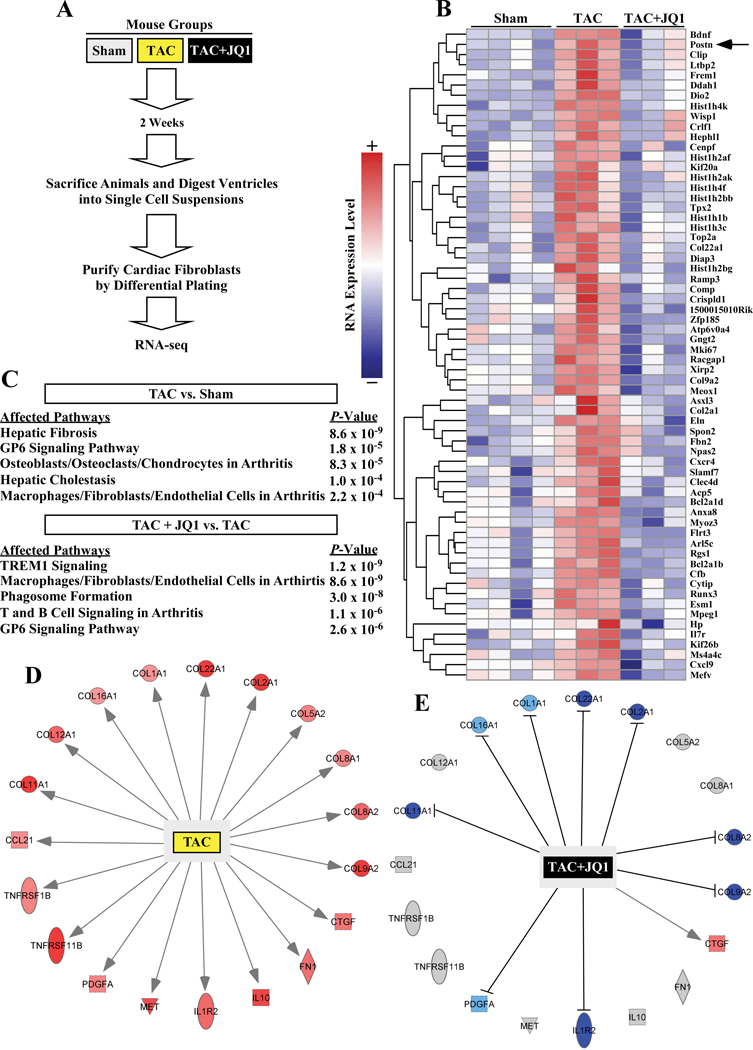
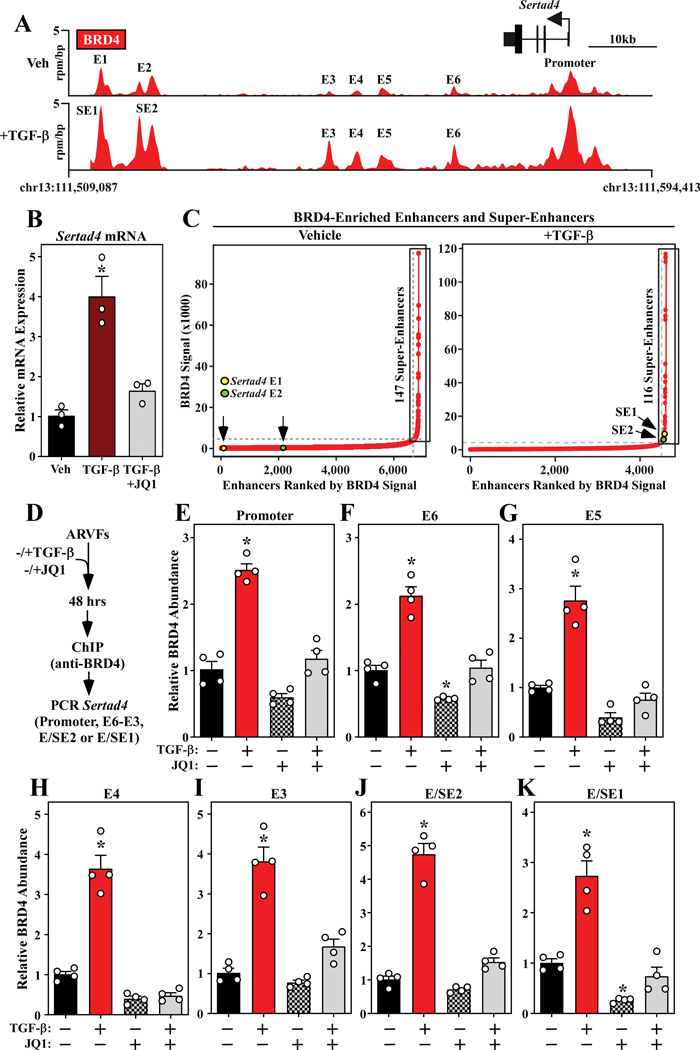
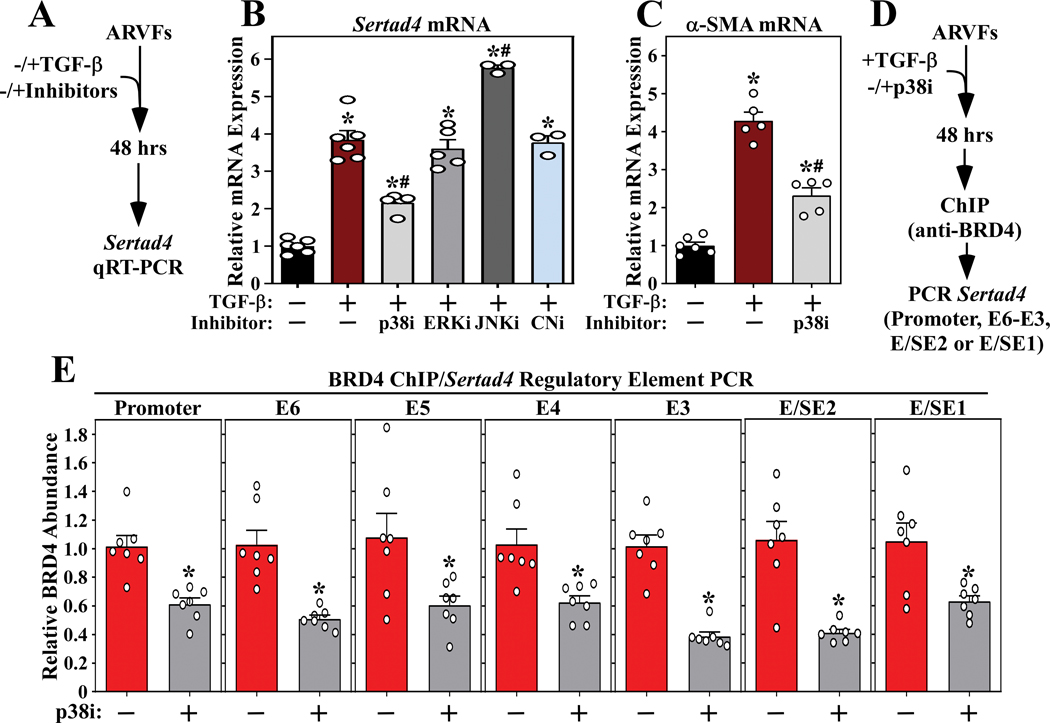
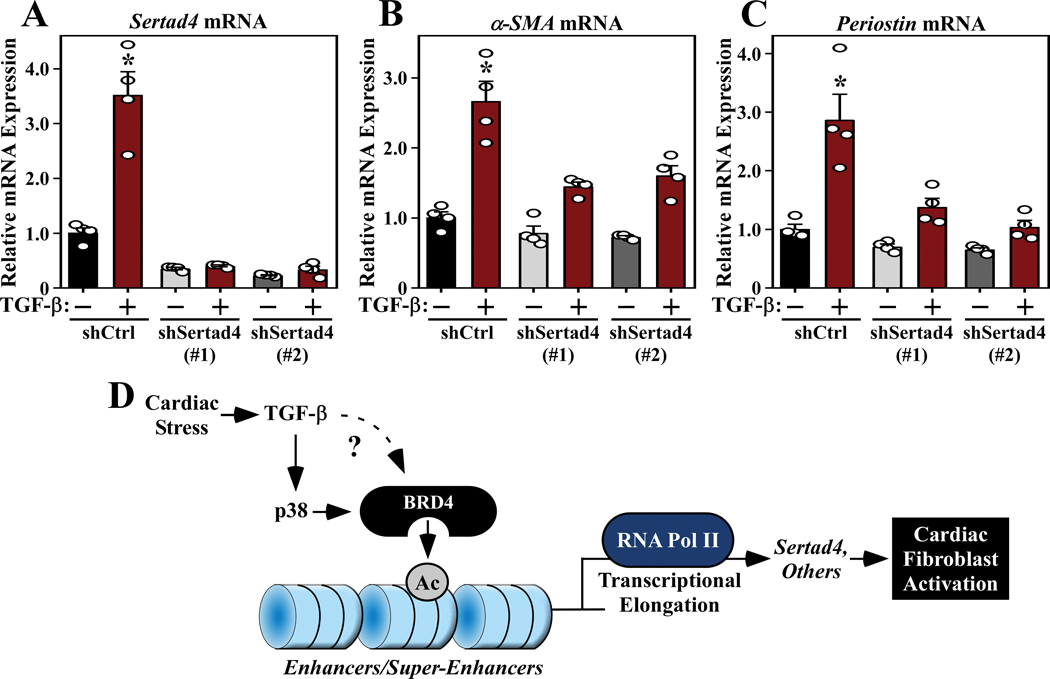
Methods and results: RNA-sequencing, mass spectrometry, and cell-based assays employing primary adult rat ventricular fibroblasts demonstrated that BRD4 functions as an effector of TGF-β (transforming growth factor-β) signaling to stimulate conversion of quiescent cardiac fibroblasts into Periostin (Postn)-positive cells that express high levels of extracellular matrix. These findings were confirmed in vivo through whole-transcriptome analysis of cardiac fibroblasts from mice subjected to transverse aortic constriction and treated with the small molecule BRD4 inhibitor, JQ1. Chromatin immunoprecipitation-sequencing revealed that BRD4 undergoes stimulus-dependent, genome-wide redistribution in cardiac fibroblasts, becoming enriched on a subset of enhancers and super-enhancers, and leading to RNA polymerase II activation and expression of downstream target genes. Employing the Sertad4 (SERTA domain-containing protein 4) locus as a prototype, we demonstrate that dynamic chromatin targeting of BRD4 is controlled, in part, by p38 MAPK (mitogen-activated protein kinase) and provide evidence of a critical function for Sertad4 in TGF-β-mediated cardiac fibroblast activation.
Conclusions: These findings define BRD4 as a central regulator of the pro-fibrotic cardiac fibroblast phenotype, establish a p38-dependent signaling circuit for epigenetic reprogramming in heart failure, and uncover a novel role for Sertad4. The work provides a mechanistic foundation for the development of BRD4 inhibitors as targeted anti-fibrotic therapies for the heart.
Keywords: chromatin; fibroblast; heart failure; mass spectrometry; phenotype; signaling.
Figures
 =cytokine,
  =enzyme,
  =G-protein couple receptor,
 =kinase,
 =peptidase,
  =transcription regulator,
  =transporter,
  =transmembrane receptor,
  =other.
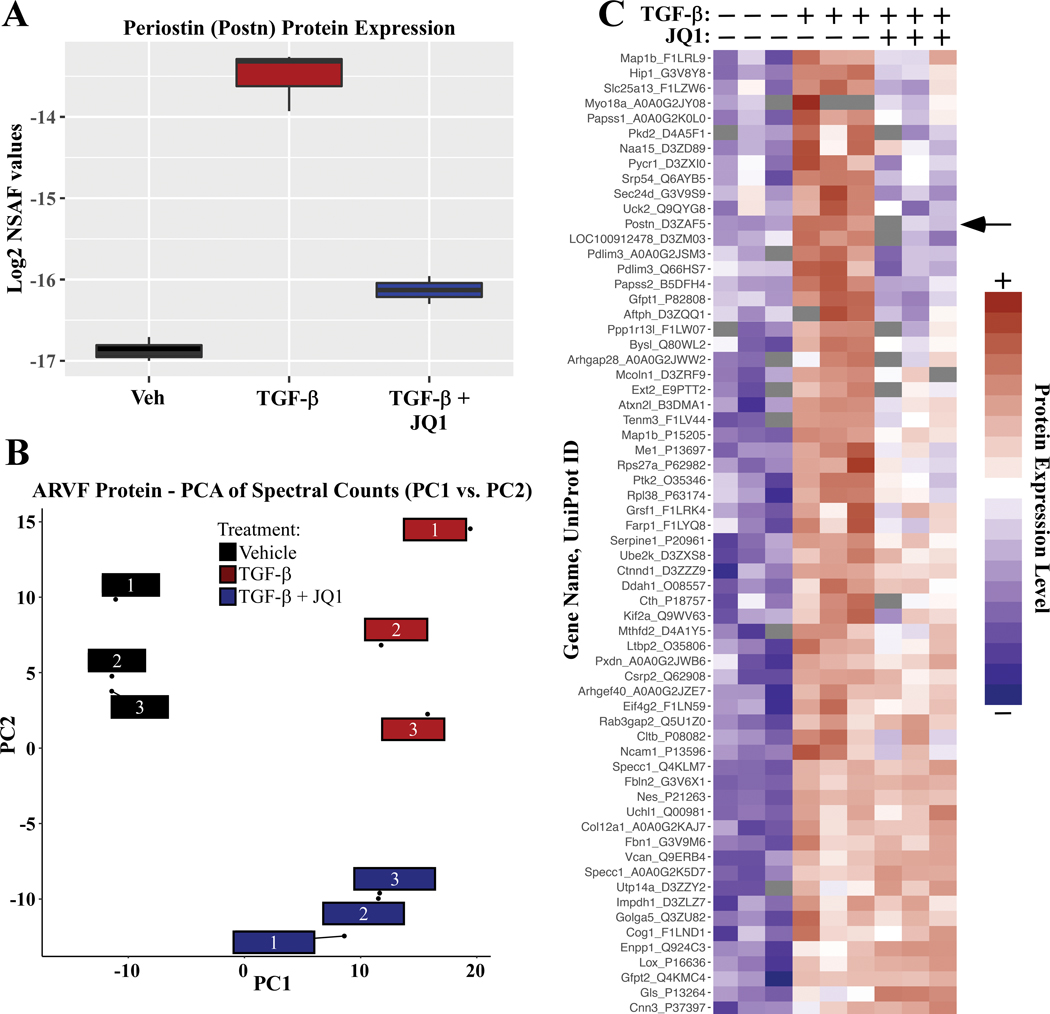
 =cytokine,
  =enzyme,
  =kinase,
  =transmembrane receptor,
  =other).
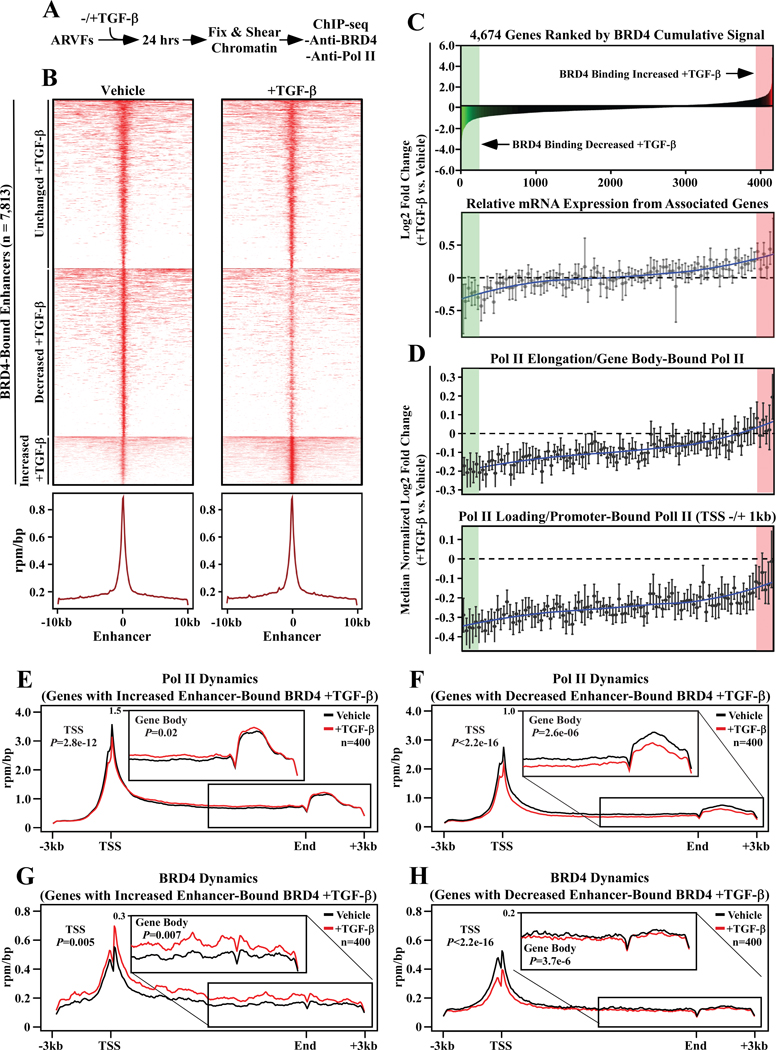
References
-
- Diez J, Querejeta R, Lopez B, Gonzalez A, Larman M and Martinez Ubago JL. Losartan-dependent regression of myocardial fibrosis is associated with reduction of left ventricular chamber stiffness in hypertensive patients. Circulation. 2002;105:2512–7. - PubMed
Publication types
MeSH terms
Substances
Grants and funding
LinkOut - more resources
Full Text Sources
Other Literature Sources
Medical
Molecular Biology Databases
Research Materials
Miscellaneous
