. 2019 Aug 30;16(157):20190360.
doi: 10.1098/rsif.2019.0360. Epub 2019 Aug 14.

Connecting empirical phenomena and theoretical models of biological coordination across scales

Affiliations

Connecting empirical phenomena and theoretical models of biological coordination across scales

Mengsen Zhang et al. J R Soc Interface. .

Abstract

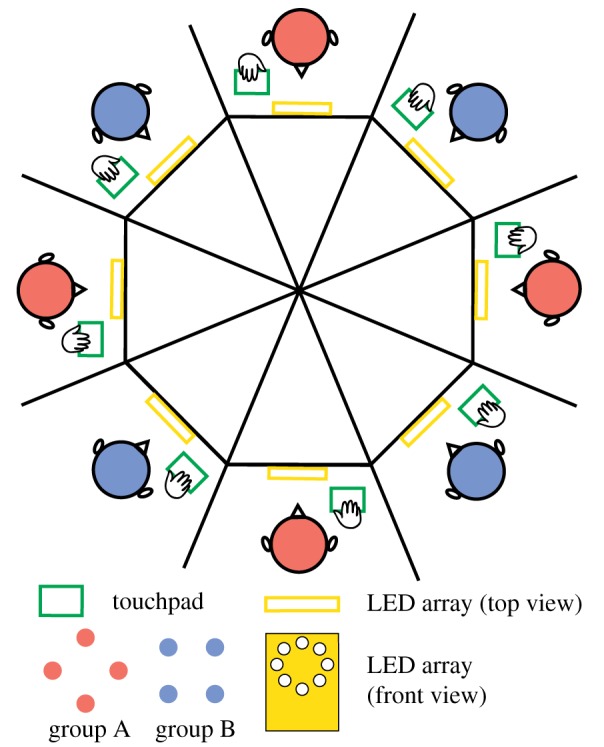
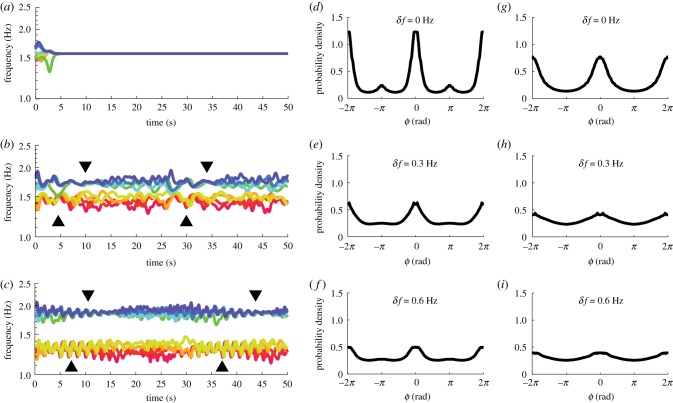
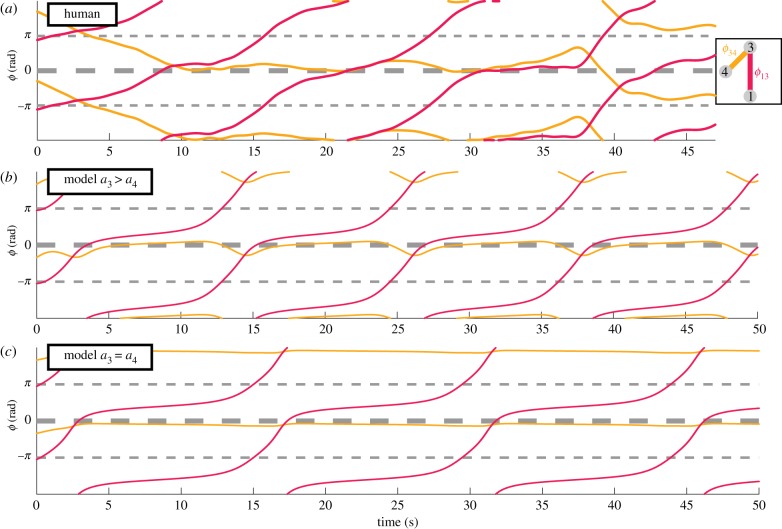
Coordination in living systems-from cells to people-must be understood at multiple levels of description. Analyses and modelling of empirically observed patterns of biological coordination often focus either on ensemble-level statistics in large-scale systems with many components, or on detailed dynamics in small-scale systems with few components. The two approaches have proceeded largely independent of each other. To bridge this gap between levels and scales, we have recently conducted a human experiment of mid-scale social coordination specifically designed to reveal coordination at multiple levels (ensemble, subgroups and dyads) simultaneously. Based on this experiment, the present work shows that, surprisingly, a single system of equations captures key observations at all relevant levels. It also connects empirically validated models of large- and small-scale biological coordination-the Kuramoto and extended Haken-Kelso-Bunz (HKB) models-and the hallmark phenomena that each is known to capture. For example, it exhibits both multistability and metastability observed in small-scale empirical research (via the second-order coupling and symmetry breaking in extended HKB) and the growth of biological complexity as a function of scale (via the scalability of the Kuramoto model). Only by incorporating both of these features simultaneously can we reproduce the essential coordination behaviour observed in our experiment.

Keywords: complex systems; complexity; coordination dynamics; nonlinear dynamics; social; statistical mechanics.


Figures

Figure 1.
Figure 1.
Experimental set-up for multiagent coordination. In the Human Firefly experiment [24], eight subjects interacted simultaneously with each other via a set of touch pads and LED arrays. Each subject’s movements were recorded with a dedicated touchpad. Taps of each subject were reflected as the flashes of a corresponding LED on the array presented in front of each subject. In each trial, each subject was paced with a metronome prior to interaction. The metronome assignment split the ensemble of eight into two frequency groups of four (group A and B, coloured red and blue, respectively, for illustrative purposes; the actual LEDs are all white). The frequency difference δf between group A and B was systematically manipulated to induce different grouping behaviour. See text and [24] for details. (Online version in colour.)
Figure 2.
Figure 2.
Social coordination behaviour observed in the Human Firefly experiment in terms of frequency dynamics and aggregated relative phase distributions. Panels (a–c) show instantaneous frequency (average over four cycles) from three example trials with diversity δf = 0, 0.3, 0.6 Hz, respectively. Viewed from bottom to top, in (c), two frequency groups of four are apparent and isolated due to high intergroup difference (low-frequency group, warm colours, paced with metronome fA = 1.2 Hz; high-frequency group, cold colours, paced with metronome fB = 1.8 Hz). As the two groups get closer (b), more cross-talk occurred between them (note contacting trajectories especially after 30 s). Finally, when the intergroup difference is gone (a), one supergroup of eight formed. Panels (df) show relative phase ϕ distributions aggregated from all trials for δf = 0, 0.3, 0.6 Hz, respectively (each distribution was computed from the set of all pair-wise relative phases at all time points in all trials for a given diversity condition; histograms computed in [0, π), plotted in [− 2π, 2π] to reflect the symmetry and periodicity of relative phase distributions). When diversity is low (d), the distribution peaks near inphase (ϕ = 0) and antiphase (ϕ = π), separated by a trough near π/2, with antiphase weaker than inphase. The two peaks are diminished as δf increases (e,f), but the weaker one at antiphase becomes flat first (f). (Online version in colour.)
Figure 3.
Figure 3.
Comparison between human and model behaviour at intragroup and intergroup levels. (a) How intragroup coordination relates to intergroup coordination for different levels of diversity (δf, colour-coded) in the ‘Human Firefly’ experiment [24]. Each dot’s x- and y-coordinate reflect the level of intragroup and intergroup coordination, respectively (measured by phase-locking value; see text) for a specific trial. Lines of corresponding colours are regression lines fitted for each diversity condition (slope β1 indicates the level of integration between groups). With low and moderate diversity (blue and red), two frequency groups are integrated (positive slopes); and with high diversity (yellow), two frequency groups are segregated (negative slope). Black line (zero slope) indicates the empirically estimated critical diversity δf*, demarcating the regimes of intergroup integration and segregation. The exact same analyses applied to the simulated data (200 trials per diversity condition) and results are shown in (c), which highly resemble their counterparts in (a). (b) A break-down of the average level of dyadic coordination as a function of diversity (colour) and whether the dyadic relation was intragroup (left) or intergroup (right). Intragroup coordination was reduced by the presence of intergroup diversity (δf ≠ 0; left red, yellow bars shorter than left blue bar); intergroup coordination dropped rapidly with increasing δf (right three bars; error bars reflect standard errors). Results of the same analyses on simulated data are shown in (d), which again highly resemble those of the human data in (b). (Online version in colour.)
Figure 4.
Figure 4.
Simulated coordination dynamics changes qualitatively and quantitatively with coupling strength and frequency diversity. (ac) Frequency dynamics of three simulated trials, with increasing coupling strength (a = b = 0.1, 0.2, 0.4, respectively) and all other parameters identical (members of the slower group, in warm colours, spread evenly within the interval 1.2 ± 0.08 Hz, similarly for members of the faster group, in cold colours, in the interval 1.8 ± 0.08 Hz; initial phases are random across oscillators but the same across trials). When the coupling is too strong (c), all oscillators lock to the same steady frequency. When the coupling is moderate (b), oscillators split into two frequency groups, phase-locked within themselves, interacting metastably with each other (dwell when trajectories are close, escape when trajectories are far apart). When the coupling is weak (a), intragroup coordination also becomes metastable seen as episodes of convergence (black triangles) and divergence. (d) Level of intergroup integration quantitatively (β1, colour of each pixel) for each combination of frequency diversity δf and coupling strength a = b. White curve indicates the critical boundary between segregation (blue area on the left, β1 < 0, minβ1 = −0.2) and integration (red and yellow area on the right, β1 > 0). Within the regime of integration, the yellow area indicates complete integration (β1 ≈ 1) where there is a high level of phase locking, and the red area indicates partial integration (0 < β1 ≪ 1) suggesting metastability. Dashed grey lines label δf’s that appeared in the human experiment. Solid grey line labels the empirically estimated critical diversity. (Online version in colour.)
Figure 5.
Figure 5.
Model simulations of frequency dynamics and aggregated relative phase distributions. (ac) An example of how intergroup difference may affect intragroup coordination using frequency dynamics of three simulated trials (a = b = 0.105; note that frequency is the time derivative of phase divided by 2π, and consequently the distance between two frequency trajectories reflects the rate of change of the corresponding relative phase, which increases and decreases intermittently during metastable coordination). These three trials share the same initial phases and intragroup frequency dispersion but different intergroup difference i.e. δf = 0, 0.3, 0.6 Hz, respectively. When intergroup differences are introduced (b,c), not only is intergroup interaction altered but intragroup coordination also loses stability and becomes metastable (within-group trajectories converge at black triangles and diverge afterwards). The timescale of metastable coordination also changes with δf, i.e. the inter-convergence interval is shorter for (b) than (c). (df) Relative phase distributions, aggregated over all time points in 200 trials (a = b = 0.105) for each diversity condition (δf = 0, 0.3, 0.6, respectively). At low diversity (d), there is a strong inphase peak and a weak antiphase peak, separated by a trough near π/2. Both peaks are diminished by increasing diversity (e,f). These features match qualitatively the human experiment. (gi) The same distributions as (df) but for a = 0.154 and b = 0 (i.e. the classical Kuramoto model). There is a single peak in each distribution at inphase ϕ = 0, and a trough at antiphase ϕ = π. (Online version in colour.)
Figure 6.
Figure 6.
Model with non-uniform coupling captures detailed relative phase dynamics observed in human social coordination. (a) Experimental observation of the coordination dynamics between three persons (agent 1, 3, 4, spatially situated as in legend) in terms of two relative phases (ϕ13, ϕ34; y-coordinates) as a function of time (x-coordinates). ϕ34 (yellow) persisted at inphase for a long time (10–37 s trajectory flattened near ϕ = 0) before switching to antiphase (40 s; inphase and antiphase are labelled with thick and thin dashed lines, respectively, throughout this figure). ϕ13 (red) dwelt at inphase intermittently (flattening of trajectory around 10, 20, and 35 s). Three bumps appeared in ϕ34 during its long dwell at inphase (near 15, 25, 37 s), which followed the dwells in ϕ13, indicating a possible influence of ϕ13 on ϕ34. (b,c) Two simulated trials with identical initial conditions and natural frequencies, estimated from the human data. In (b), agent 3 is more ‘social’ than agent 4 (a3 > a4). More precisely, agent 3 has a much stronger coupling (a3 = 1) than all others (a1 = a4 = b1 = b3 = b4 = 0.105, as in previous sections). The recurring bumps in ϕ34 are nicely reproduced. In (c), agents 3 and 4 are equally ‘social’ (a3 = a4 = 0.5525, keeping the same average as in (b)). ϕ34 is virtually flat throughout the trial. (Online version in colour.)

References

    1. Winfree AT. 1987. The timing of biological clocks. New York, NY: Scientific American Books.
    1. Kuramoto Y. 1984. Chemical oscillations, waves, and turbulence, vol. 19 of Springer Series in Synergetics. Berlin, Germany: Springer.
    1. Glass L. 2001. Synchronization and rhythmic processes in physiology. Nature 410, 277–284. (10.1038/35065745) - DOI - PubMed
    1. Nakagaki T, Yamada H, Ueda T. 2000. Interaction between cell shape and contraction pattern in the Physarum plasmodium. Biophys. Chem. 84, 195–204. (10.1016/S0301-4622(00)00108-3) - DOI - PubMed
    1. Kobayashi R, Tero A, Nakagaki T. 2006. Mathematical model for rhythmic protoplasmic movement in the true slime mold. J. Math. Biol. 53, 273–286. (10.1007/s00285-006-0007-0) - DOI - PubMed

Publication types

LinkOut - more resources