. 2019 Aug 14;20(1):146.
doi: 10.1186/s13059-019-1753-9.

Screening for genes that accelerate the epigenetic aging clock in humans reveals a role for the H3K36 methyltransferase NSD1

Affiliations

Screening for genes that accelerate the epigenetic aging clock in humans reveals a role for the H3K36 methyltransferase NSD1

Daniel E Martin-Herranz et al. Genome Biol. .

Abstract

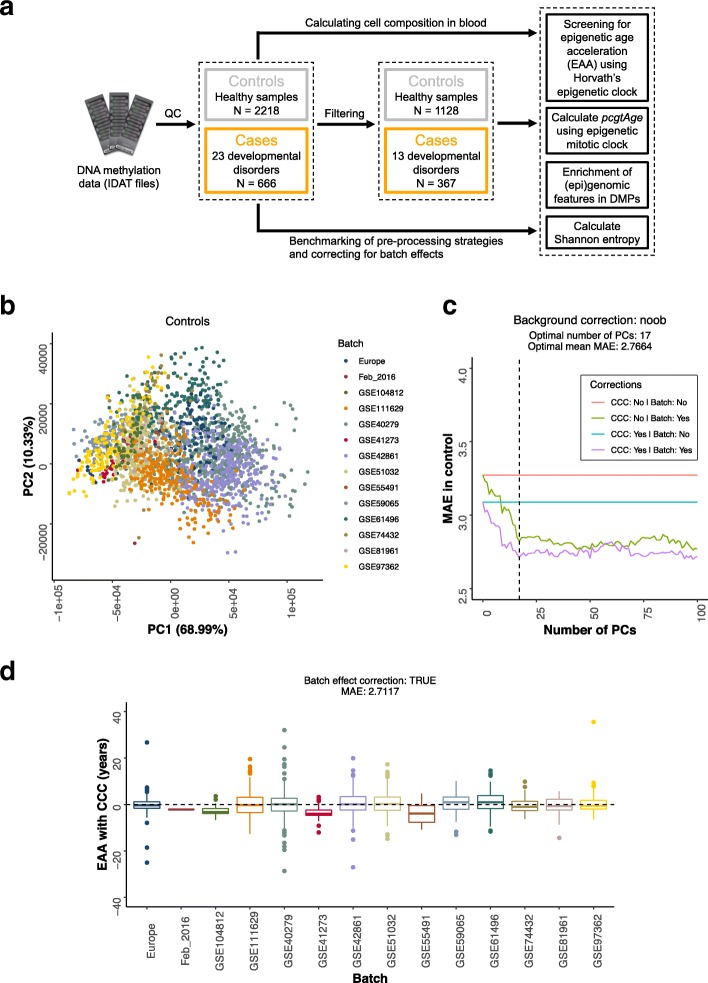
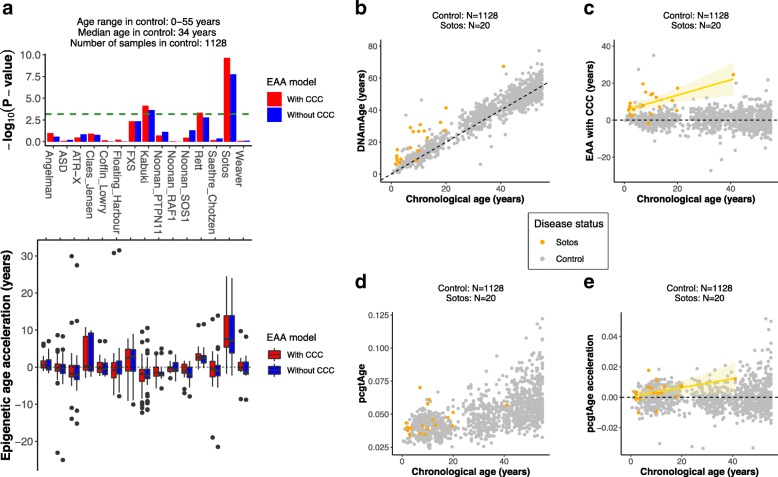
Background: Epigenetic clocks are mathematical models that predict the biological age of an individual using DNA methylation data and have emerged in the last few years as the most accurate biomarkers of the aging process. However, little is known about the molecular mechanisms that control the rate of such clocks. Here, we have examined the human epigenetic clock in patients with a variety of developmental disorders, harboring mutations in proteins of the epigenetic machinery.

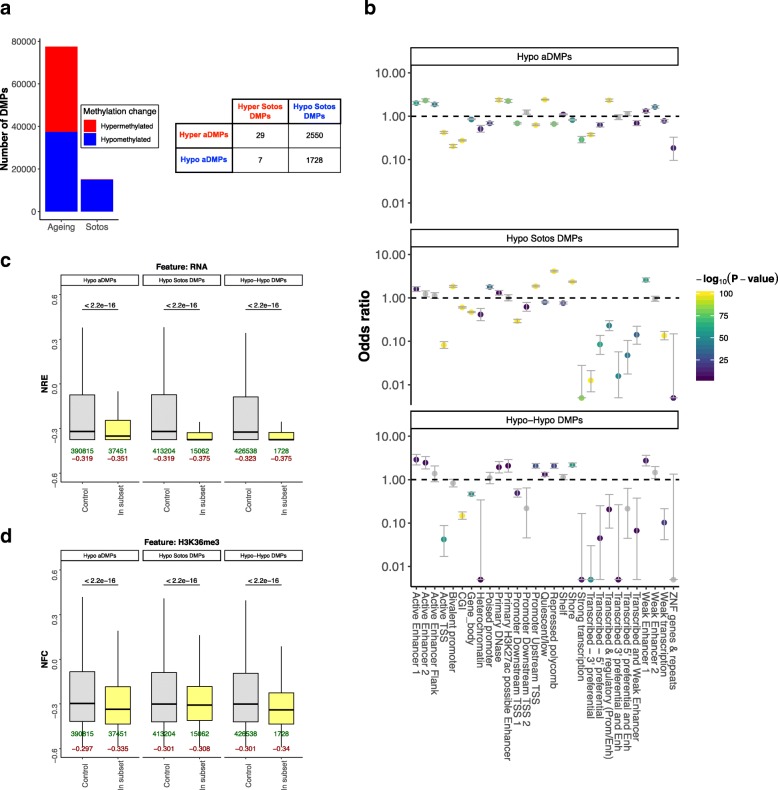
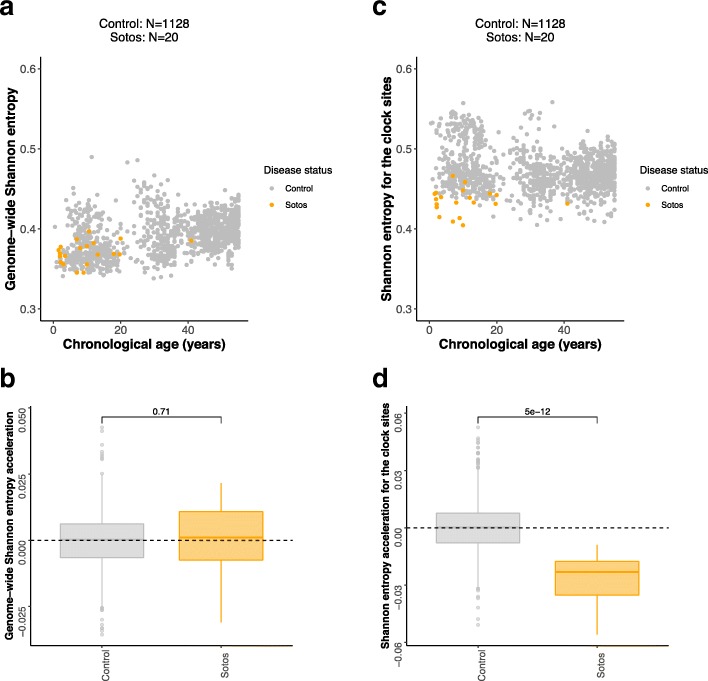
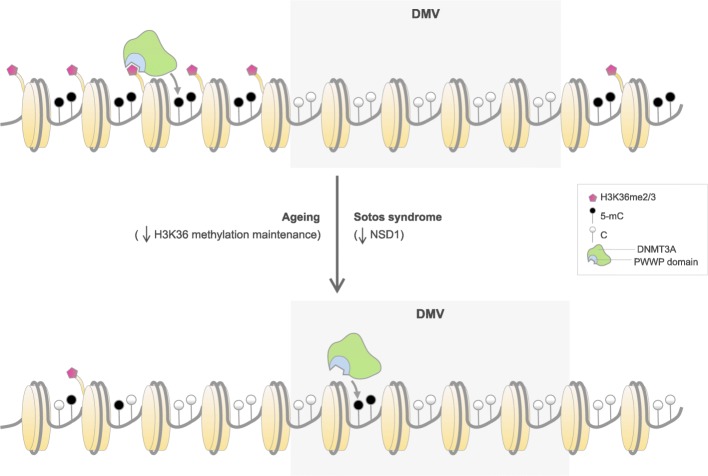
Results: Using the Horvath epigenetic clock, we perform an unbiased screen for epigenetic age acceleration in the blood of these patients. We demonstrate that loss-of-function mutations in the H3K36 histone methyltransferase NSD1, which cause Sotos syndrome, substantially accelerate epigenetic aging. Furthermore, we show that the normal aging process and Sotos syndrome share methylation changes and the genomic context in which they occur. Finally, we found that the Horvath clock CpG sites are characterized by a higher Shannon methylation entropy when compared with the rest of the genome, which is dramatically decreased in Sotos syndrome patients.

Conclusions: These results suggest that the H3K36 methylation machinery is a key component of the epigenetic maintenance system in humans, which controls the rate of epigenetic aging, and this role seems to be conserved in model organisms. Our observations provide novel insights into the mechanisms behind the epigenetic aging clock and we expect will shed light on the different processes that erode the human epigenetic landscape during aging.

Keywords: Aging; Biological age; DNA methylation; Developmental disorder; Epigenetic clock; Epigenetics; H3K36 methylation; Methylation entropy; NSD1; Sotos syndrome.


Conflict of interest statement

DEMH and TMS are founders and shareholders of Chronomics Limited, a UK-based company that provides epigenetic testing. WR is a consultant and shareholder of Cambridge Epigenetix. All other authors declare that they have no competing interests.

Figures

Fig. 1
Fig. 1
Screening for epigenetic age acceleration (EAA) is improved when correcting for batch effects. a Flow diagram that portrays an overview of the different analyses that are carried out in the raw DNA methylation data (IDAT files) from human blood for cases (developmental disorders samples) and controls (healthy samples). The control samples are filtered to match the age range of the cases (0–55 years). The cases are filtered based on the number of “adult” samples available (for each disorder, at least 5 samples, with 2 of them with an age ≥ 20 years). More details can be found in the “Methods” section. QC, quality control; DMPs, differentially methylated positions. b Scatterplot showing the values of the first two principal components (PCs) for the control samples after performing PCA on the control probes of the 450K arrays. Each point corresponds to a different control sample, and the colors represent the different batches. The different batches cluster together in the PCA space, showing that the control probes indeed capture technical variation. Please note that all the PCA calculations were done with more samples from cases and controls than those that were included in the final screening since it was performed before the filtering step (see the “Methods” section and Fig. 1a). c Plot showing how the median absolute error (MAE) of the prediction in the control samples, that should tend to zero, is reduced when the PCs capturing the technical variation are included as part of the modeling strategy (see the “Methods” section). The dashed line represents the optimal number of PCs (17) that was finally used. The optimal mean MAE is calculated as the average MAE between the green and purple lines. CCC, cell composition correction. d Distribution of the EAA with cell composition correction (CCC) for the different control batches, after applying batch effect correction
Fig. 2
Fig. 2
Sotos syndrome accelerates epigenetic aging. a Screening for epigenetic age acceleration (EAA) in developmental disorders. The upper panel shows the p values derived from comparing the EAA distributions for the samples in a given developmental disorder and the control (two-sided Wilcoxon’s test). The dashed green line displays the significance level of α = 0.01 after Bonferroni correction. The bars above the green line reach statistical significance. The lower panel displays the actual EAA distributions, which allows assessing the direction of the EAA (positive or negative). In red: EAA model with cell composition correction (CCC). In blue: EAA model without CCC. ASD, autism spectrum disorder; ATR-X, alpha thalassemia/mental retardation X-linked syndrome; FXS, fragile X syndrome. b Scatterplot showing the relation between epigenetic age (DNAmAge) according to Horvath’s model [8] and chronological age of the samples for Sotos (orange) and control (gray). Each sample is represented by one point. The black dashed line represents the diagonal to aid visualization. c Scatterplot showing the relation between the epigenetic age acceleration (EAA) and chronological age of the samples for Sotos (orange) and control (gray). Each sample is represented by one point. The yellow line represents the linear model EAA ~ Age, with the standard error shown in the light yellow shade. d Scatterplot showing the relation between the score for the epigenetic mitotic clock (pcgtAge) [39] and chronological age of the samples for Sotos (orange) and control (gray). Each sample is represented by one point. A higher value of pcgtAge is associated with a higher number of cell divisions in the tissue. e Scatterplot showing the relation between the epigenetic mitotic clock (pcgtAge) acceleration and chronological age of the samples for Sotos (orange) and control (gray). Each sample is represented by one point. The yellow line represents the linear model pcgtAgeacceleration ~ Age, with the standard error shown in the light yellow shade
Fig. 3
Fig. 3
Comparison between the DNA methylation changes during physiological aging and in Sotos. a Left: barplot showing the total number of differentially methylated positions (DMPs) found during physiological aging and in Sotos syndrome. CpG sites that increase their methylation levels with age in our healthy population or those that are elevated in Sotos patients (when compared with a control) are displayed in red. Conversely, those CpG sites that decrease their methylation levels are displayed in blue. Right: a table that represents the intersection between the aging (aDMPs) and the Sotos DMPs. The subset resulting from the intersection between the hypomethylated DMPs in aging and Sotos is called the “Hypo-Hypo DMPs” subset (N = 1728). b Enrichment for the categorical (epi) genomic features considered when comparing the different genome-wide subsets of differentially methylated positions (DMPs) in aging and Sotos against a control (see the “Methods” section). The y-axis represents the odds ratio (OR), the error bars show the 95% confidence interval for the OR estimate and the color of the points codes for -log10(p value) obtained after testing for enrichment using Fisher’s exact test. An OR > 1 shows that the given feature is enriched in the subset of DMPs considered, whilst an OR < 1 shows that it is found less than expected. In gray: features that did not reach significance using a significance level of α = 0.01 after Bonferroni correction. c Boxplots showing the distributions of the “normalised RNA expression” (NRE) when comparing the different genome-wide subsets of differentially methylated positions (DMPs) in aging and Sotos against a control (see the “Methods” section). NRE represents normalized mean transcript abundance in a window of ± 200 bp from the CpG site coordinate (DMP) being considered (see the “Methods” section). The p values (two-sided Wilcoxon’s test, before multiple testing correction) are shown above the boxplots. The number of DMPs belonging to each subset (in green) and the median value of the feature score (in dark red) are shown below the boxplots. d Same as c, but showing the “normalised fold change” (NFC) for the H3K36me3 histone modification (representing normalized mean ChIP-seq fold change for H3K36me3 in a window of ± 200 bp from the DMP being considered, see the “Methods” section)
Fig. 4
Fig. 4
Analysis of methylation Shannon entropy during physiological aging and in Sotos syndrome. a Scatterplot showing the relation between genome-wide Shannon entropy (i.e., calculated using the methylation levels of all the CpG sites in the array) and chronological age of the samples for Sotos (orange) and healthy controls (gray). Each sample is represented by one point. b Boxplots showing the distributions of genome-wide Shannon entropy acceleration (i.e., deviations from the expected genome-wide Shannon entropy for their age) for the control and Sotos samples. The p value displayed on top of the boxplots was derived from a two-sided Wilcoxon’s test. c Same as a., but using the Shannon entropy calculated only for the 353 CpG sites in the Horvath epigenetic clock. d Same as b, but using the Shannon entropy calculated only for the 353 CpG sites in the Horvath epigenetic clock
Fig. 5
Fig. 5
Proposed model that highlights the role of H3K36 methylation maintenance on epigenetic aging. The H3K36me2/3 mark allows recruiting de novo DNA methyltransferases DNMT3A (in green) and DNMT3B (not shown) through their PWWP domain (in blue) to different genomic regions (such as gene bodies or pericentric heterochromatin) [60, 68, 69], which leads to the methylation of the cytosines in the DNA of these regions (5-mC, black lollipops). On the contrary, DNA methylation valleys (DMVs) are conserved genomic regions that are normally found hypomethylated and associated with Polycomb-regulated developmental genes [–67]. During aging, the H3K36 methylation machinery could become less efficient at maintaining the H3K36me2/3 landscape. This would lead to a relocation of de novo DNA methyltransferases from their original genomic reservoirs (which would become hypomethylated) to other non-specific regions such as DMVs (which would become hypermethylated and potentially lose their normal boundaries), with functional consequences for the tissues. This is also partially observed in patients with Sotos syndrome, where mutations in NSD1 potentially affect H3K36me2/3 patterns and accelerate the epigenetic aging clock as measured with the Horvath model [8]. Given that DNMT3B is enriched in the gene bodies of highly transcribed genes [60] and that we found these regions depleted in our differential methylation analysis, we hypothesize that the hypermethylation of DMVs could be mainly driven by DNMT3A instead. However, it is important to mention that our analysis does not discard a role of DNMT3B during epigenetic aging

References

    1. Lopez-Otin C, Blasco MA, Partridge L, Serrano M, Kroemer G. The hallmarks of aging. Cell. 2013;153:1194–1217. doi: 10.1016/j.cell.2013.05.039. - DOI - PMC - PubMed
    1. Benayoun BA, Pollina EA, Brunet A. Epigenetic regulation of ageing: linking environmental inputs to genomic stability. Nat Rev Mol Cell Biol. 2015;16:593–610. doi: 10.1038/nrm4048. - DOI - PMC - PubMed
    1. Sen P, Shah PP, Nativio R, Berger SL. Epigenetic mechanisms of longevity and aging. Cell. 2016;166:822–839. doi: 10.1016/j.cell.2016.07.050. - DOI - PMC - PubMed
    1. Pal S, Tyler JK. Epigenetics and aging. Sci Adv. 2016;2:e1600584. doi: 10.1126/sciadv.1600584. - DOI - PMC - PubMed
    1. Horvath S, Raj K. DNA methylation-based biomarkers and the epigenetic clock theory of ageing. Nat Rev Genet. 2018;19:371–384. doi: 10.1038/s41576-018-0004-3. - DOI - PubMed

Publication types