. 2019 Aug 13;11(1):117.
doi: 10.1186/s13148-019-0708-z.

DNA methylation signature is prognostic of choroid plexus tumor aggressiveness

Affiliations

DNA methylation signature is prognostic of choroid plexus tumor aggressiveness

Malgorzata Pienkowska et al. Clin Epigenetics. .

Erratum in

Abstract

Background: Histological grading of choroid plexus tumors (CPTs) remains the best prognostic tool to distinguish between aggressive choroid plexus carcinoma (CPC) and the more benign choroid plexus papilloma (CPP) or atypical choroid plexus papilloma (aCPP); however, these distinctions can be challenging. Standard treatment of CPC is very aggressive and often leads to severe damage to the young child's brain. Therefore, it is crucial to distinguish between CPC and less aggressive entities (CPP or aCPP) to avoid unnecessary exposure of the young patient to neurotoxic therapy. To better stratify CPTs, we utilized DNA methylation (DNAm) to identify prognostic epigenetic biomarkers for CPCs.

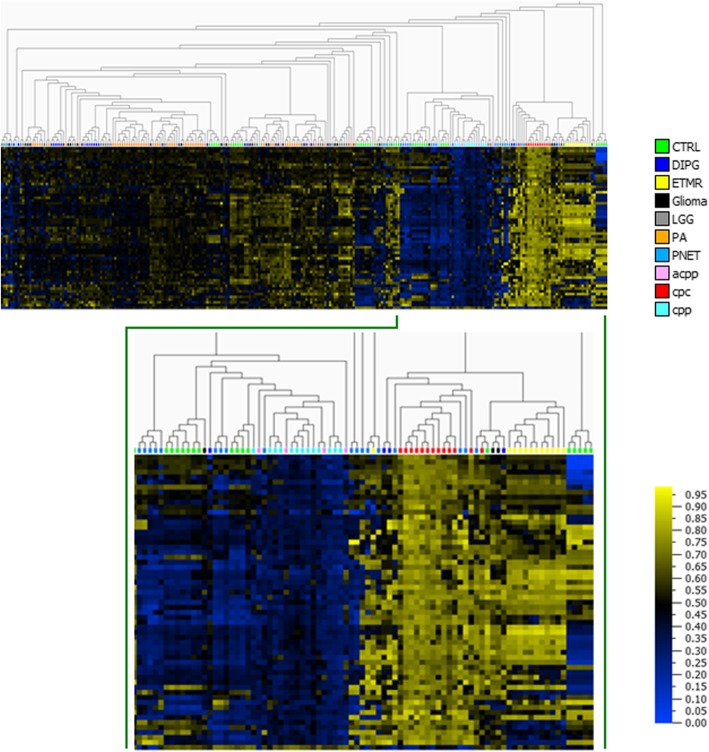
Methods: We obtained DNA methylation profiles of 34 CPTs using the HumanMethylation450 BeadChip from Illumina, and the data was analyzed using the Illumina Genome Studio analysis software. Validation of differentially methylated CpG sites chosen as biomarkers was performed using pyrosequencing analysis on additional 22 CPTs. Sensitivity testing of the CPC DNAm signature was performed on a replication cohort of 61 CPT tumors obtained from Neuropathology, University Hospital Münster, Germany.

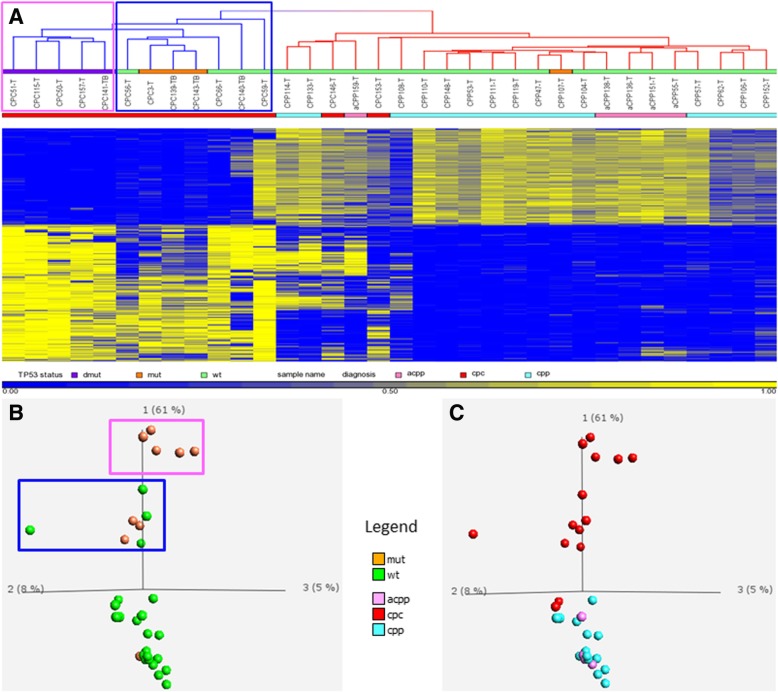
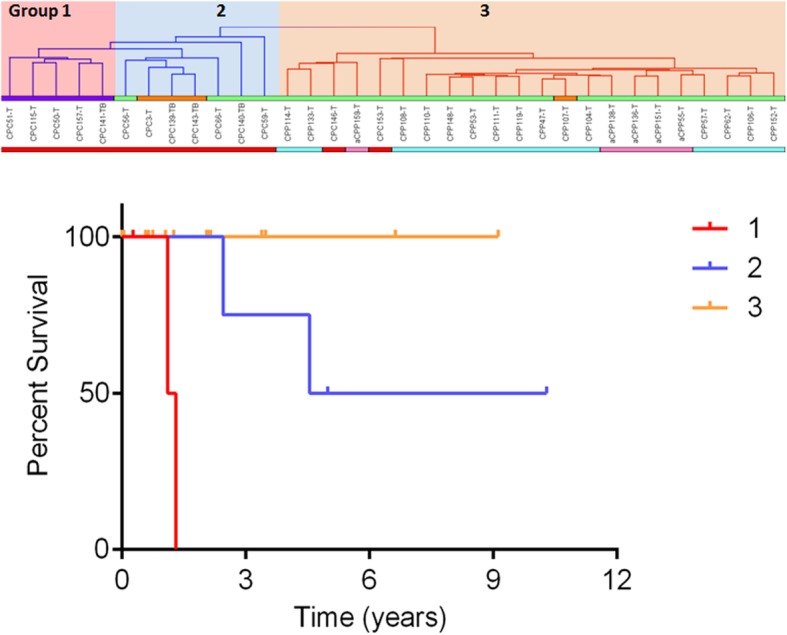
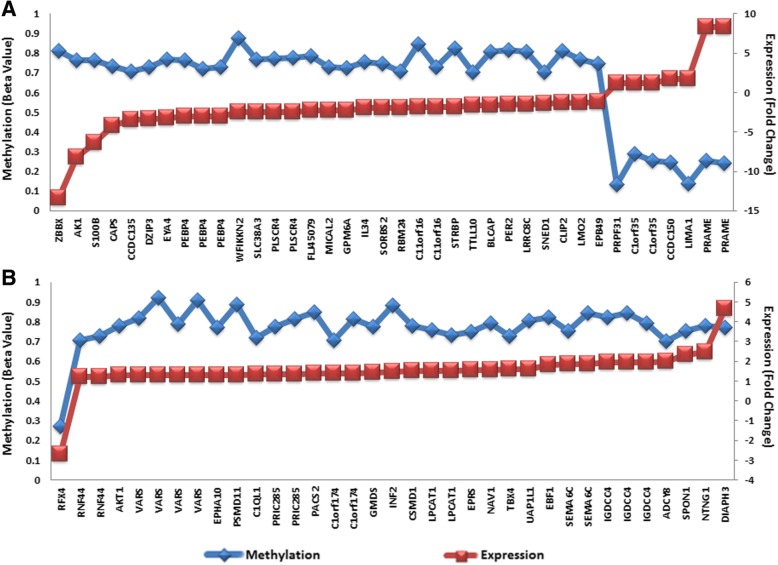
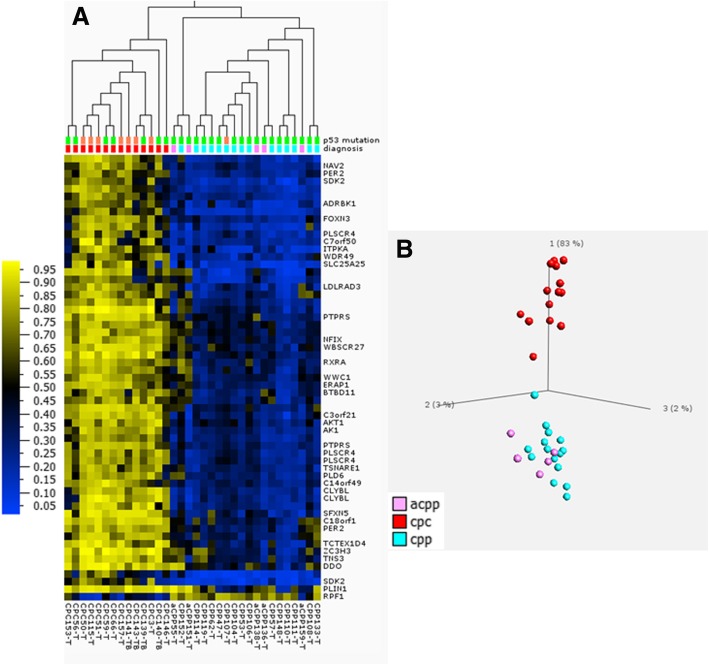
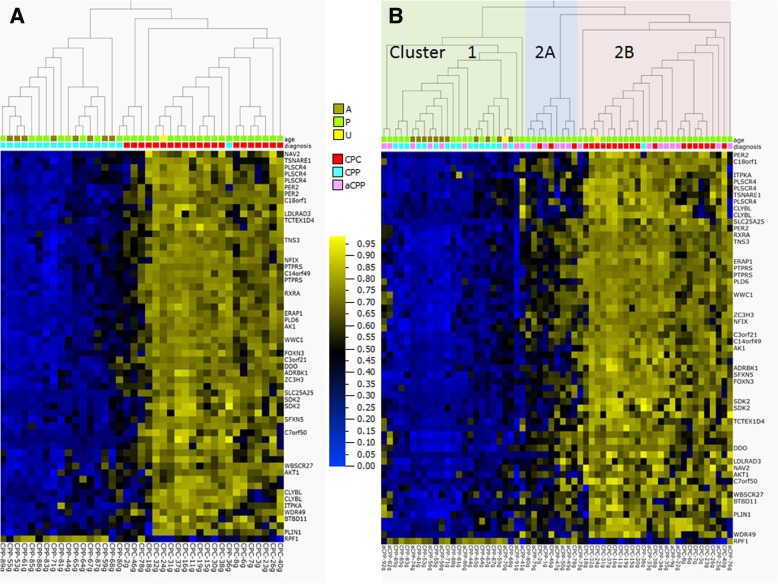
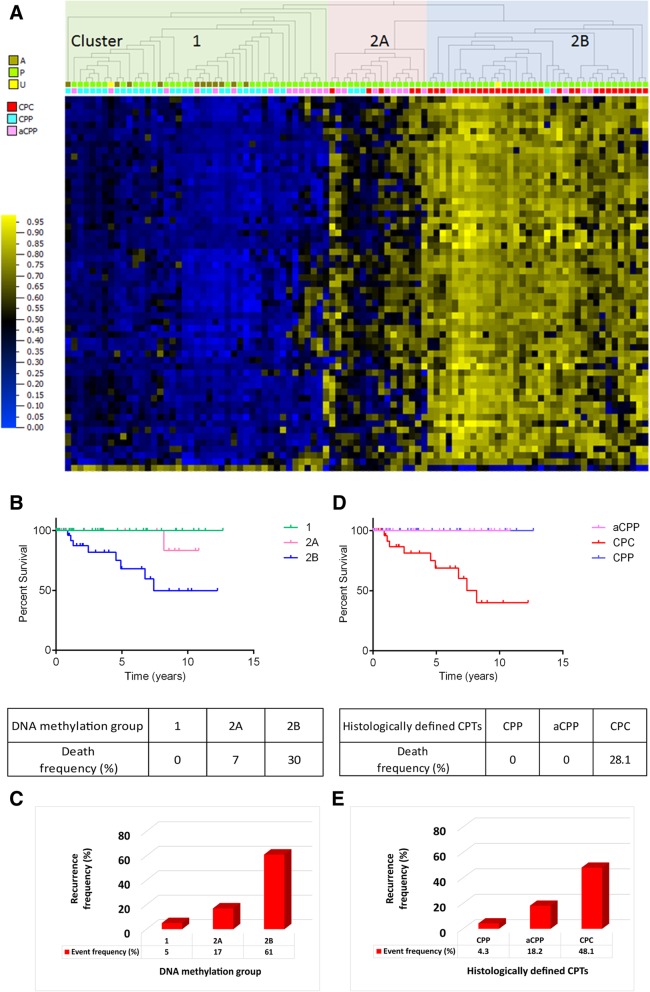
Results: Generated genome-wide DNAm profiles of CPTs showed significant differences in DNAm between CPCs and the CPPs or aCPPs. The prediction of clinical outcome could be improved by combining the DNAm profile with the mutational status of TP53. CPCs with homozygous TP53 mutations clustered as a group separate from those carrying a heterozygous TP53 mutation or CPCs with wild type TP53 (TP53-wt) and showed the worst survival outcome. Specific DNAm signatures for CPCs revealed AK1, PER2, and PLSCR4 as potential biomarkers for CPC that can be used to improve molecular stratification for diagnosis and treatment.

Conclusions: We demonstrate that combining specific DNAm signature for CPCs with histological approaches better differentiate aggressive tumors from those that are not life threatening. These findings have important implications for future prognostic risk prediction in clinical disease management.

Keywords: Choroid plexus tumors; DNA methylation; HumanMethylation450 arrays; Quantitative sodium bisulfite pyrosequencing.


Conflict of interest statement

The authors declare that they have no competing interests.

Figures

Fig. 1
Fig. 1
Two-way clustering performed on 34 CPT samples using Pearson’s correlation and average linkage (a) and PCA (b, c) using the top 3361 most differentially methylated CpGs (p < 0.05 after FDR correction and at least 30% methylation difference) shows segregation between majority of carcinomas (cpc) and papillomas (cpp and acpp). In addition, we observed segregation within the CPC group based on TP53 status. Homozygous TP53-mut (mutant) = violet bar (a) and outlined in pink box (a, b); heterozygous TP53-mut = orange bar (a) and outlined in blue box (a, b); TP53-wt (wild type) = green bar (a) and green dots (b); diagnosis: acpp = pink, cpc = red, and cpp = turquoise (ac). The numbers 1, 2, and 3 in PCA plots represent component 1, component 2, and component 3
Fig. 2
Fig. 2
Kaplan–Meier (KM) curve depicting overall survival (OS) estimates of patients with CPT by methylation subgroups. Statistical values comparing the three KM curves were obtained with the log-rank chi-square = 16.7 (df = 2), p value 0.0002; and Wilcoxon–Gehan chi-square = 15.5 (df = 2), p value 0.00043. Group 1 (pink highlight in top panel, red line in KM plot (n = 5)), CPCs with homozygous TP53-mut (mutant) = violet bar; group 2 (blue highlight in top panel, blue line in KM plot (n = 7)), CPCs with heterozygous TP53-mut = orange bar and TP53-wt (wild type) = green bar; group 3 (orange highlight in top panel, orange line in KM plot (n = 22)), CPPs-heterozygous TP53-mut = orange bar and TP53-wt = green bar and two CPCs with TP53-wt = green bar; diagnosis: cpc = red, acpp = pink, cpp = turquoise
Fig. 3
Fig. 3
Bar chart shows the enriched canonical pathways (a) or enriched biological function categories (b) in CPCs using Ingenuity Pathway Analysis (IPA). Major Y-axis on the left shows the number of differentially methylated genes. Secondary Y-axis on the right shows the significance levels (−log (B-H p value 0.05)) of the canonical pathway (a) and (−log (B-H p value 0.001)) of the biological function category (b). The orange line shows the significance threshold cutoff of −log (B-H p value 0.05). B-H, Benjamini–Hochberg multiple testing correction
Fig. 4
Fig. 4
Correlation between promoter (a) and body (b) methylation and gene expression. Scatter plots showing correlation of 73 CpG sites encompassing 57 single genes between methylation and expression. Y-axis on the left of each plot shows methylation levels (AVG_Beta Value) as a mean over all CPC samples (blue), and secondary Y-axis on the right shows expression fold changes of a given gene in CPCs vs CPPs (red)
Fig. 5
Fig. 5
CPC specific DNA methylation signature of 34 CPT samples Heatmap (a) and PCA (b) of 59 differentially methylated CpG sites encompassing 33 candidate genes extracted from the dataset of 3361 CpG sites by applying increased stringency (p < 0.001 and at least 0.4 delta beta). Hierarchical clustering was done using Euclidean metric. High methylation = yellow; low methylation = blue; TP53 status: wild type = green, mutated = orange; diagnosis: cpc = red, acpp = pink, cpp = turquoise. The numbers 1, 2, and 3 in PCA plot represent component 1, component 2, and component 3.
Fig. 6
Fig. 6
Heatmap of brain tumor DNA methylation datasets from GEO and TCGA databases with CPC-specific DNA methylation signature (59 differentially methylated CpG sites). Comparison of CPC-specific DNA methylation signature to other brain tumors. Brain tumor data were derived from GEO database under accession number GSE50022—for diffuse intrinsic pontine glioma (DIPG) (n = 28), GSE44684—from pilocytic astrocytoma (PA) n = 61-PA and n = 6 normal cerebellum (CTRL)), and GSE52556—from embryonal tumors with multilayered rosettes (ETMR) (n = 12), primitive neuroectodermal tumors (PNET) (n = 28), normal brain (CTRL) (n = 34), and TCGA-glioma (n = 24) and low grade glioma (LGG) (n = 30) from TCGA. CPTs diagnosis: cpc = red, acpp = pink, cpp = turquoise. Hierarchical clustering was done using Euclidean metric. High methylation = yellow; low methylation = blue
Fig. 7
Fig. 7
DNA methylation profile derived from the replication dataset of CPTs after applying CPC specific DNA methylation signature (59 differentially methylated CpG sites). a DNA methylation profile of 39 CPT samples (18 CPPs and 21 CPCs). b DNA methylation profile of 61 CPT samples. Hierarchical clustering was done using Euclidean metric. High methylation = yellow; low methylation = blue; diagnosis: cpc = red; acpp = pink; cpp = turquoise; age: A = adults, P = pediatric cases, U = unknown
Fig. 8
Fig. 8
DNA methylation profile derived from the combined discovery and replication datasets of CPTs after applying CPC specific DNA methylation signature (59 differentially methylated CpG sites), Kaplan–Meier plots showing overall survival by methylation subgroups or by histological diagnosis along with tables showing frequency of death event and histograms showing frequency of recurrence events within each of the DNA methylation signature derived clusters as well as for each of the histologically defined CPTs. a DNA methylation clusters of the 95 CPT samples (combined datasets of 34 samples used in discovery cohort and 61 samples from replication cohort) defined by applying CPC-specific DNA methylation signature. Hierarchical clustering was done using Euclidean metric. High methylation = yellow; low methylation = blue; diagnosis: cpc = red, acpp = pink, cpp = turquoise; age: A = adults, P = pediatric cases, U = unknown. Kaplan–Meier curves depicting overall survival (OS) estimates of patients with CPT by methylation subgroups (b) or by histological diagnosis (d). Statistical values were obtained with the log-rank chi-square = 11.8 (df = 1), p value 0.0008, when comparing patients grouped by methylation clusters and with the log-rank chi-square = 0.003495 (df = 2), p value 0.9529, when comparing patients grouped by diagnosis. Histograms showing frequency of recurrence event in each of the clusters derived from DNA methylation signature (c) of 95 CPT samples or for each of the histologically defined CPTs (e)

Similar articles

Cited by

References

    1. Louis DN, Ohgaki H, Wiestler OD, Cavenee WK, Burger PC, Jouvet A, et al. The 2007 WHO classification of tumours of the central nervous system. Acta Neuropathol. 2007;114(2):97–109. doi: 10.1007/s00401-007-0243-4. - DOI - PMC - PubMed
    1. Rickert CH, Paulus W. Tumors of the choroid plexus. Microsc Res Tech. 2001;52(1):104–111. doi: 10.1002/1097-0029(20010101)52:1<104::AID-JEMT12>3.0.CO;2-3. - DOI - PubMed
    1. Berger C, Thiesse P, Lellouch-Tubiana A, Kalifa C, Pierre-Kahn A, Bouffet E. Choroid plexus carcinomas in childhood: clinical features and prognostic factors. Neurosurgery. 1998;42(3):470–475. doi: 10.1097/00006123-199803000-00006. - DOI - PubMed
    1. Fitzpatrick LK, Aronson LJ. Cohen KJ. Is there a requirement for adjuvant therapy for choroid plexus carcinoma that has been completely resected? J Neurooncol. 2002;57(2):123–126. doi: 10.1023/A:1015773624733. - DOI - PubMed
    1. Wrede B, Liu P, Wolff JE. Chemotherapy improves the survival of patients with choroid plexus carcinoma: a meta-analysis of individual cases with choroid plexus tumors. J Neurooncol. 2007;85(3):345–351. doi: 10.1007/s11060-007-9428-x. - DOI - PubMed

Publication types

MeSH terms

Supplementary concepts