. 2019 Sep:47:44-57.
doi: 10.1016/j.ebiom.2019.08.013. Epub 2019 Aug 10.

Identification of AUNIP as a candidate diagnostic and prognostic biomarker for oral squamous cell carcinoma

Affiliations

Identification of AUNIP as a candidate diagnostic and prognostic biomarker for oral squamous cell carcinoma

Zongcheng Yang et al. EBioMedicine. 2019 Sep.

Abstract

Background: Oral squamous cell carcinoma (OSCC) is one of the most common malignant tumors worldwide. Patients with poorly differentiated OSCC often exhibit a poor prognosis. AUNIP (Aurora Kinase A and Ninein Interacting Protein), also known as AIBp, plays a key role in cell cycle and DNA damage repair. However, the function of AUNIP in OSCC remains elusive.

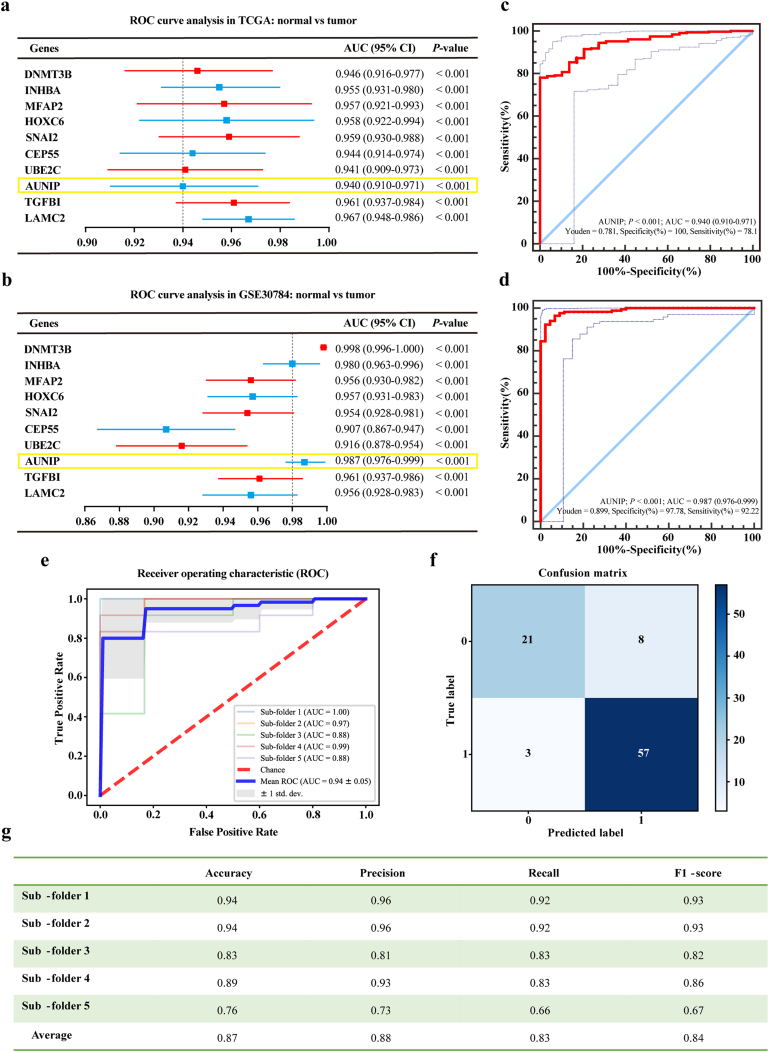
Methods: The differentially expressed genes (DEGs) were obtained using R language. Receiver operating characteristic curve analysis was performed to identify diagnostic markers for OSCC. The effectiveness of AUNIP in diagnosing OSCC was evaluated by machine learning. AUNIP expression was analyzed in publicly available databases and clinical specimens. Bioinformatics analysis and in vitro experiments were conducted to explore biological functions and prognostic value of AUNIP in OSCC.

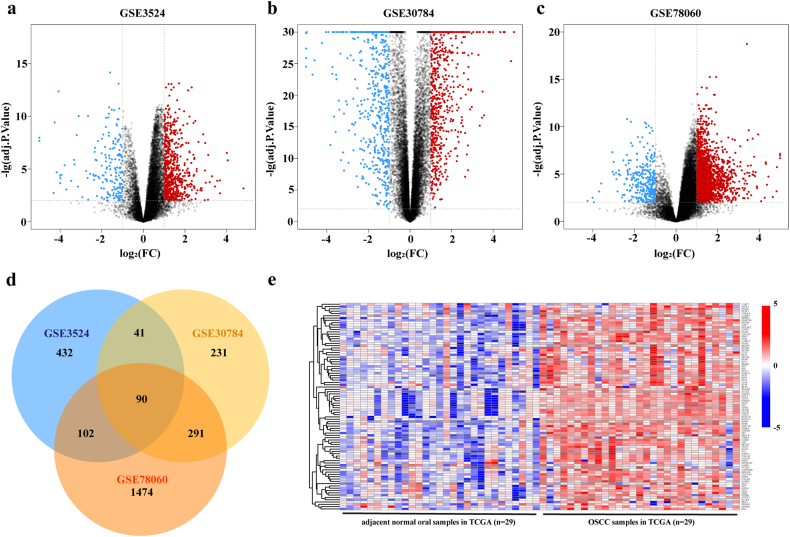
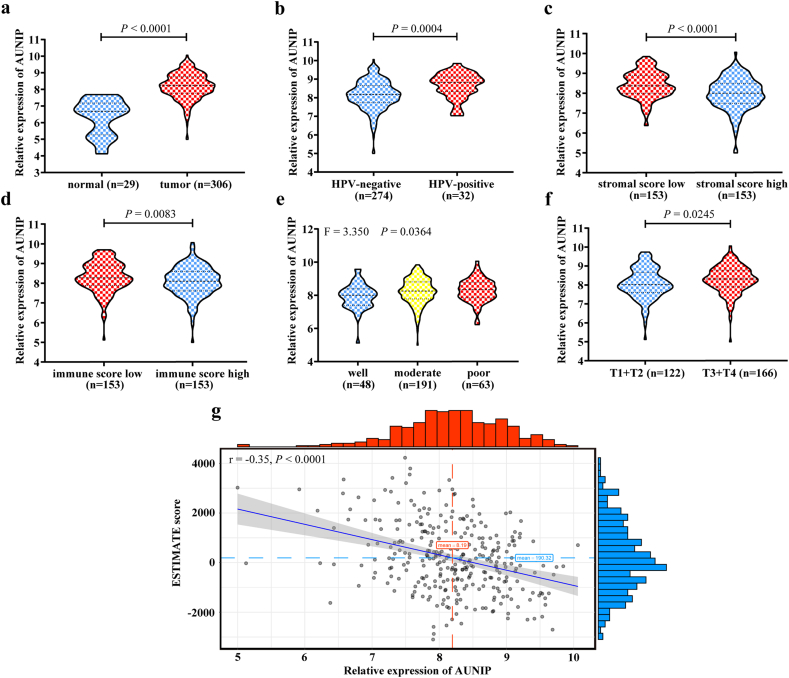
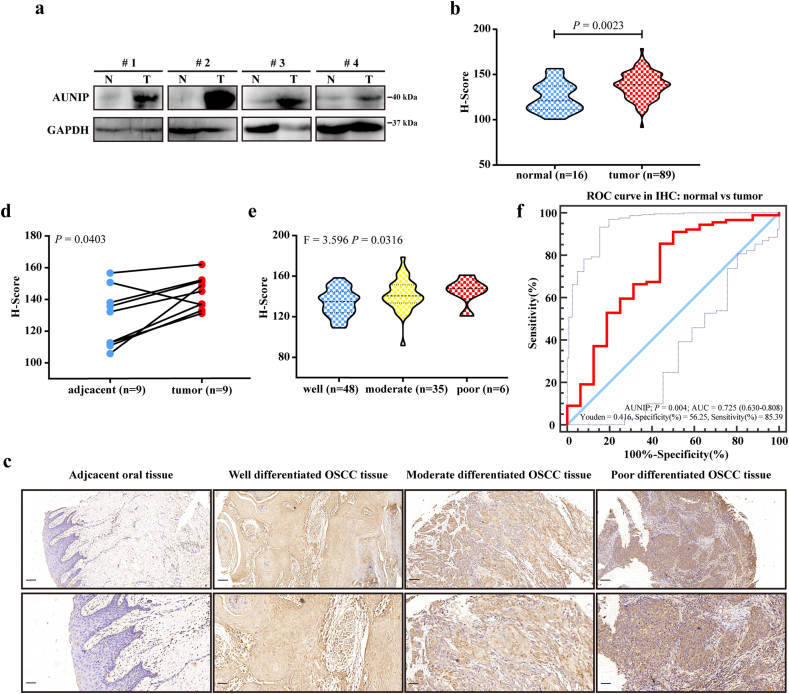
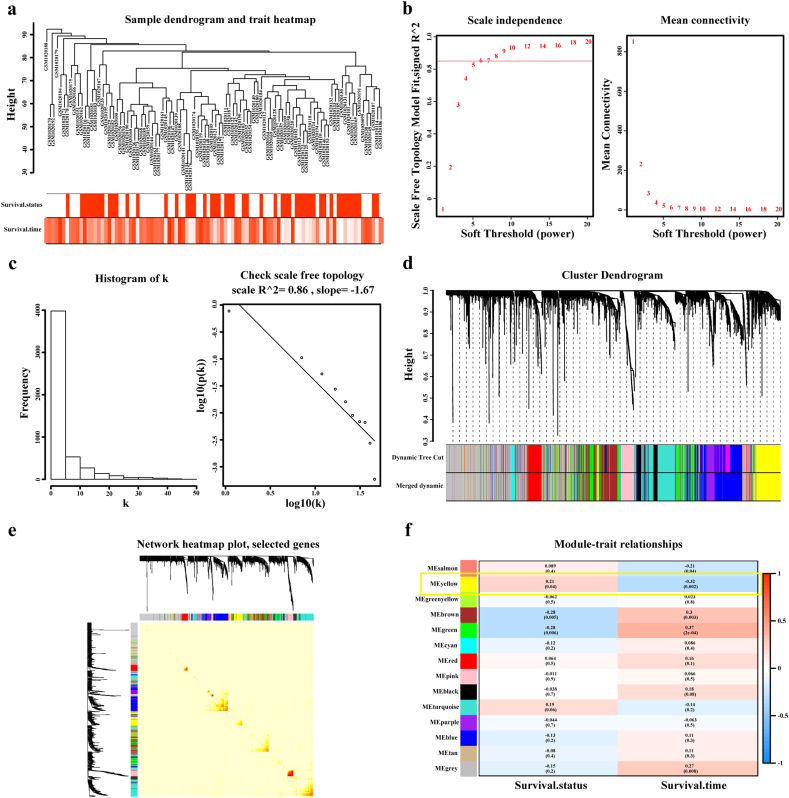
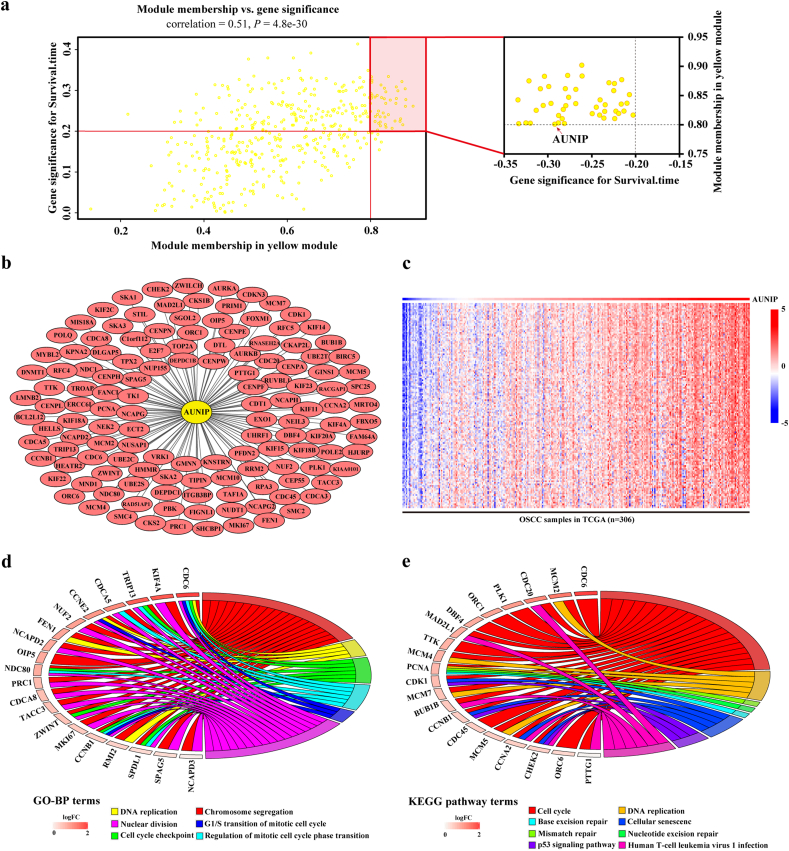
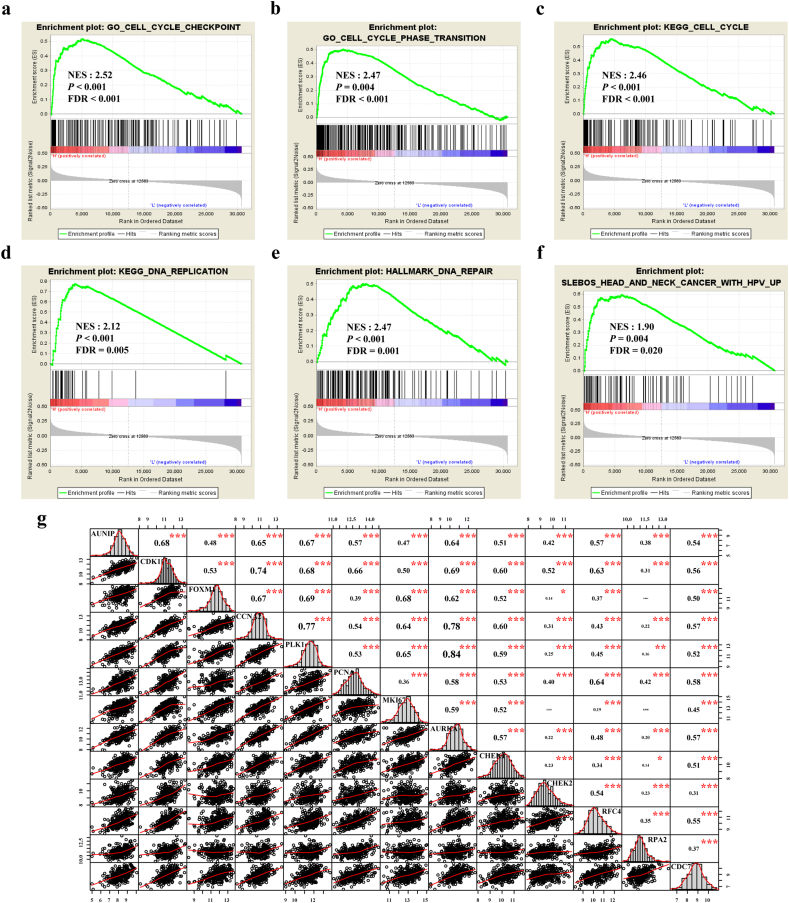
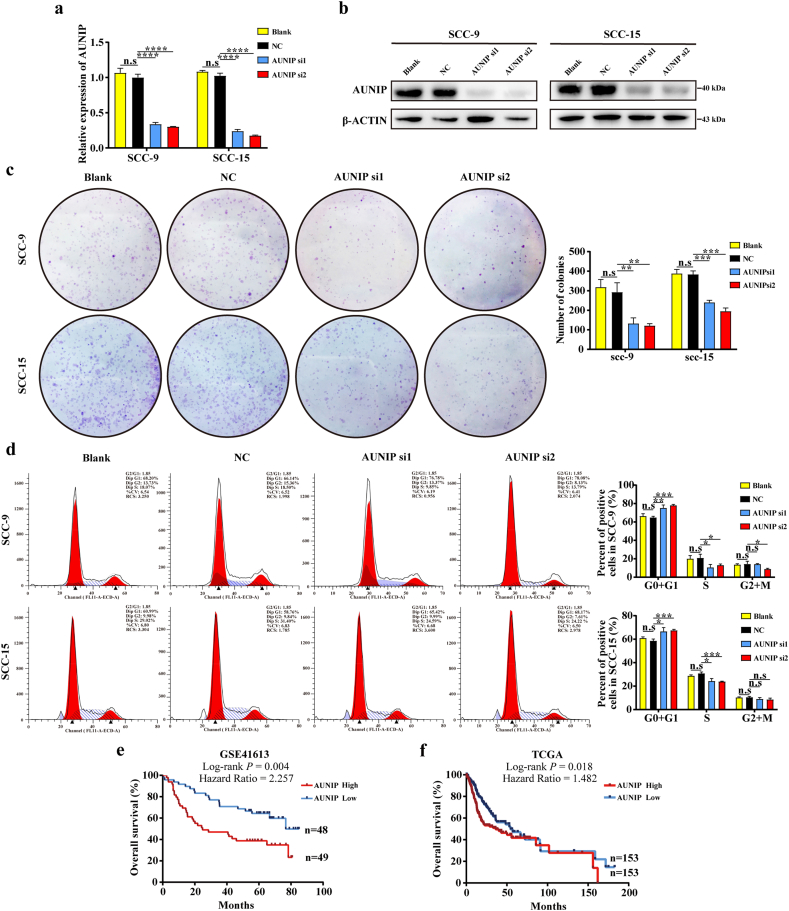
Findings: The gene integration analysis revealed 90 upregulated DEGs. One candidate biomarker, AUNIP, for the diagnosis of OSCC was detected, and its expression gradually increased along with malignant differentiation of OSCC. Bioinformatics analysis demonstrated that AUNIP could be associated with tumor microenvironment, human papillomavirus infection, and cell cycle in OSCC. The suppression of AUNIP inhibited OSCC cell proliferation and resulted in G0/G1 phase arrest in OSCC cells. The survival analysis showed that AUNIP overexpression predicted poor prognosis of OSCC patients.

Interpretation: AUNIP could serve as a candidate diagnostic and prognostic biomarker for OSCC and suppression of AUNIP may be a potential approach to preventing and treating OSCC. FUND: Taishan Scholars Project in Shandong Province (ts201511106) and the National Natural Science Foundation of China (Nos. 61603218).

Keywords: AUNIP; Biomarker; Oral squamous cell carcinoma; Receiver operating characteristic curve; Survival analysis; Weighted gene co-expression network analysis.


Conflict of interest statement

The authors declare no conflicts of interest.

Figures

Fig. 1
Fig. 1
Identification of differentially upregulated expressed genes. a–c. Volcano plots of gene expression profiles in GSE3524, GSE30784, and GSE78060. Red/blue symbols classify the upregulated/downregulated genes according to the criteria: log2FC > 1 and adjusted P-value <0·01. d. Common upregulated DEGs among GSE3524, GSE30784, and GSE78060. e. The expression matrix of 90 common upregulated DEGs in 29 pairs of OSCC and adjacent normal tissues followed by unsupervised hierarchical clustering in TCGA database. Blue, red and white respectively represents a lower expression level, a higher expression level and no expression difference among the genes. (For interpretation of the references to colour in this figure legend, the reader is referred to the web version of this article.)
Fig. 2
Fig. 2
Identification of key genes for diagnosis of OSCC. a. ROC curve analysis of the top ten DEGs in TCGA database. Genes with an AUC value are shown. b. ROC curve analysis of the selected ten genes in GSE30784. Genes with an AUC value are shown. c, d. ROC curve to assess sensitivity and specificity of AUNIP expression as a diagnostic biomarker for OSCC in TCGA database and GSE30784 dataset. e. ROC curve of AUNIP in the five-fold cross-validation. f. Construction of confusion matrix. g. Evaluation metrics of each fold. All data are represented by mean ± SD.
Fig. 3
Fig. 3
AUNIP expression is elevated in OSCC samples from TCGA database. a. TCGA database analysis of the relatively differential expression level (log2) of AUNIP in OSCC (n = 306) and adjacent normal oral (n = 29) tissues. b. Quantification of AUNIP mRNA levels (log2) in HPV-negative (n = 274) and HPV-positive (n = 32) OSCC tissues from TCGA database. c, d. Analysis of AUNIP mRNA levels (log2) in different stromal score and immune score (low, high, n = 153) of OSCC tissues from TCGA database. e, f. Analysis of AUNIP mRNA levels (log2) in different histologic grades (well, n = 48; moderate, n = 191; poor, n = 63) and tumor T stages (T1 + T2, n = 122; T3 + T4, n = 166) of OSCC tissues from TCGA database. g. The negative correlation between AUNIP mRNA expression level (log2) and ESTIMATE score in TCGA database. P-values were obtained by Student's t-test, One-way ANOVA test, and Pearson correlation analysis. All data are represented by mean ± SD.
Fig. 4
Fig. 4
AUNIP expression is upregulated in clinical OSCC samples. a. The protein levels of AUNIP in four pairs of OSCC tissues (T) and adjacent non-tumor tissues (N) measured by western blot. b. Quantification of AUNIP IHC staining in OSCC (n = 16) and normal oral (n = 89) tissues. c. Representative images of IHC staining for AUNIP in normal oral tissues and different histologic grades of OSCC tissues. Scale bars: 100 μm (insets 50 μm). d. Quantification of AUNIP IHC staining in OSCC and paired adjacent normal tissues (n = 9). e. Quantification of AUNIP IHC staining in different histologic grades of OSCC tissues (well, n = 48; moderate, n = 35; poor, n = 6). f ROC curve from IHC staining shows AUNIP is a marker to distinguish OSCC tissues from normal oral tissues. P-values were obtained by Student's t-test and One-way ANOVA test. All data are represented by mean ± SD.
Fig. 5
Fig. 5
Weighted co-expression network construction and identification of the key module containing AUNIP. a. Hierarchical clustering dendogram of samples from GSE41613. The clinical traits of survival status and survival time are displayed at the bottom. b, c. Analysis of scale-free fit index and the mean connectivity for various soft-thresholding powers. Testing the scale free topology when β = 8. d. Hierarchical clustering dendogram of genes with dissimilarity based on topological overlap. Modules are the branches of the clustering tree. e. The heat map describes the TOM among selected 1000 genes in WGCNA, and darker colour represents higher overlap and lighter colour corresponds to lower overlap. The gene dendrogram and module assignment are shown along the left side and the top. f. Correlation between module eigengenes and clinical traits. Each row corresponds to a module eigengene and columns represent clinical traits. Each cell contains the correlation and P-value, and yellow module containing AUNIP is selected. (For interpretation of the references to colour in this figure legend, the reader is referred to the web version of this article.)
Fig. 6
Fig. 6
Genes positively associated with AUNIP are enriched in cell cycle. a. Scatter plot of genes in yellow module. The vertical line represents cutoff of module membership = 0·8, and the horizontal line represents cutoff of gene significances for survival time = 0·2. Genes on upper right contains AUNIP. b. Network of genes positively associated with AUNIP expression according to the topological overlap. c. Heat map describes expression profiles of 134 genes positively associated with AUNIP in 306 OSCC samples in TCGA database. d. Gene ontology analysis of genes positively associated with AUNIP. e. KEGG pathway enrichment analysis of genes positively associated with AUNIP. (For interpretation of the references to colour in this figure legend, the reader is referred to the web version of this article.)
Fig. 7
Fig. 7
AUNIP is associated with cell cycle and HPV status in OSCC. a–f. GSEA of Hallmarks, GO, KEGG pathway gene sets in AUNIP high versus low samples from TCGA database. Normalized enrichment score (NES), nominal P-value and FDR are shown in each plot. g. Correlation between AUNIP and cell cycle, HPV infection related molecules in OSCC samples from TCGA database. *P ≤ 0·05, **P ≤ 0·01, and ***P ≤ 0·001 were obtained by Pearson correlation analysis.
Fig. 8
Fig. 8
AUNIP controls cell cycle progression in vitro and its expression is associated with poor survival in OSCC patients. a. AUNIP mRNA levels in indicated cells transfected with AUNIP siRNA. b. AUNIP protein levels in indicated cells transfected with AUNIP siRNA. c. Representative images (left) and quantification (right) of Blank, Negative Control (NC) siRNA-, and AUNIP siRNA- transfected SCC-9 and SCC-15 cells were analyzed in a colony formation assay. d. Representative images (left) and quantification (right) of Blank, Negative Control (NC) siRNA-, and AUNIP siRNA- transfected SCC-9 and SCC-15 cells were analyzed in cell cycle assay. e, f. Kaplan-Meier analysis of overall survival was performed to indicate higher expression of AUNIP was correlated with poor survival of OSCC patients in GSE41613 and TCGA datasets. P-values were obtained from the log-rank test. n.s, not significant, *P ≤ 0·05, **P ≤ 0·01, ***P ≤ 0·001, and ****P ≤ 0·0001 were obtained by Student's t-test. All data are represented by mean ± SD.

References

    1. Bray F., Ferlay J., Soerjomataram I., Siegel R.L., Torre L.A., Jemal A. Global cancer statistics 2018: GLOBOCAN estimates of incidence and mortality worldwide for 36 cancers in 185 countries. CA Cancer J Clin. 2018;68(6):394–424. - PubMed
    1. Siegel R.L., Miller K.D., Jemal A. Cancer statistics, 2018. CA Cancer J Clin. 2018;68(1):7–30. - PubMed
    1. Shi J., Bao X., Liu Z., Zhang Z., Chen W., Xu Q. Serum miR-626 and miR-5100 are promising prognosis predictors for Oral squamous cell carcinoma. Theranostics. 2019;9(4):920–931. - PMC - PubMed
    1. Huang T.H., Li K.Y., Choi W.S. Lymph node ratio as prognostic variable in oral squamous cell carcinomas: systematic review and meta-analysis. Oral Oncol. 2019;89:133–143. - PubMed
    1. Gharat S.A., Momin M., Bhavsar C. Oral squamous cell carcinoma: current treatment strategies and nanotechnology-based approaches for prevention and therapy. Crit Rev Ther Drug Carrier Syst. 2016;33(4):363–400. - PubMed

MeSH terms