. 2020 Apr;69(4):630-640.
doi: 10.1136/gutjnl-2019-318325. Epub 2019 Aug 13.

Master transcription factors form interconnected circuitry and orchestrate transcriptional networks in oesophageal adenocarcinoma

Affiliations

Master transcription factors form interconnected circuitry and orchestrate transcriptional networks in oesophageal adenocarcinoma

Li Chen et al. Gut. 2020 Apr.

Abstract

Objective: While oesophageal squamous cell carcinoma remains infrequent in Western populations, the incidence of oesophageal adenocarcinoma (EAC) has increased sixfold to eightfold over the past four decades. We aimed to characterise oesophageal cancer-specific and subtypes-specific gene regulation patterns and their upstream transcription factors (TFs). DESIGN: To identify regulatory elements, we profiled fresh-frozen oesophageal normal samples, tumours and cell lines with chromatin immunoprecipitation sequencing (ChIP-Seq). Mathematical modelling was performed to establish (super)-enhancers landscapes and interconnected transcriptional circuitry formed by master TFs. Coregulation and cooperation between master TFs were investigated by ChIP-Seq, circularised chromosome conformation capture sequencing and luciferase assay. Biological functions of candidate factors were evaluated both in vitro and in vivo.

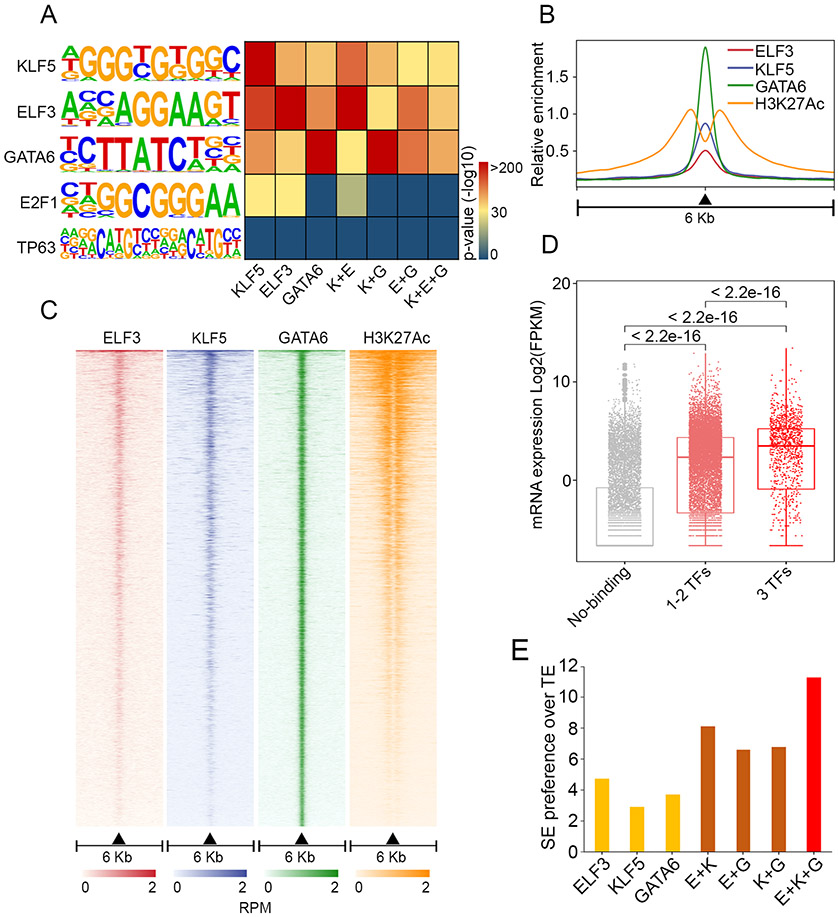
Results: We found widespread and pervasive alterations of the (super)-enhancer reservoir in both subtypes of oesophageal cancer, leading to transcriptional activation of a myriad of novel oncogenes and signalling pathways, some of which may be exploited pharmacologically (eg, leukemia inhibitory factor (LIF) pathway). Focusing on EAC, we bioinformatically reconstructed and functionally validated an interconnected circuitry formed by four master TFs-ELF3, KLF5, GATA6 and EHF-which promoted each other's expression by interacting with each super-enhancer. Downstream, these master TFs occupied almost all EAC super-enhancers and cooperatively orchestrated EAC transcriptome. Each TF within the transcriptional circuitry was highly and specifically expressed in EAC and functionally promoted EAC cell proliferation and survival.

Conclusions: By establishing cancer-specific and subtype-specific features of the EAC epigenome, our findings promise to transform understanding of the transcriptional dysregulation and addiction of EAC, while providing molecular clues to develop novel therapeutic modalities against this malignancy.

Keywords: gene regulation; oesophageal cancer; signal transduction; transcription factor.


Conflict of interest statement

Competing interests: None declared.

Figures

Figure 1.
Figure 1.. Enhancer and super-enhancer landscapes of esophageal cancers.
(A) Hierarchical clustering using enhancers with the most variable intensities (top 10,000). (B) Left, pie chart showing the number of gained enhancers in each group; Right, pathway enrichment of gained enhancers. Dot size denotes the number of genes enriched. (C) Box plot of mRNA levels of genes associated with changed enhancers in EAC and ESCC samples from TCGA. (D) Box plot of DNA methylation levels of changed enhancer loci in EAC and ESCC samples from TCGA. P value was determined by Wilcox Test. (E) Venn diagram of the number of super-enhancers annotated in each group. (F) Inflection plot ranking enhancer intensities, and only group-specific super-enhancers are displayed as examples. (G) IGV plots of the H3K27Ac ChIP-Seq profiles of group-specific super-enhancers. Each line represents one sample; values of normalized ChIP-Seq signal intensities are shown on the upper left corner; genomic structure of the genes associated with super-enhancer is shown at the bottom.
Figure 2.
Figure 2.. Master TFs form interconnected transcriptional circuitry in EAC.
(A) Integrative methods for identification of candidate master TFs. (B) Heatmap of Pearson correlation coefficient between candidate master TFs in TCGA EAC (n=88), stomach adenocarcinoma (STAD, n=415) or breast cancer samples (n=1,100). (C) Heatmap of fold changes of mRNA levels of master TFs and c-Myc and EVX1 (non-master TFs, negative control) following siRNA knockdown of each master TF (left) or 3 different shRNAs against ELF3 (right). (D) Western Blot validating the co-regulation among master TFs in Eso26 cells. The numbers denote the densitometric quantitation of band intensity, normalized by Actin levels. (E) IGV plot of ChIP-Seq showing co-occupancy (shaded) of ELF3, KLF5 and GATA6 at the super-enhancers of their own gene and the other 3 master TFs. Antibodies against endogenous KLF5 and GATA6 were used. A flag antibody for exogenous ELF3-Flag was used because of the poor quality of ELF3 antibody for ChIP-Seq. (F) Schematic graph of the model of interconnected circuitry, with rectangles and ovals representing enhancer elements and proteins, respectively.
Figure 3.
Figure 3.. Master TFs orchestrate co-operatively EAC transcriptional network.
(A) Position weight matrix and heatmap showing the p values of enriched motifs in either ELF3-, KLF5-, GATA6- or co-occupied genomic regions in Eso26 cells. The enrichment of TP63 and E2F1 motifs are shown as negative controls. (B) Line plots showing the distribution of indicated ChIP-Seq signals at GATA6 peak regions (centered at the summit of GATA6 peaks). (C) Heatmap showing ChIP-Seq signals at GATA6 peak regions (+/− 3Kb of peak center), rank ordered by intensity of GATA6 peaks based on reads per million mapped reads (RPM). Lines, peaks; color scale of peak intensity is show at the bottom. (D) Box plot of mRNA levels of genes associated with each group of peaks in Eso26 cells. (E) Fold ratio of the percentage of super-enhancers (SE) over typical-enhancers (TE) bound by individual master TFs either alone or together.
Figure 4.
Figure 4.. Master TFs co-operatively activate the super-enhancer of ELF3.
(A) 4C assay showing the long-range interactions anchored on ELF3 promoter in Eso26 cells. Deeper red color indicates higher interaction frequency. (B) ChIP-Seq profiles for H3K27Ac (in different groups of samples) and master TFs at ELF3 super-enhancer loci. (C) Zoom in view of ChIP-Seq signals in Eso26 cells. Connecting lines showing the interactions detected by 4C. Five constituent enhancers (E1-E5) and one negative control (Ctrl) region were separately cloned into luciferase reporter vector. (D) Enhancer activity measured by luciferase reporter assays in indicated EAC cells and KYSE510 cells. Mean ± s.d. are shown, n = 2. *, P<0.05; **, P<0.01; ***, P<0.001. (E) Eso26 cells expressing dCas9/KRAB vector with sgRNAs targeting E1 and E4 or control vector were subject to qRT-PCR to quantify the mRNA expression of master TFs.
Figure 5.
Figure 5.. Master TFs have strong pro-EAC functions.
(A) Knockdown of ELF3 by individual siRNAs decreased cell proliferation and colony growth (B), and increased cell apoptosis (C) and S-phase arrest (D) in different EAC cell lines. (E) Silencing of ELF3 by inducible shRNAs in Eso26 cells decreased cell proliferation, colony growth (F) as well as xenograft growth in vivo (G-I). (G) weights, (H) images and (I) growth curves of resected tumors from both groups. (J-L) Knockdown of other three master TFs by individual siRNAs decreased cell proliferation and colony growth. Mean ± s.d. are shown, n = 3. *, P<0.05; **, P<0.01; ***, P<0.001.
Figure 6.
Figure 6.. Up-regulated by master TFs via super-enhancers, LIF promotes EAC growth and migration.
(A) IGV plots of ChIP-Seq showing EAC-specific LIF super-enhancer which was co-occupied by master TFs. (B) Cell viability assay testing EC330, a LIF inhibitor, in EAC and ESCC cell lines. IC50 values are shown in the right panel. (C) Silencing of LIF with siRNA decreased different EAC cell proliferation and (D) colony growth. (E) LIF stimulated EAC cell migration, which was neutralized by an anti-LIF antibody. (F) Western Blotting showing that LIF stimulated STAT3 and AKT phosphorylation in EAC cell lines. Mean ± s.d. are shown, n = 3. *, P<0.05; **, P<0.01; ***, P<0.001. (G) IHC staining of LIF in EAC (n=35), non-malignant esophagus squamous mucosa (NESQ, n=10) and NGEJ samples (n=7).

References

    1. Whyte WA, Orlando DA, Hnisz D, Abraham BJ, Lin CY, Kagey MH, et al. Master transcription factors and mediator establish super-enhancers at key cell identity genes. Cell 2013;153:307–19. - PMC - PubMed
    1. Hnisz D, Abraham BJ, Lee TI, Lau A, Saint-Andre V, Sigova AA, et al. Super-enhancers in the control of cell identity and disease. Cell 2013;155:934–47. - PMC - PubMed
    1. Yuan J, Jiang YY, Mayakonda A, Huang M, Ding LW, Lin H, et al. Super-enhancers promote transcriptional dysregulation in nasopharyngeal carcinoma. Cancer Res 2017. - PMC - PubMed
    1. Jiang YY, Lin DC, Mayakonda A, Hazawa M, Ding LW, Chien WW, et al. Targeting super-enhancer-associated oncogenes in oesophageal squamous cell carcinoma. Gut 2017;66:1358–68. - PMC - PubMed
    1. Lin DC, Dinh HQ, Xie JJ, Mayakonda A, Silva TC, Jiang YY, et al. Identification of distinct mutational patterns and new driver genes in oesophageal squamous cell carcinomas and adenocarcinomas. Gut 2017. - PMC - PubMed

Publication types

MeSH terms

Supplementary concepts