. 2019 Oct 7;218(10):3455-3471.
doi: 10.1083/jcb.201901032. Epub 2019 Aug 13.

Gulp1 controls Eph/ephrin trogocytosis and is important for cell rearrangements during development

Affiliations

Gulp1 controls Eph/ephrin trogocytosis and is important for cell rearrangements during development

Jingyi Gong et al. J Cell Biol. .

Abstract

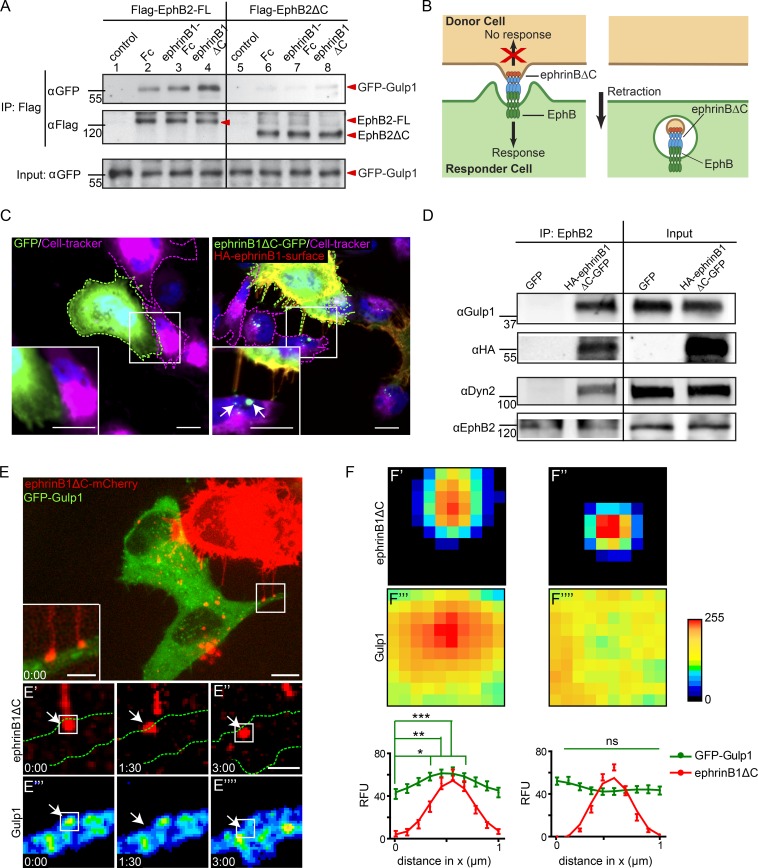
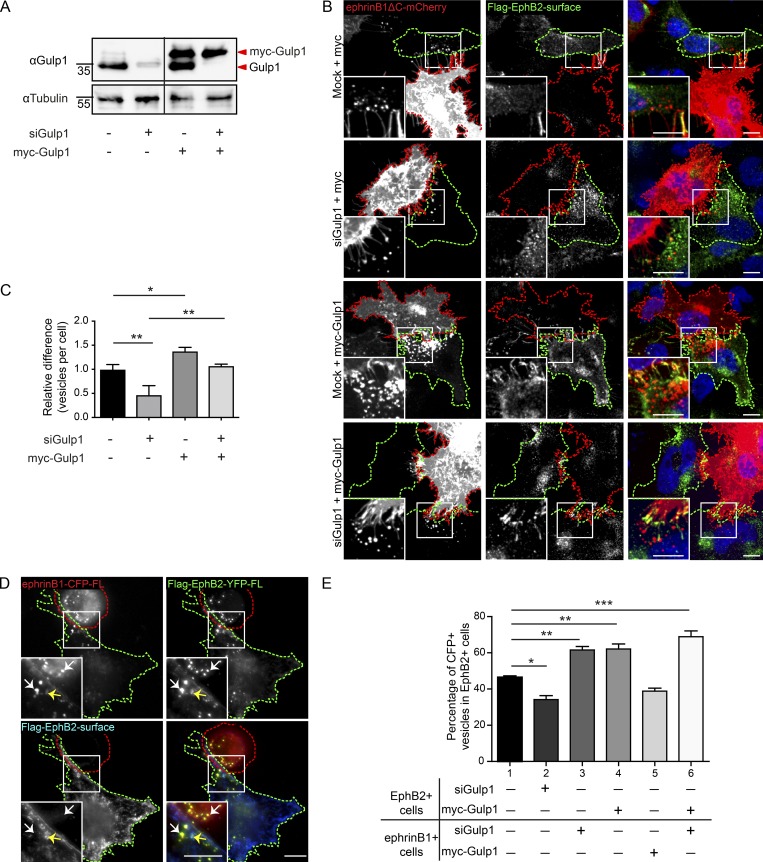
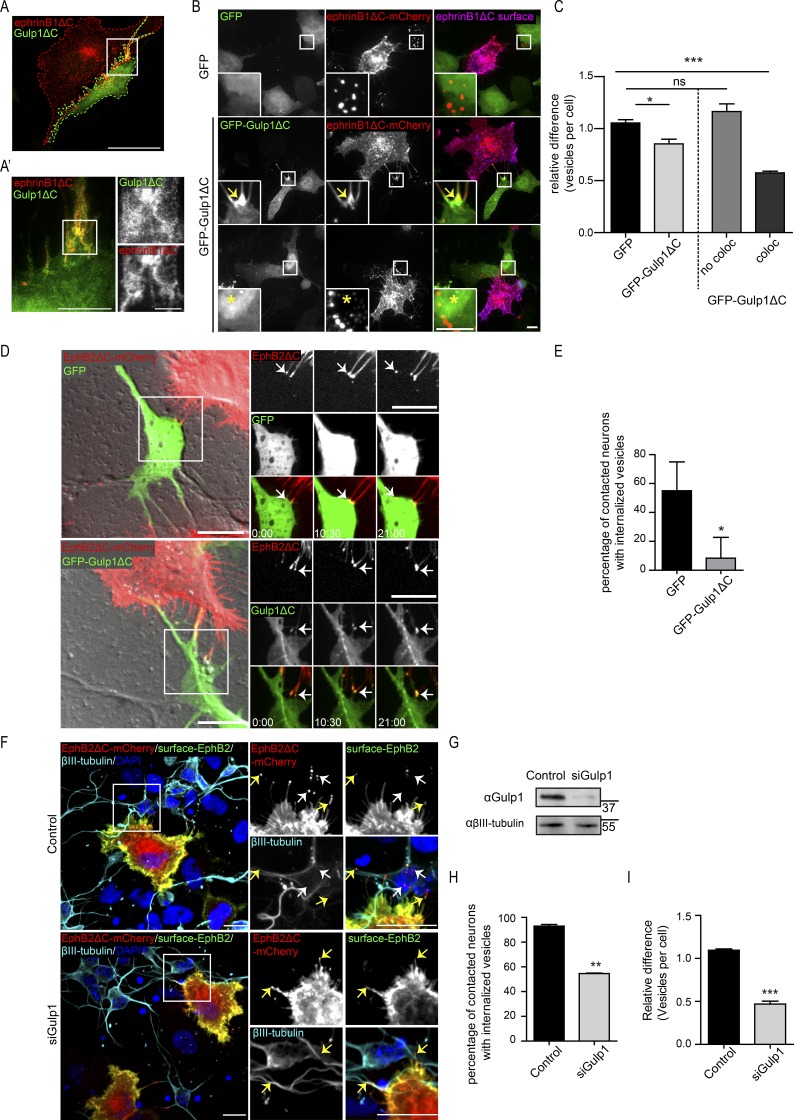
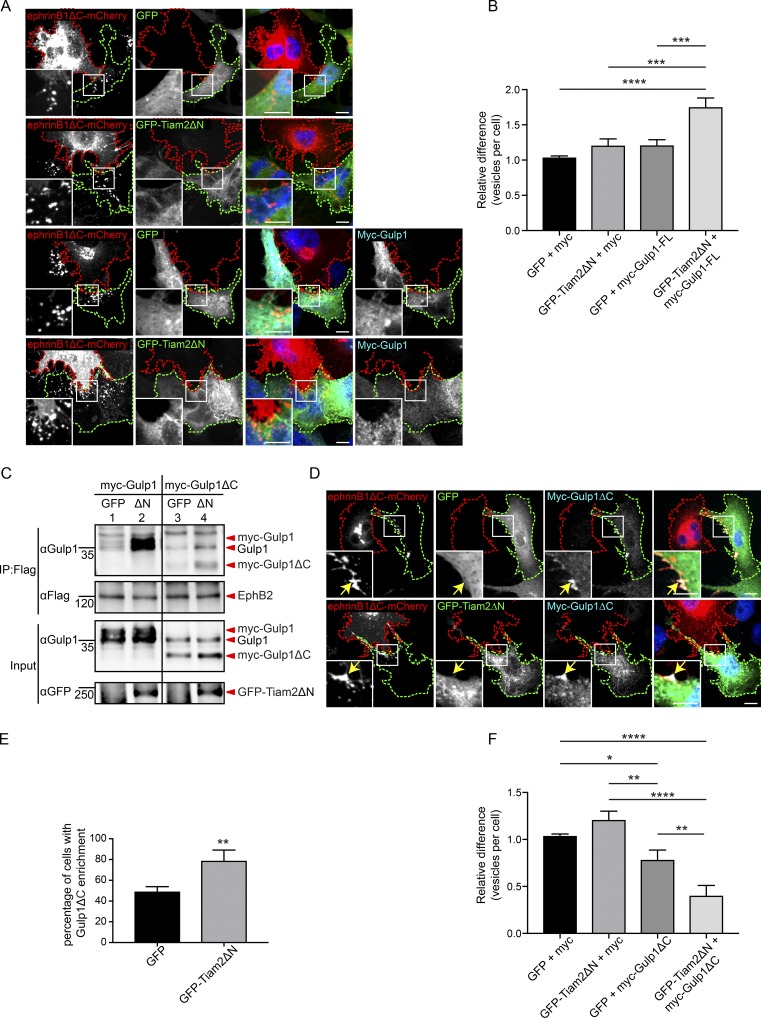
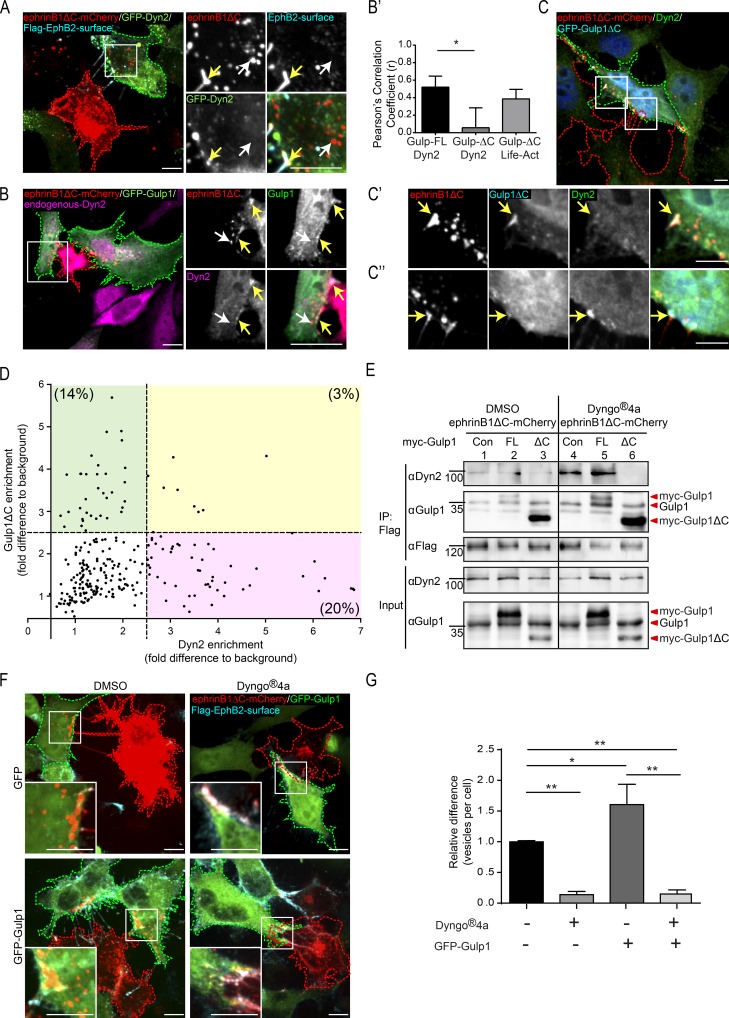
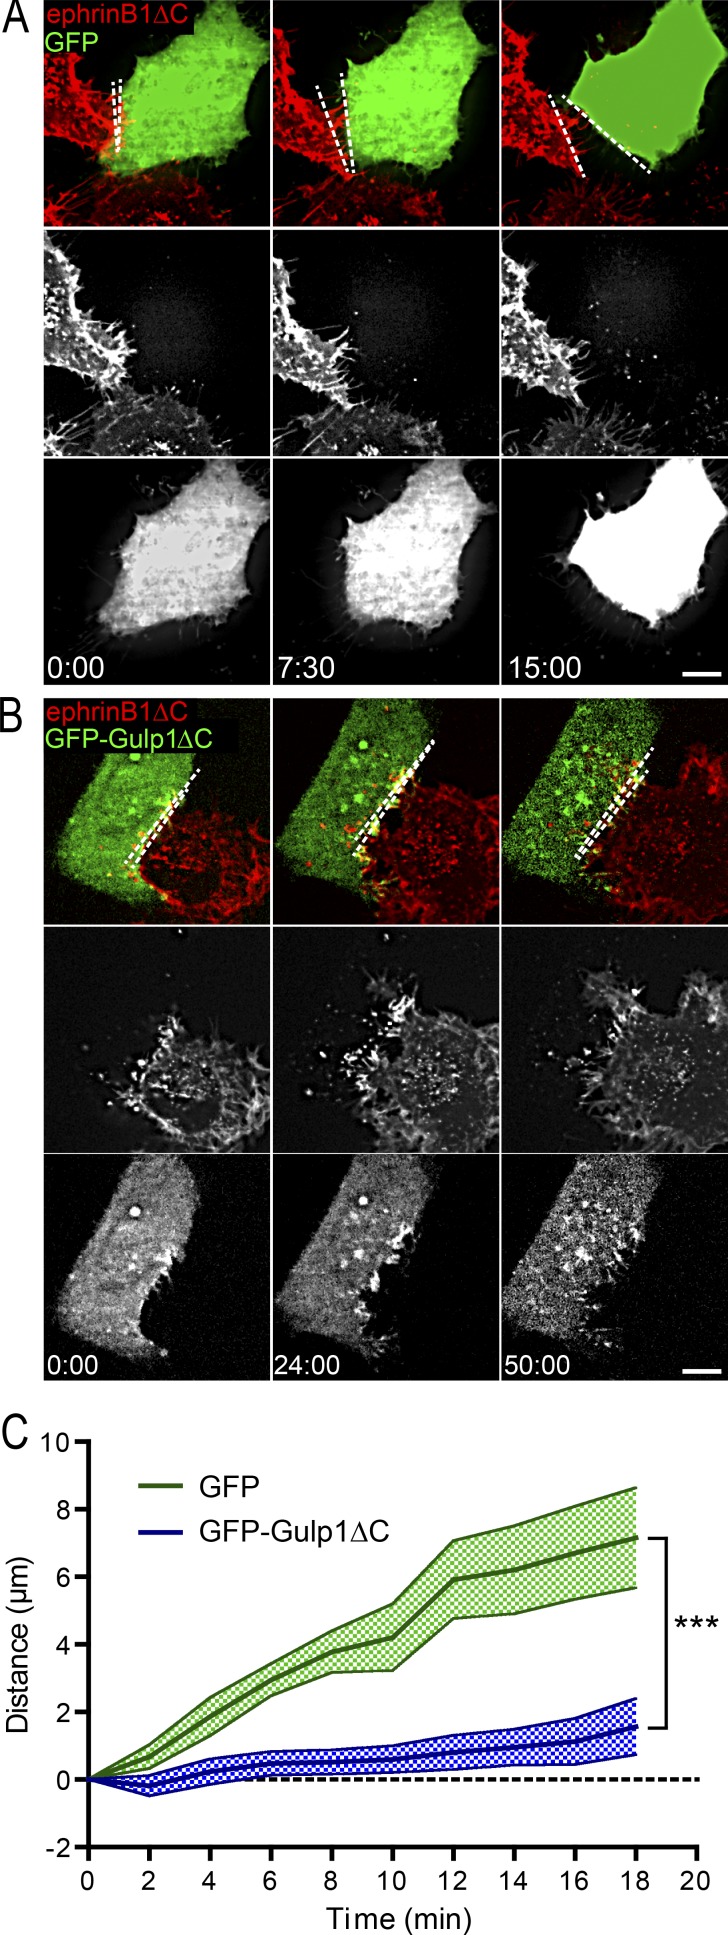
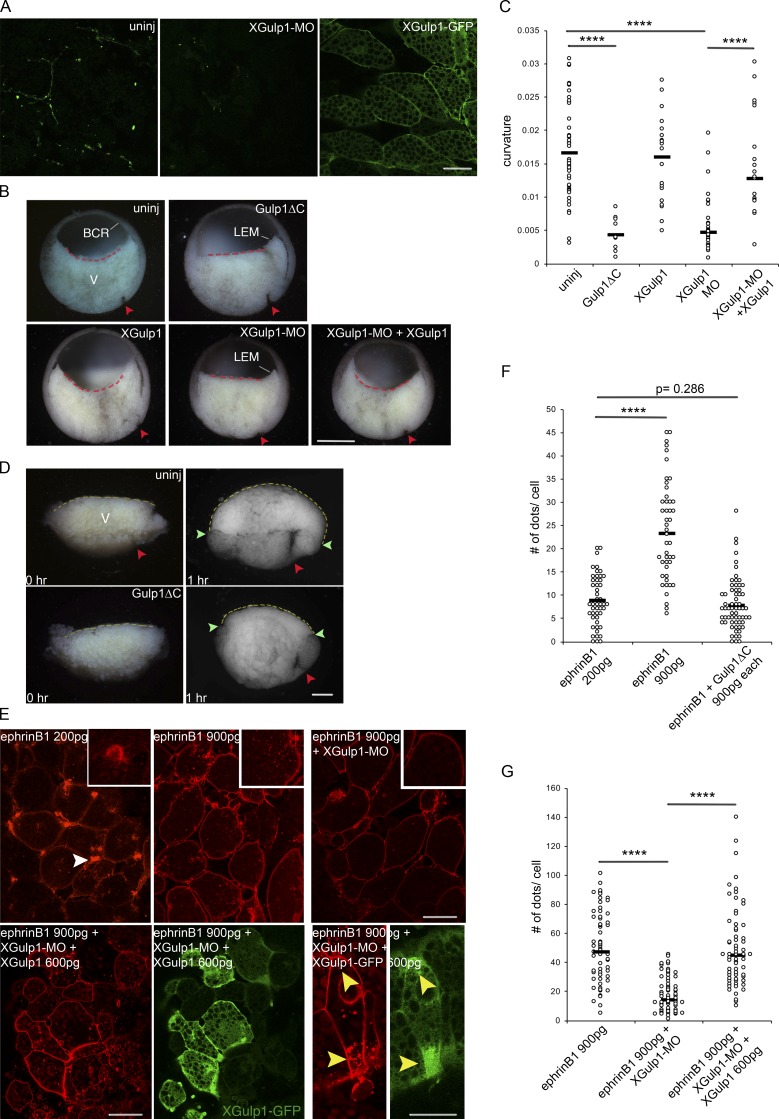
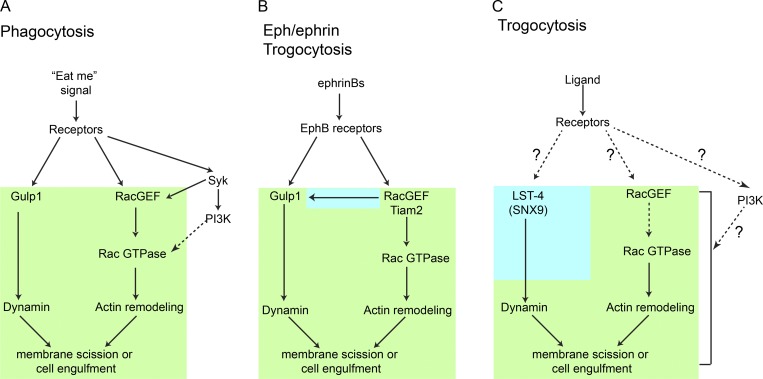
Trogocytosis, in which cells nibble away parts of neighboring cells, is an intercellular cannibalism process conserved from protozoa to mammals. Its underlying molecular mechanisms are not well understood and are likely distinct from phagocytosis, a process that clears entire cells. Bi-directional contact repulsion induced by Eph/ephrin signaling involves transfer of membrane patches and full-length Eph/ephrin protein complexes between opposing cells, resembling trogocytosis. Here, we show that the phagocytic adaptor protein Gulp1 regulates EphB/ephrinB trogocytosis to achieve efficient cell rearrangements of cultured cells and during embryonic development. Gulp1 mediates trogocytosis bi-directionally by dynamic engagement with EphB/ephrinB protein clusters in cooperation with the Rac-specific guanine nucleotide exchange factor Tiam2. Ultimately, Gulp1's presence at the Eph/ephrin cluster is a prerequisite for recruiting the endocytic GTPase dynamin. These results suggest that EphB/ephrinB trogocytosis, unlike other trogocytosis events, uses a phagocytosis-like mechanism to achieve efficient membrane scission and engulfment.


Figures

Figure 1.
Figure 1.
Gulp1 interacts with EphB2. (A) Validation of the interaction between Gulp1 and EphB2 using coimmunoprecipitation. HeLa cells overexpressing GFP-Gulp1 and either full-length Flag-EphB2 (Flag-EphB2-FL) or Flag-EphB2ΔC were either not treated (control) or treated with either preclustered Fc or preclustered ephrinB1-Fc, or cocultured with HeLa cells overexpressing ephrinB1ΔC-CFP (ephrinB1ΔC). (B) Model of EphB/ephrinB forward trogocytosis. EphrinBΔC from donor cells is trans-endocytosed into EphB+ responder cells. (C) Representative images showing forward trogocytosis in U251 cells (magenta dashed line, labeled with Cell-tracker) cocultured with ephrinB1ΔC-GFP+ donor HeLa cells (right panels, green dashed line), but not control GFP+ cells (left panels, green dashed line). Internalized ephrinB1ΔC vesicles in U251 cells were detected as green puncta void of surface HA-antibody labeling (arrows). Scale bars, 10 µm. (D) Validation of the interaction between endogenous Gulp1 and EphB2. U251 cells were first cocultured with either control GFP+ or ephrinB1ΔC-GFP+ HeLa cells for 30 min, and cell lysates were then subjected to immunoprecipitation by anti-EphB2 antibodies. (E) Representative images from live imaging of forward trogocytosis in HeLa cells. EphrinB1ΔC-mCherry+ donor cells were cocultured with responder cells expressing untagged EphB2 and GFP-Gulp1. Middle row: green dashed lines indicate the responder cell outline. Bottom rows show time course at time of contact and scission. Arrows indicate ephrinB1ΔC cluster formation and subsequent vesicle internalization. GFP-Gulp1 images pseudo-colored as heat maps (bottom row). Scale bars, 10 µm (top panel), 5 µm (inset), and 2 µm (time-lapse images). Elapsed time shown as min:s. (F) Average fluorescent intensities at contact sites of cluster formation (F′) and subsequent vesicles (F″) from time-lapse imaging of cocultures as described in E. Data displayed as heat maps of average intensity calculated over every event, with donor contact sites for each set aligned to top and center, and all images normalized to their respective background signal. Graphs show mean ± SEM of relative fluorescent units (RFU) changes through the central four pixels for the x axis. Data acquired from 32 events from 10 cells over two independent experiments. *, P < 0.05; **, P < 0.01; ***, P < 0.001; ns, not significant; one-way ANOVA with Bonferroni’s multiple comparisons test performed on GFP-Gulp1 signal.
Figure 2.
Figure 2.
Gulp1 regulates EphB2/ephrinB1 trogocytosis. (A) Western blot analysis shows efficient knockdown of endogenous Gulp1 expression and overexpression of siRNA-resistant myc-Gulp1 in HeLa cells. (B and C) Representative images (B) and quantification (C) showing Gulp1 is required for forward trogocytosis in HeLa cells. Responder cells (green dashed line) were treated with either mock or Gulp1 siRNA, then overexpressed with Flag-EphB2 and either siRNA-resistant myc-Gulp1 or myc as a control, before coculture with ephrinB1ΔC-mCherry+ donor cells (red dashed line). To determine internalized vesicles (red puncta), surface clusters (yellow puncta) were detected by antibody staining against Flag-EphB2 without permeabilization. Scale bars, 10 µm. Quantification results shown as mean ± SEM (n = 3 independent experiments, 6–12 responder cells per condition per experiment). Data normalized to median mock value per experiment. *, P < 0.05; **, P < 0.01; one-way ANOVA with Tukey’s multiple comparisons test. (D and E) Representative images (D) and quantification (E) showing manipulation of Gulp1 expression levels changes the preference of bi-directional EphB2/ephrinB1 trogocytosis in HeLa cells. Bi-directional trogocytosis was induced by coculturing Flag-EphB2-YFP+ cells (green dashed line) with ephrinB1-CFP+ cells (red dashed line). Combinations of Gulp1 knockdown and Gulp1 overexpression were set up as shown in E. White arrows indicate internalized vesicles (yellow puncta), and yellow arrows indicate surface clusters (blue puncta). Scale bars, 10 µm. The total pool of internalized YFP+/CFP+ vesicles within two opposing cells was counted, and the percentage of vesicles in EphB2+ cells (forward trogocytosis) was shown in the figure. The percentage of vesicles in ephrinB1+ cells (reverse trogocytosis) would be 100% minus the percentage of vesicles in EphB2+ cells (not shown). Results shown as mean ± SEM (n = 3 independent experiments, 6–11 responder-donor pairs per condition per experiment). *, P < 0.05; **, P < 0.01; ***, P < 0.001; one-way ANOVA with Tukey’s multiple comparisons test.
Figure 3.
Figure 3.
Gulp1ΔC serves as a dominant-negative protein blocking EphB2/ephrinB1 trogocytosis. (A and A′) Representative confocal image (A) and STED image (A′) of the same cell showing GFP-Gulp1ΔC specifically colocalizes with EphB2/ephrinB1 clusters (visualized by ephrinB1ΔC-mCherry signal, x-y resolution = 20 nm). Scale bars, 20 µm (A), 5 µm (A′, left panel), and 2 µm (A′, right panels). (B and C) Representative images (B) and quantification (C) showing Gulp1ΔC blocks forward trogocytosis in HeLa cells when enriched at EphB2/ephrinB1 clusters. Internalized vesicles detected by comparing total ephrinB1ΔC signal to surface signal. Arrows indicate GFP-Gulp1ΔC enrichment at ephrinB1ΔC clusters; asterisks indicate higher GFP-Gulp1ΔC signal in nucleus. Scale bars, 10 µm. Relative value of vesicles number per cell shown as mean ± SEM (n = 4 independent experiments, 25–40 responder cells per condition per experiment). Data normalized to median GFP value per experiment. The right two columns show the GFP-Gulp1ΔC condition separated into cells that either show GFP-Gulp1ΔC and ephrinB1ΔC colocalization (coloc), or not (no coloc). *, P < 0.05; ***, P < 0.001; ns, not significant; one-way ANOVA with Dunnett’s post hoc test. (D and E) Representative time-lapse images (D) and quantification (E) showing Gulp1ΔC blocks reverse trogocytosis in cultured cortical neurons. Scale bars, 10 µm. Elapsed time shown as min:s. Arrows indicate EphB2ΔC clusters or subsequent trogocytosed vesicles. Relative percentage of contacted neurons (indicated by EphB2 clusters) with internalized EphB2ΔC vesicles shown as mean ± SEM (n = 3 independent experiments, 4–13 neurons per condition per experiment). *, P = 0.0305, two-tailed unpaired t test. (F) Representative images showing Gulp1 is required for reverse trogocytosis in cultured cortical neurons. Neurons were labeled with βIII-tubulin antibodies. Internalized EphB2ΔC vesicles, indicated by white arrows (red puncta), were differentiated from surface EphB2ΔC clusters, indicated by yellow arrows (yellow puncta). Scale bars, 10 µm. (G) Western blot analysis showing efficient knockdown of endogenous Gulp1 expression in primary cultured neurons. (H) Quantification showing percentage of contacted neurons (indicated by EphB2 clusters) with internalized EphB2ΔC vesicles. **, P = 0.0015; two-tailed unpaired t test. (I) Quantification showing relative value of vesicles number per contacted neuron. Data normalized to median control value per experiment. Results shown as mean ± SEM (n = 3 independent experiments, 22–29 responder cells per condition per experiment). ***, P = 0.0009; two-tailed unpaired t test.
Figure 4.
Figure 4.
Gulp1 cooperates with Tiam2 to facilitate EphB2/ephrinB1 trogocytosis. (A and B) Representative images (A) and quantification (B) of coculture assays shows constitutively active Tiam2 (GFP-Tiam2ΔN) boosts the forward trogocytosis gain of function effect seen upon overexpression of Gulp1-FL. Responder cells (green dashed line) overexpressing Flag-EphB2 and myc-Gulp1 or myc (as a control), together with either GFP-Tiam2ΔN or GFP (as control), were cocultured with ephrinB1ΔC-mCherry+ donor cells (red dashed line). Scale bars, 10 µm. Relative values of vesicle numbers per cell shown as mean ± SEM (n = 3 independent experiments, 16–34 responder cells per condition per experiment). Data normalized to median GFP/myc value per experiment. ***, P < 0.001; ****, P < 0.0001; one-way ANOVA with Tukey’s multiple comparisons test. (C) Coimmunoprecipitation and Western blots analysis showing GFP-Tiam2ΔN (ΔN) enhances the interaction between Gulp1 and EphB2. HeLa cells were transfected with Flag-EphB2, in combination with either full-length myc-Gulp1 or myc-Gulp1ΔC, and either GFP-Tiam2ΔN or GFP. (D and E) Representative images (D) and quantification (E) of coculture assays showing GFP-Tiam2ΔN enhances Gulp1ΔC enrichment at ephrinB1ΔC clusters. Responder cells (green dashed lines) overexpressing Flag-EphB2 and myc-Gulp1ΔC, together with either GFP-Tiam2ΔN or GFP (as control), were cocultured with ephrinB1ΔC-mCherry+ donor cells (red dashed lines). Arrows indicate ephrinB1ΔC clusters. Percentage of cells with myc-Gulp1ΔC enrichment at ephrinB1ΔC clusters shown as mean ± SEM (n = 3 independent experiments, 17–32 responder cells per condition per experiment). **, P = 0.0099, two-tailed unpaired t test. (F) Quantification of coculture assays showing GFP-Tiam2ΔN potentiates inhibition of forward trogocytosis by Gulp1ΔC. *, P < 0.05; **, P < 0.01; ***, P < 0.001; ****, P < 0.0001; one-way ANOVA with Tukey’s multiple comparisons test.
Figure 5.
Figure 5.
Gulp1 regulates EphB2/ephrinB1 trogocytosis through dynamin. (A) Representative images showing Dyn2 enriches at ephrinB1 clusters during forward trogocytosis in HeLa cells. Responder cells (green dashed line) overexpressing Flag-EphB2 with WT Dyn2 (GFP-Dyn2) were cocultured with ephrinB1ΔC-mCherry+ donor cells (red dashed line). (B) Representative images showing endogenous Dyn2 and GFP-Gulp1 colocalize at ephrinB1 clusters during forward trogocytosis in HeLa cells. Responder cells (green dashed line) overexpressing Flag-EphB2 with GFP-Gulp1 were cocultured with ephrinB1ΔC-mCherry+ donor cells (red dashed line), and endogenous Dyn2 was immunostained. In A and B, white arrows indicate internalized vesicles and yellow arrows indicate surface clusters. (B′) Pearson’s correlation coefficient analysis for the colocalization between endogenous Dyn2 and GFP-Gulp1-FL or GFP-Gulp1ΔC, and between Life-Act and GFP-Gulp1ΔC at ephrinB1ΔC clusters for experiments described in B, C, and Fig. S3 D, respectively. Maximum fluorescence intensities of Dyn2, Life-Act, and GFP-Gulp1 or GFP-Gulp1ΔC within each ephrinB1ΔC cluster regions of interest were measured and normalized to their respective cell background signal. n = 3 independent experiments, 4–12 cells per experiment. *, P < 0.05, one-way ANOVA with Tukey’s multiple comparisons test. (C) Representative images showing Gulp1ΔC disrupts endogenous Dyn2 recruitment to ephrinB1 clusters. Responder cells (green dashed line) overexpressing Flag-EphB2 with GFP-Gulp1ΔC were cocultured with ephrinB1ΔC-mCherry+ donor cells (red dashed line) and endogenous Dyn2 was immunostained. Enlarged insets show reduced Dyn2 signal at ephrinB1 clusters with Gulp1ΔC colocalization (C′) compared with clusters without Gulp1ΔC colocalization (C″). Arrows indicate ephrinB1ΔC clusters. (D) Quantification of Dyn2 and Gulp1ΔC enrichment at ephrinB1 clusters. Maximal fluorescence intensities of Dyn2 and GFP-Gulp1ΔC within each ephrinB1 cluster regions of interest were measured and normalized to background (value from a region in the same responder cell without ephrinB1 clusters or vesicles). Each point represents an independent cluster. Threshold to indicate enrichment was set to 2.5 times that of background. n = 4 independent experiments, 4–10 cells per experiment. (E) Coimmunoprecipitation and Western blot analysis showing the formation of EphB2/Gulp1/Dyn2 complexes during forward trogocytosis, and Gulp1ΔC blocking recruitment of Dyn2 to EphB2 complexes. Responder HeLa cells expressing Flag-EphB2, in combination with myc (as a control [Con]), full-length myc-Gulp1 (FL), or myc-Gulp1ΔC (ΔC), were treated with either DMSO or Dyngo-4a before being cocultured with ephrinB1ΔC-mCherry+ donor cells. (F and G) Representative images (F) and quantification (G) showing inhibition of dynamin activity blocks forward trogocytosis in HeLa cells. Quantification results shown as mean ± SEM (n = 3 independent experiments, 9–20 responder cells per condition per experiment, normalized to median GFP+ DMSO value per experiment). *, P < 0.05; **, P < 0.01; one-way ANOVA with Tukey’s multiple comparisons test. Scale bars in A–C and F, 10 µm.
Figure 6.
Figure 6.
Gulp1 regulates the EphB2/ephrinB1-mediated cell disengagement response. (A–C) Time-lapse images (A and B) and quantification (C) showing expression of dominant-negative Gulp1ΔC inhibits EphB2/ephrinB1-mediated cell disengagement. HeLa cells expressing EphB2 and either GFP or GFP-Gulp1ΔC were cocultured with donor cells expressing ephrinB1ΔC-mCherry. Maximum projection of deconvolved images is shown. Scale bars, 10 µm. Elapsed time shown as min:s. Dashed lines indicate the distance between two contacting cells. Measured distance between donor and responder cells over time for each condition shown as mean ± SEM n = 20 (GFP-Gulp1ΔC) and 13 (GFP) donor–responder pairs from three experiments. ***, P < 0.001; two-way ANOVA.
Figure 7.
Figure 7.
Role of Gulp1 in Xenopus gastrulation. (A) Expression of XGulp1 protein in vegetal cells. Anti-Gulp1 antibody staining without or with knockdown by XGulp1-MO (left and middle panels) and localization of XGulp1-GFP (300 pg, the right panel). Scale bar, 50 µm. (B) Mid-sagittal fractures of Xenopus early gastrulae. The central endodermal blastocoel floor is curved in uninjected, XGulp1-GFP–injected, or XGulp1-MO/XGulp1-GFP–coinjected embryos, but straight in Gulp1ΔC expressing or XGulp1-MO gastrulae (dashed lines; XGulp1-MO, 30 ng; XGulp1-GFP, 900 pg). Red arrowheads, dorsal blastopore; BCR, blastocoel roof; LEM, leading edge mesendoderm that begins to advance on the BCR; V, endoderm of vegetal cell mass. Scale bar, 500 µm. (C) Curvature of blastocoel floor. Embryos from three independent experiments were measured by the Kappa plugin in ImageJ, and results were pooled for each treatment. (D) Explants of mid-sagittal slices of vegetal cell mass fixed immediately after excision (0 hr) and after onset of vegetal rotation (1 hr) uninjected (top) or after Gulp1ΔC mRNA injection (bottom). Yellow dashed lines, endodermal blastocoel floor surface. Average lengths of dashed lines from three independent experiments: 2,381.0 ± 254.5 µm for eight uninjected explants; 1,862.0 ± 285.5 µm for nine Gulp1ΔC mRNA injected explants. Red arrowheads, dorsal blastopore; green arrowheads, border between surface of embryo and blastocoel floor. Scale bar, 200 µm. (E) Cells in vegetal slice explants after injection of ephrinB1-mCherry mRNA alone or together with XGulp1-MO or XGulp1-MO and XGulp1-GFP. Amount of mRNA injected per blastomere is indicated. Explants from three sets of experiments were examined by confocal microscopy. Additional explants analyzed by conventional fluorescence microscopy gave the same results (not shown). White arrowheads point to retracting protrusions, yellow arrowheads to cell regions simultaneously enriched in vesicles and XGulp1-GFP. Scale bars, 50 µm (left) and 30 µm (right). (F and G) Number of intracellular dots per cell. Asterisks indicate significance levels: ****, P < 0.0001; not significant, P = 0.286; two-tailed Student’s t test.
Figure 8.
Figure 8.
Models comparing Eph/ephrin trogocytosis to apoptotic phagocytosis and classical trogocytosis. Schematic representation of molecular pathways mediating phagocytosis (A), Eph/ephrin-mediated trogocytosis (B), and immune and germ cell trogocytosis (C) showing that Eph/ephrin-mediated trogocytosis shares both similarities (highlighted in green) and distinct properties (blue) with both processes. In all three instances, a Rac-GEF (Tiam2 in the case of Eph/ephrin trogocytosis) activates Rac GTPase to mediate the actin polymerization required for membrane rearrangement essential for internalizing large structures. Furthermore, all three pathways recruit dynamin, required for membrane scission and thereby allowing for internalization. However, in the cases of phagocytosis and Eph/ephrin trogocytosis, the engulfment protein Gulp1 is essential for dynamin recruitment, while it is not required in a classical trogocytosis setting. Moreover, in the case of Eph/ephrin trogocytosis, the stable Gulp1/EphB2 complex requires an active GEF (again using Tiam2) before dynamin recruitment. Dotted lines indicate indirect evidence.

Comment in

References

    1. Abdu Y., Maniscalco C., Heddleston J.M., Chew T.L., and Nance J.. 2016. Developmentally programmed germ cell remodelling by endodermal cell cannibalism. Nat. Cell Biol. 18:1302–1310. 10.1038/ncb3439 - DOI - PMC - PubMed
    1. Arandjelovic S., and Ravichandran K.S.. 2015. Phagocytosis of apoptotic cells in homeostasis. Nat. Immunol. 16:907–917. 10.1038/ni.3253 - DOI - PMC - PubMed
    1. Astin J.W., Batson J., Kadir S., Charlet J., Persad R.A., Gillatt D., Oxley J.D., and Nobes C.D.. 2010. Competition amongst Eph receptors regulates contact inhibition of locomotion and invasiveness in prostate cancer cells. Nat. Cell Biol. 12:1194–1204. 10.1038/ncb2122 - DOI - PubMed
    1. Batlle E., and Wilkinson D.G.. 2012. Molecular mechanisms of cell segregation and boundary formation in development and tumorigenesis. Cold Spring Harb. Perspect. Biol. 4:a008227 10.1101/cshperspect.a008227 - DOI - PMC - PubMed
    1. Cayuso J., Xu Q., and Wilkinson D.G.. 2015. Mechanisms of boundary formation by Eph receptor and ephrin signaling. Dev. Biol. 401:122–131. 10.1016/j.ydbio.2014.11.013 - DOI - PubMed

Publication types