. 2019 Nov 7;134(19):1619-1631.
doi: 10.1182/blood.2019001234.

Chromatin occupancy and epigenetic analysis reveal new insights into the function of the GATA1 N terminus in erythropoiesis

Affiliations

Chromatin occupancy and epigenetic analysis reveal new insights into the function of the GATA1 N terminus in erythropoiesis

Te Ling et al. Blood. .

Abstract

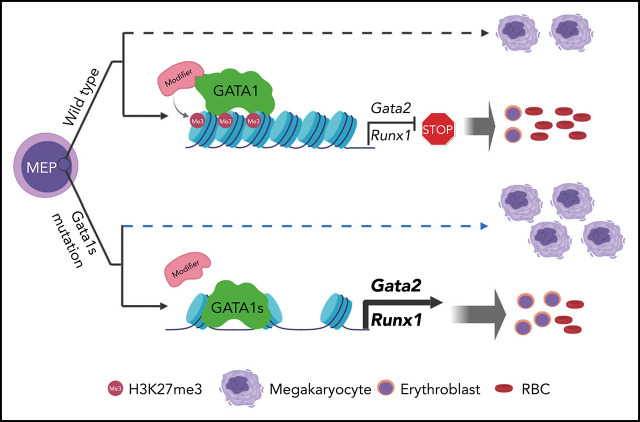
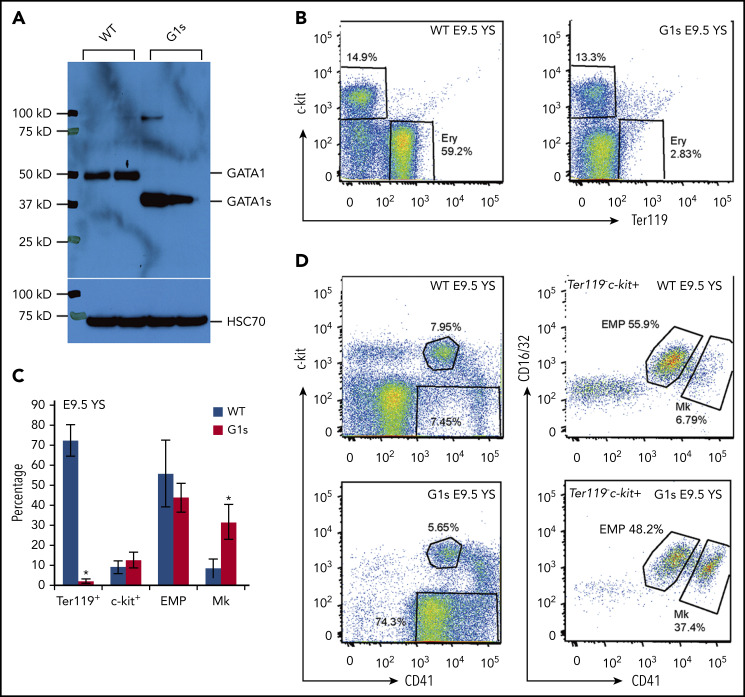
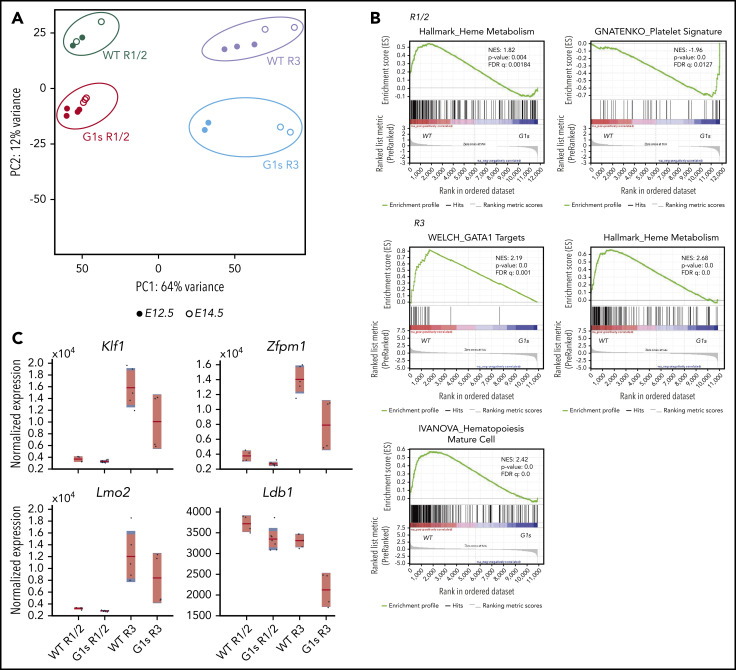
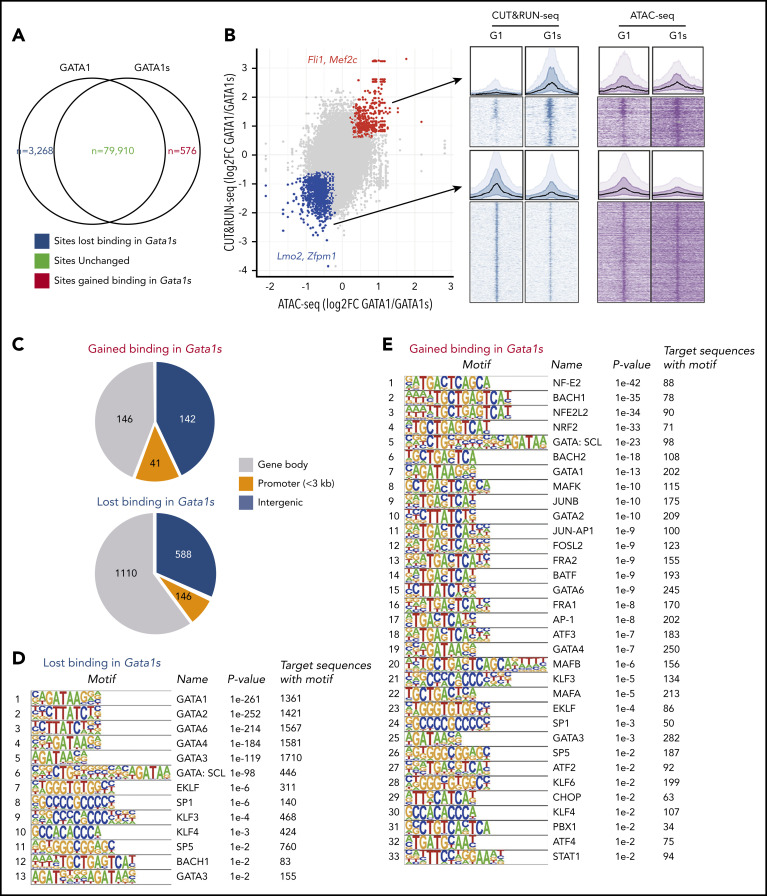
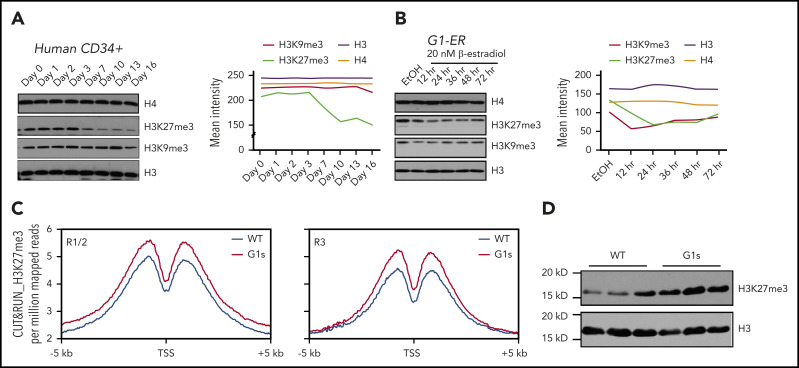
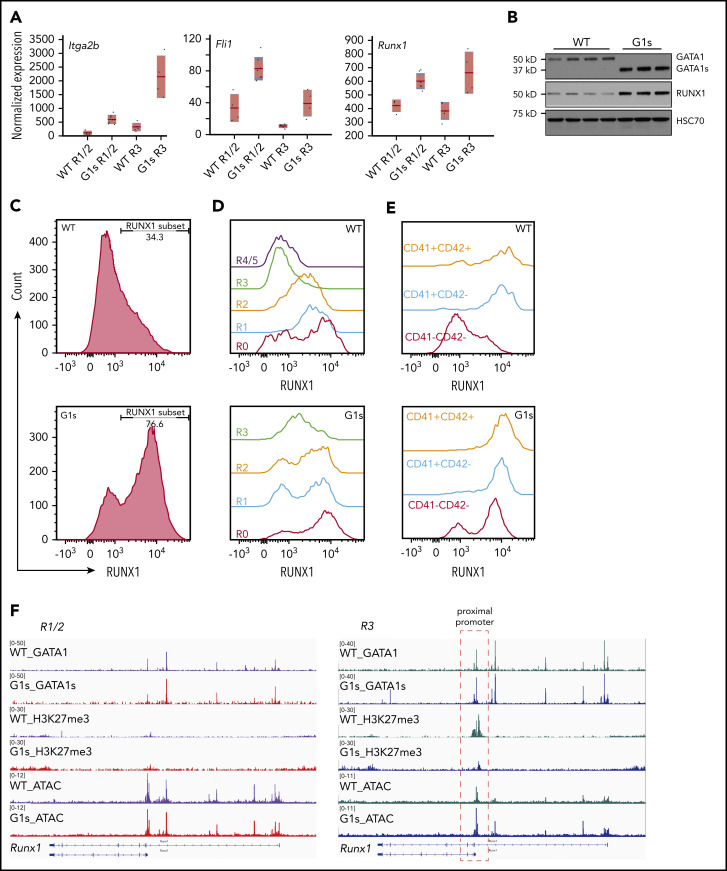
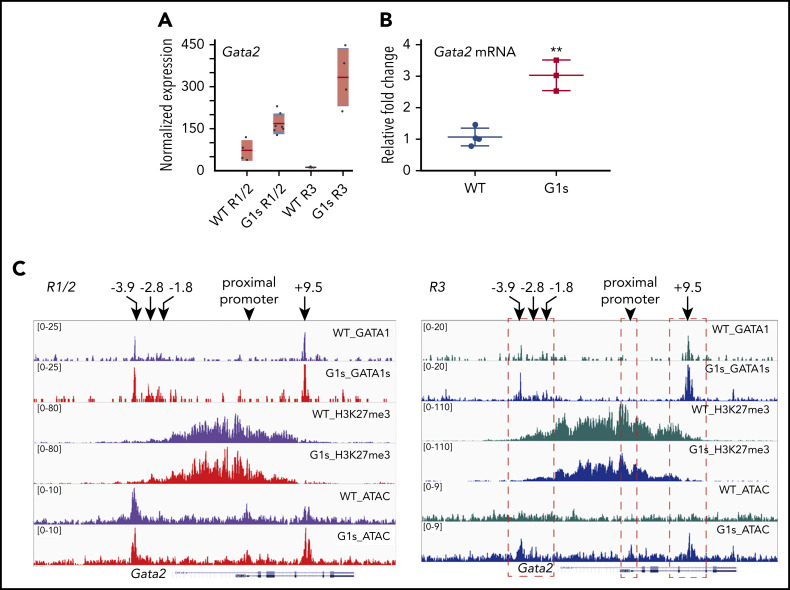
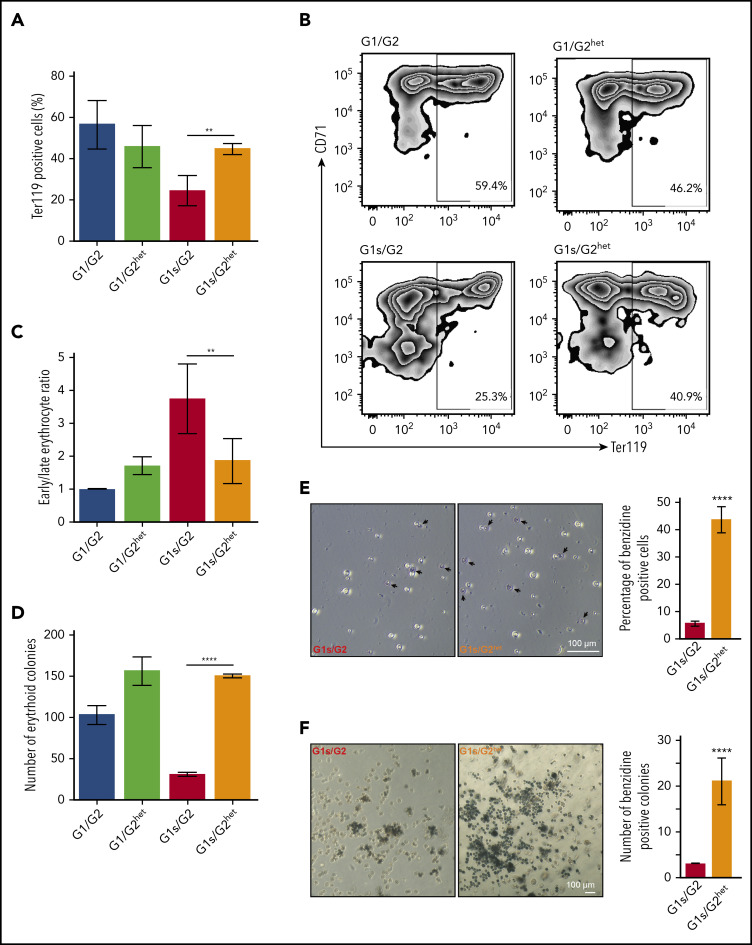
Mutations in GATA1, which lead to expression of the GATA1s isoform that lacks the GATA1 N terminus, are seen in patients with Diamond-Blackfan anemia (DBA). In our efforts to better understand the connection between GATA1s and DBA, we comprehensively studied erythropoiesis in Gata1s mice. Defects in yolks sac and fetal liver hematopoiesis included impaired terminal maturation and reduced numbers of erythroid progenitors. RNA-sequencing revealed that both erythroid and megakaryocytic gene expression patterns were altered by the loss of the N terminus, including aberrant upregulation of Gata2 and Runx1. Dysregulation of global H3K27 methylation was found in the erythroid progenitors upon loss of N terminus of GATA1. Chromatin-binding assays revealed that, despite similar occupancy of GATA1 and GATA1s, there was a striking reduction of H3K27me3 at regulatory elements of the Gata2 and Runx1 genes. Consistent with the observation that overexpression of GATA2 has been reported to impair erythropoiesis, we found that haploinsufficiency of Gata2 rescued the erythroid defects of Gata1s fetuses. Together, our integrated genomic analysis of transcriptomic and epigenetic signatures reveals that, Gata1 mice provide novel insights into the role of the N terminus of GATA1 in transcriptional regulation and red blood cell maturation which may potentially be useful for DBA patients.


Figures

None
Graphical abstract
Figure 1.
Figure 1.
Impaired yolk sac erythropoiesis in Gata1s embryos. (A) Western blot to detect the expression of GATA1 full length (GATA1) in WT embryos and the short isoform (GATA1s) in Gata1s mutant embryos (G1s). Cell lysates were extracted from E13.5 total fetal liver cells. Heat shock protein family A member 8 (HSC70) is shown as a loading control. (B) Flow cytometry assessment of the erythroid (Ery) population in E9.5 yolk sac (YS) using double-staining with antibodies against c-kit and Ter119. (C) Bar graph depicting mean (± SD) percentages of Ter119 positive, c-kit positive, EMP) and megakaryocyte (Mk) populations from yolk sacs of E9.5 WT and G1s as determined by flow cytometry. N ≥ 3. (D) Representative flow cytometry plots of EMPs and Mk stained with antibodies against c-kit, CD16/32 (FcγRIII and II), Ter119, and CD41. *P ≤ .05 (unpaired Student t test).
Figure 2.
Figure 2.
Dysregulation of gene expression in Gata1s mutant erythroid cells. (A) PCA of global gene expression changes as determined by RNA-seq of R1/2- and R3-sorted erythroblasts from WT and G1s at days E12.5 (●) and E14.5 (○). (B) GSEA of differentially expressed genes in WT R1/2 vs G1s R1/2, or WT R3 vs G1s R3 erythroid cells. NES, normalized enrichment score; FDR, false discovery rate. (C) Boxplots showing the normalized expression of selected erythroid lineage genes from the RNA-seq. The red horizontal line indicates the mean normalized expression, the light red box represents the 95% confidence interval for the mean, and the blue box represents ± 1 SD.
Figure 3.
Figure 3.
Loss of the N terminus of GATA1 alters its chromatin occupancy. (A) Venn diagram showing the numbers of binding sites of GATA1 full-length vs GATA1s in E13.5 erythroid cells as determined by CUT&RUN-seq of the endogenous GATA1 proteins. The absence of the N terminus did not alter binding to 79 910 sites (gray), but resulted in gain of GATA1s binding on 576 sites (red) and decreased GATA1s binding on 3268 sites (blue). (B) Integration of CUT&RUN-seq and ATAC-seq data highlights changes in occupancy and accessibility. A total of 329 of the 576 gained sites (red; eg, Fli1 and Mef2c loci) also gained chromatin accessibility, whereas 1844 sites (blue) that lost binding (eg, Lmo2 and Zfpm1 loci) also showed reduced chromatin accessibility. Aggregated binding signals are shown above the heatmaps for gained and lost sites by CUT&RUN-seq and ATAC-seq, respectively. (C) Pie charts showing the distribution of sites that were gained or lost by GATA1s. The rank lists of binding motifs of sites that lost (D) or gained (E) binding of GATA1s.
Figure 4.
Figure 4.
Perturbed H3K27 methylation in Gata1s mutant erythroid cells. (A) Western blot depicting the levels of H3K27me3 and H3K9me3 at different days of erythroid cell maturation from human CD34 cells. Total H3 and total H4 are shown as loading controls. The intensity of the bands was measured with ImageJ (right). (B) H3K27me3 and H3K9me3 levels were assayed in G1-ER cells at different time points following induction of differentiation by 20 nM β-estradiol. The intensity of the bands was measured with ImageJ (right). (C) Metaplots of H3K27me3 CUT&RUN signal comparing WT and Gata1s E13.5 erythroid cells plotted across a 10-kb window; the y-axis indicates depth per million mapped reads. (Left) R1/R2 population; (right) R3 population. (D) Western blot of the levels of H3K27me3 in fetal liver cells from WT and Gata1s E13.5 embryos.
Figure 5.
Figure 5.
RUNX1 expression is aberrantly elevated in Gata1s erythroid cells. (A) Boxplots depicting the normalized expression of selected megakaryocyte lineage genes as determined by RNA-seq. The red horizontal line indicates the mean normalized expression, the light-red box represents the 95% confidence interval for the mean, and the blue box represents ± 1 SD. (B) Western blot of GATA1/GATA1s, RUNX1, and HSC70 in WT and G1s erythroid cells. Cell lysates were extracted from E13.5 total fetal liver cells. Each lane represents a different embryo. HSC70 is provided as a loading control. Fetal liver cells were isolated from E12.5 embryos and stained with erythroid surface markers (CD71 and Ter119) or megakaryocyte surface markers (CD41 and CD42), then assessed for RUNX1 expression by intracellular flow cytometry. Data from total fetal liver cells (C), individual stages of erythropoiesis (R0-R4/5) (D), and megakaryocytes (CD41CD42 > CD41+CD42 > CD41+CD42+) (E) are shown. (F) Tracks of CUT&RUN-seq data corresponding to GATA1, GATA1s, and H3K27me3 as well as ATAC-seq at the Runx1 locus. Histograms were normalized to account for differences in the number of reads per library. The red dashed box (right) highlights the changes in recruitment of H3K27me3 and differential chromatin accessibility (ATAC-seq) at GATA1/GATA1s binding sites in the Runx1 proximal promoter.
Figure 6.
Figure 6.
GATA2 is overexpressed in Gata1s erythroid cells. RNA-seq (A) and RT-qPCR (B) confirming the increased expression of GATA2 in G1s erythroid cells. Total mRNA was extracted from E13.5 fetal liver cells for RT-qPCR. (C) Tracks depicting CUT&RUN-seq of GATA1, GATA1s, and H3K27me3 as well as ATAC-seq at the genomic locus of Gata2 in the R1/2 and R3 populations. Histograms were normalized to account for differences in the number of reads per library. Four well-studied regulatory elements (−3.9 kb, −2.8 kb, −1.8 kb, and +9.5 kb) and the proximal promoter of Gata2 are indicated by arrows. Red dashed boxes (right) highlight the changes in H3K27me3 and differential chromatin accessibility (ATAC-seq) at GATA1/GATA1s-binding sites and the Gata2 proximal promoter. **P ≤ .01 (unpaired Student t test).
Figure 7.
Figure 7.
Haploinsufficiency of Gata2 improves erythropoiesis in Gata1s embryos. (A) Bar graph depicts the mean percentage of Ter119 expressing fetal liver cells from Gata1/Gata2 (G1/G2), Gata1/Gata2het (G1/G2het), Gata1s/Gata2 (G1s/G2), and Gata1s/Gata2het (G1s/G2het) embryos. (N > 3). (B) Representative flow cytometry plots of CD71/Ter119 erythroid staining of fetal liver cells isolated from male embryos of each genetic background. (C) Bar graph depicting the mean ratio of early erythroblasts (Ter119+/CD71+) vs late differentiated erythroid cells (Ter119+/CD71) in panel B. (D) E12.5 fetal liver cells were isolated and cultured in methylcellulose medium supplemented with EPO to support erythroid colony formation. Bar graph represents the number of BFU-E of each of the genotypes. Mean ± SD are shown (N = 3). (E) Representative images of fetal liver erythroid cells after benzidine staining. Arrows indicate dark stained hemoglobin-containing cells. Bar graph represents mean number of benzidine stained cells out of the total fetal liver cells counted for each genotype. (F) Representative images of colonies from G1s/G2 and G1s/G2het. A total of 5000 E12.5 fetal liver cells were cultured in methylcellulose supplemented with EPO and colonies were stained with benzidine. Dark staining indicates hemoglobin-containing colonies. Bar graph depicts mean number of benzidine-stained colonies from each genotype. **P ≤ .01, ****P ≤ .0001 (unpaired Student t test). Original magnification ×10 (E) and ×4 (F).

Comment in

  • The long and the short of it.
    Bodine DM. Bodine DM. Blood. 2019 Nov 7;134(19):1565-1566. doi: 10.1182/blood.2019002983. Blood. 2019. PMID: 31698422 Free PMC article. No abstract available.

References

    1. Crispino JD, Horwitz MS. GATA factor mutations in hematologic disease. Blood. 2017;129(15):2103-2110. - PMC - PubMed
    1. Balduini CL, Pecci A, Loffredo G, et al. . Effects of the R216Q mutation of GATA-1 on erythropoiesis and megakaryocytopoiesis. Thromb Haemost. 2004;91(1):129-140. - PubMed
    1. Yu C, Niakan KK, Matsushita M, Stamatoyannopoulos G, Orkin SH, Raskind WH. X-linked thrombocytopenia with thalassemia from a mutation in the amino finger of GATA-1 affecting DNA binding rather than FOG-1 interaction. Blood. 2002;100(6):2040-2045. - PMC - PubMed
    1. Nichols KE, Crispino JD, Poncz M, et al. . Familial dyserythropoietic anaemia and thrombocytopenia due to an inherited mutation in GATA1. Nat Genet. 2000;24(3):266-270. - PMC - PubMed
    1. Freson K, Matthijs G, Thys C, et al. . Different substitutions at residue D218 of the X-linked transcription factor GATA1 lead to altered clinical severity of macrothrombocytopenia and anemia and are associated with variable skewed X inactivation. Hum Mol Genet. 2002;11(2):147-152. - PubMed

Publication types