. 2019 Oct;181(2):774-788.
doi: 10.1104/pp.19.00877. Epub 2019 Aug 13.

AtNDB2 Is the Main External NADH Dehydrogenase in Mitochondria and Is Important for Tolerance to Environmental Stress

Affiliations

AtNDB2 Is the Main External NADH Dehydrogenase in Mitochondria and Is Important for Tolerance to Environmental Stress

Crystal Sweetman et al. Plant Physiol. 2019 Oct.

Abstract

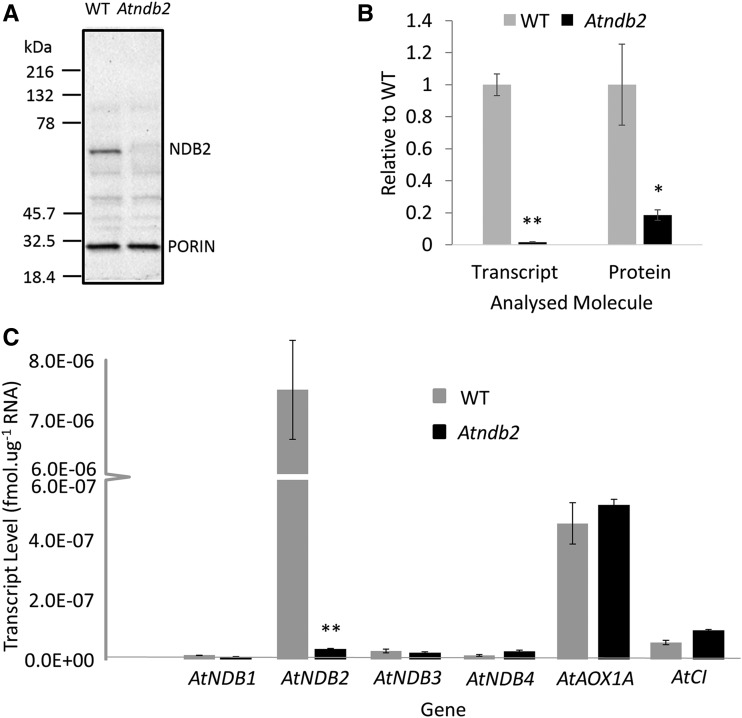
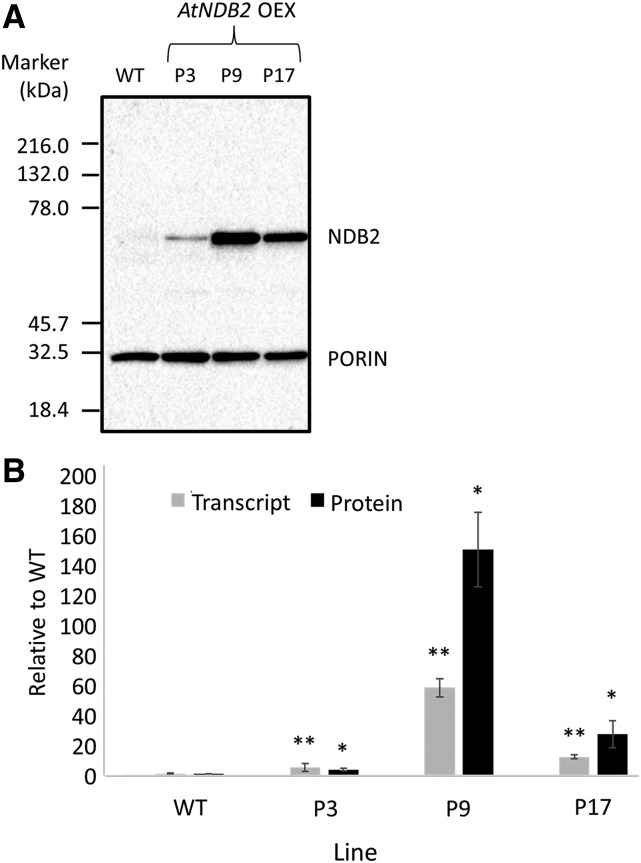
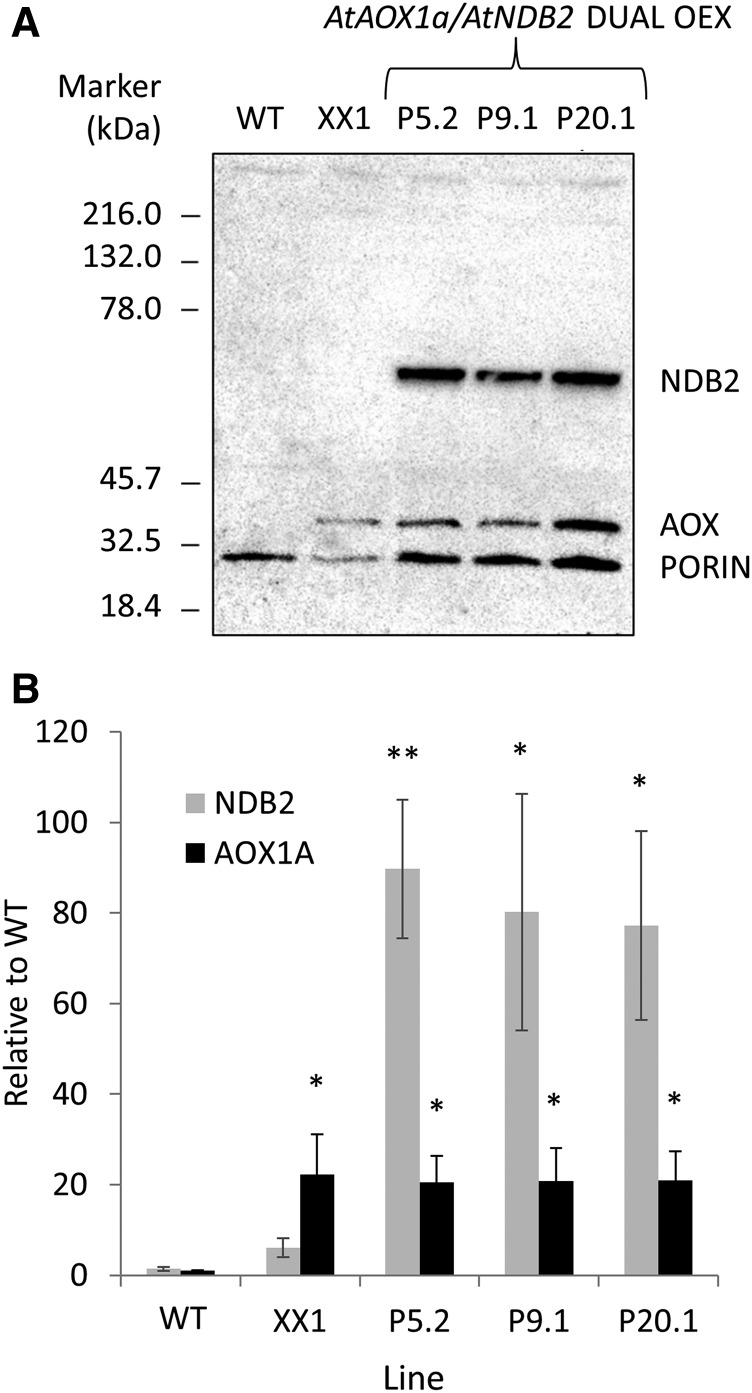
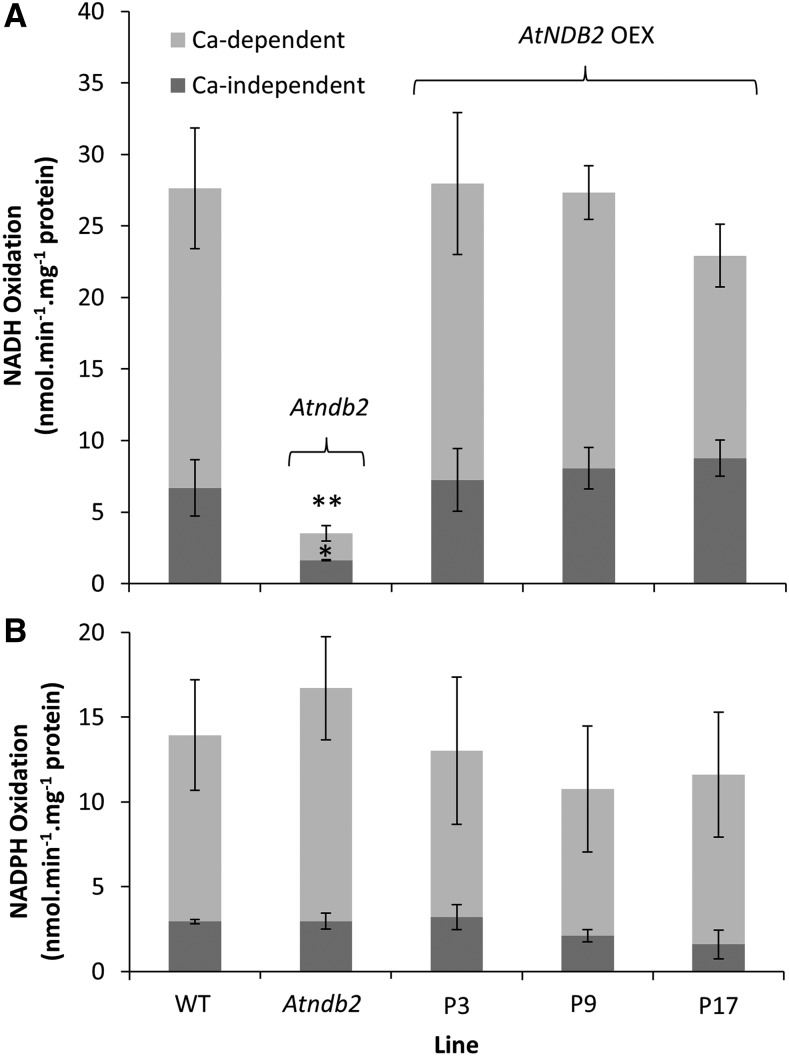
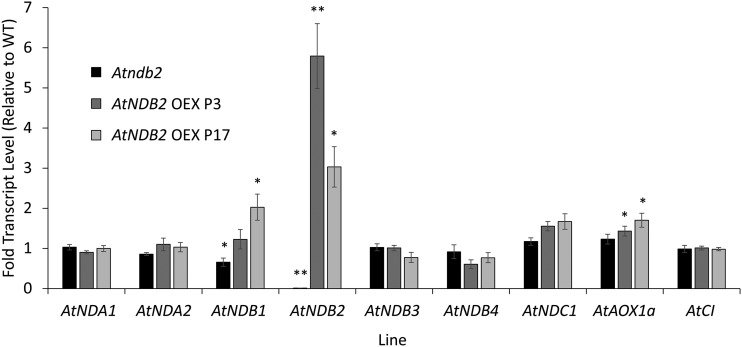
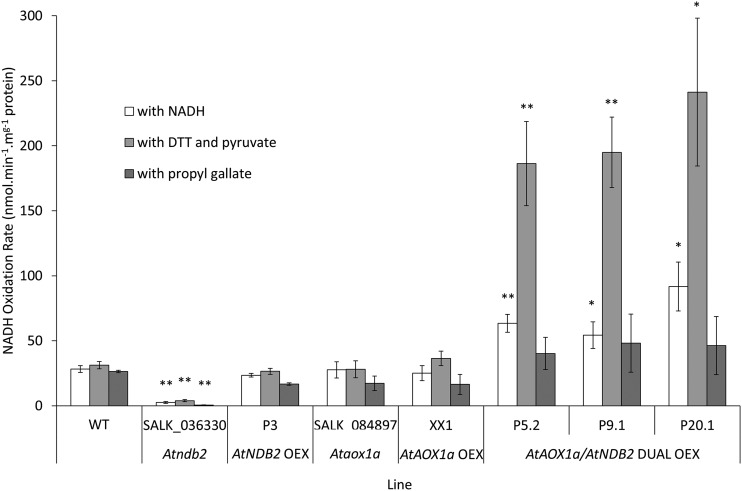
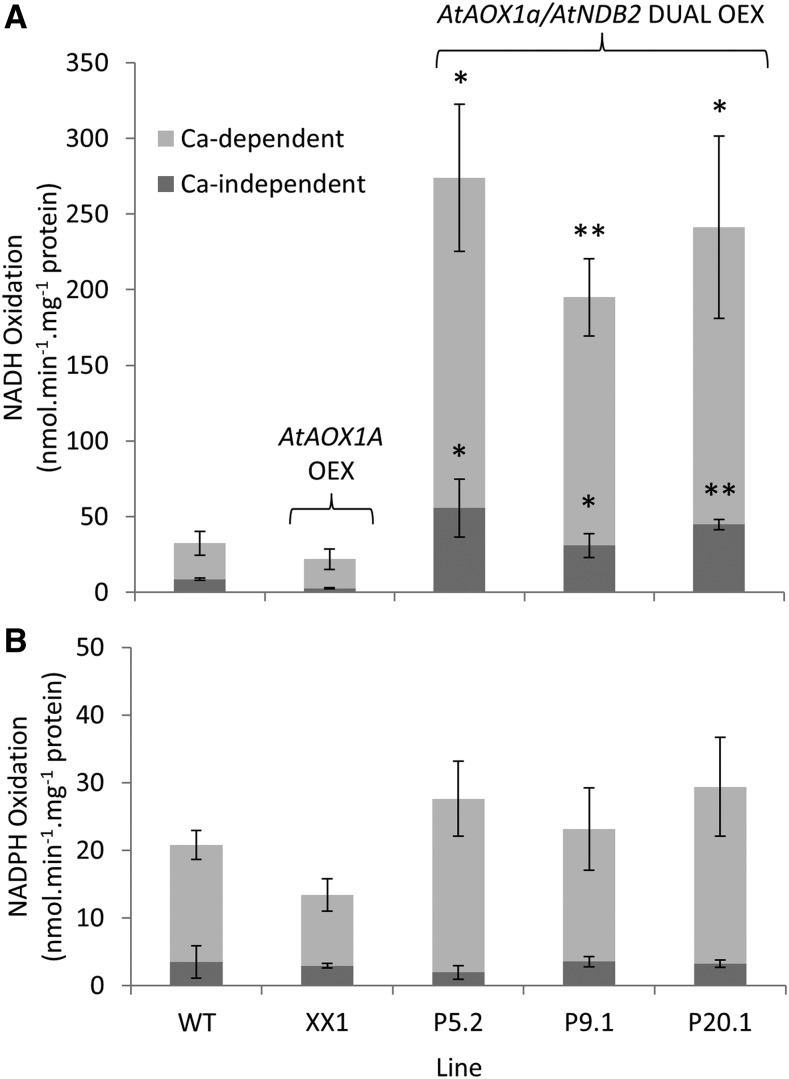
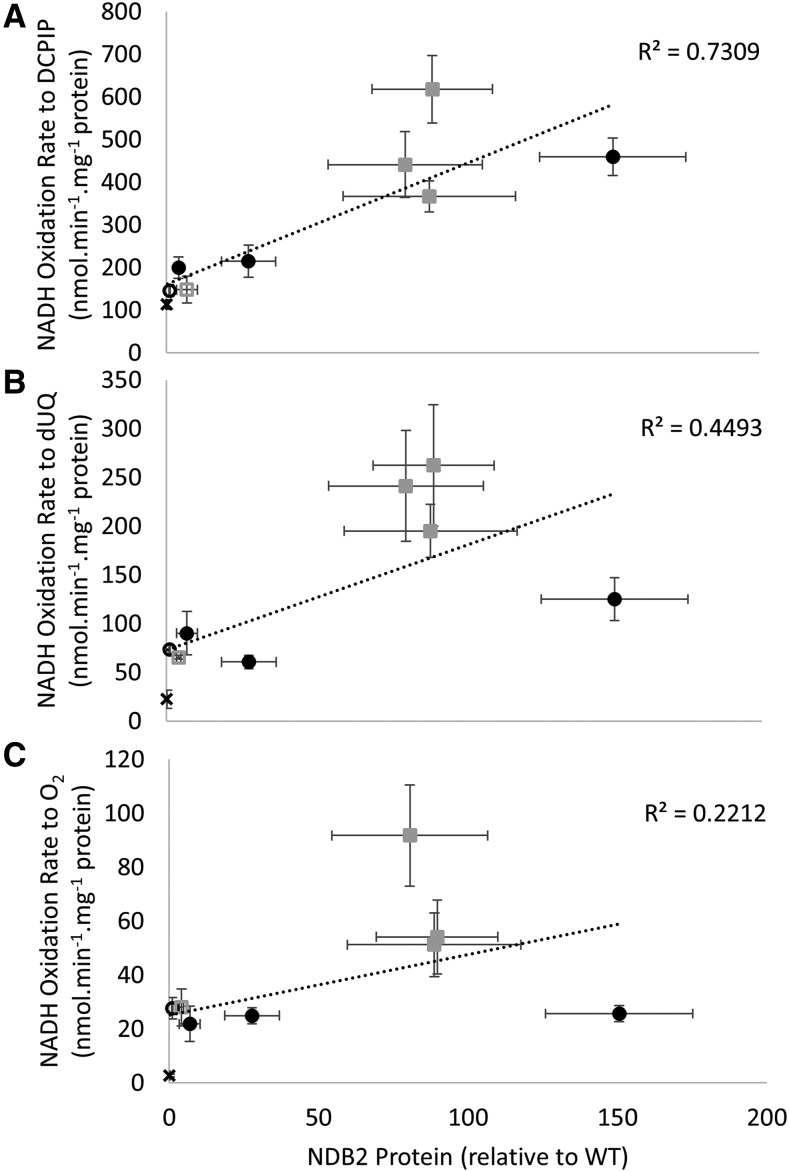
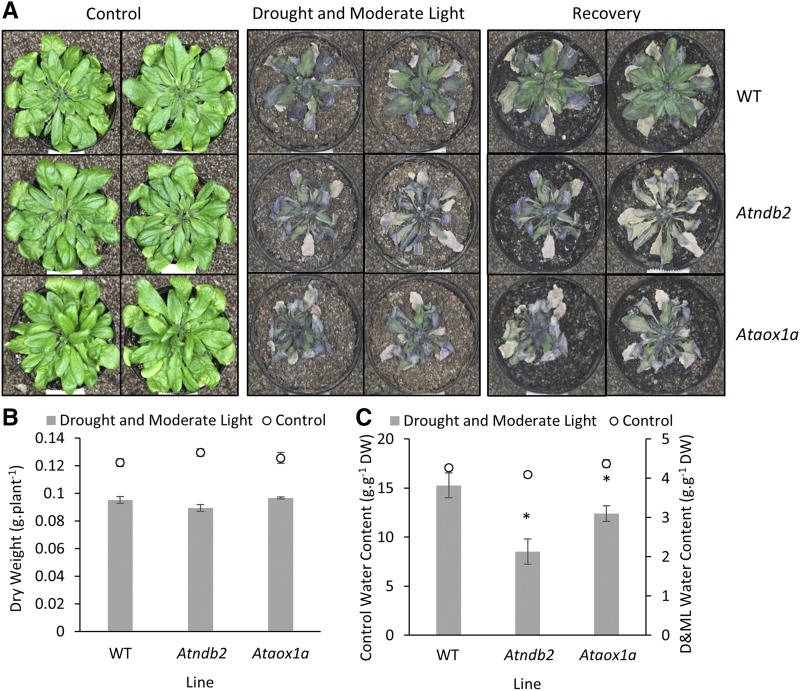
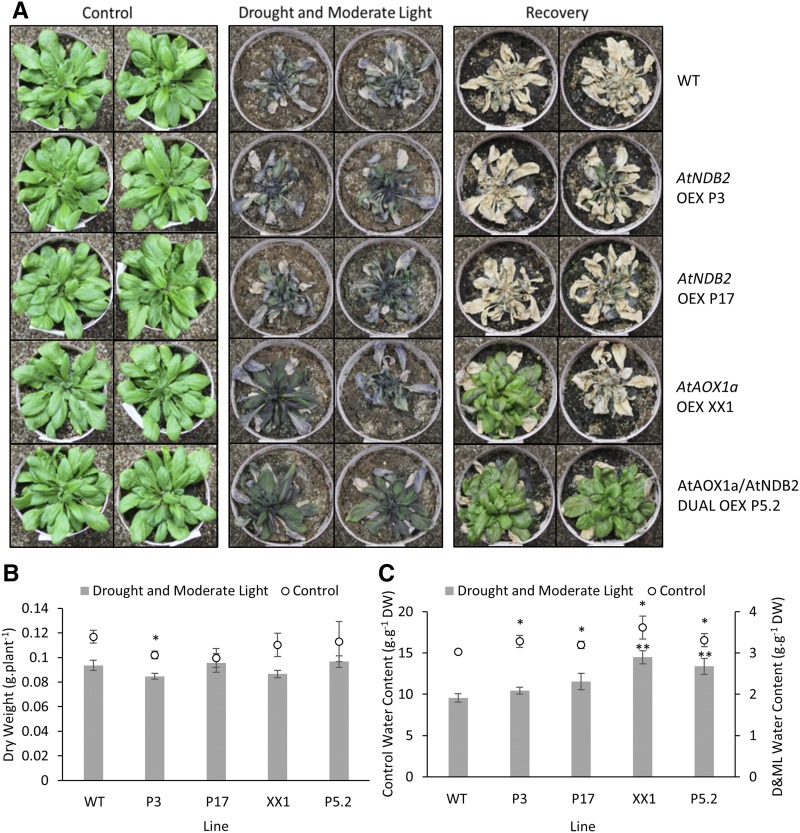
In addition to the classical electron transport pathway coupled to ATP synthesis, plant mitochondria have an alternative pathway that involves type II NAD(P)H dehydrogenases (NDs) and alternative oxidase (AOX). This alternative pathway participates in thermogenesis in select organs of some species and is thought to help prevent cellular damage during exposure to environmental stress. Here, we investigated the function and role of one alternative path component, AtNDB2, using a transgenic approach in Arabidopsis (Arabidopsis thaliana). Disruption of AtNDB2 expression via T-DNA insertion led to a 90% decrease of external NADH oxidation in isolated mitochondria. Overexpression of AtNDB2 led to increased AtNDB2 protein abundance in mitochondria but did not enhance external NADH oxidation significantly unless AtAOX1A was concomitantly overexpressed and activated, demonstrating a functional link between these enzymes. Plants lacking either AtAOX1A or AtNDB2 were more sensitive to combined drought and elevated light treatments, whereas plants overexpressing these components showed increased tolerance and capacity for poststress recovery. We conclude that AtNDB2 is the predominant external NADH dehydrogenase in mitochondria and together with AtAOX1A forms a complete, functional, nonphosphorylating pathway of electron transport, whose operation enhances tolerance to environmental stress. This study demonstrates that at least one of the alternative NDs, as well as AOX, are important for the stress response.


Figures

Figure 1.
Figure 1.
Molecular characterization of the Atndb2 T-DNA insertion line. Plants were grown for 3 weeks on agar plates, then a portion of shoot tissue was frozen for RNA extraction and the remaining shoot tissue was used for mitochondrial isolation. A, Example of a western blot for AtNDB2 (63 kD) and porin (31 kD) using 8 μg of purified mitochondrial protein. B, AtNDB2 transcript and protein levels in the Atndb2 T-DNA lines compared with the wild-type (WT) background. Transcript or protein levels were first normalized to a reference gene or protein (see “Materials and Methods”), then the mean value for the wild type was set to 1. C, Absolute transcript levels of all external-facing NDs (AtNDB1–AtNDB4) as well as AtAOX1A and a subunit of complex I (AtCI) in the wild type and the Atndb2 T-DNA line. Each replicate corresponds to a separate batch of plants used for mitochondrial isolations (n = 4 ± se). *, P < 0.05, **, P < 0.005 (unpaired, two-tailed Student’s t test).
Figure 2.
Figure 2.
Molecular characterization of AtNDB2 overexpression lines. Plants were grown for 3 weeks on agar plates, then a portion of shoot tissue was frozen for RNA extraction and the remaining shoot tissue was used for mitochondrial isolation. A, Example of a western blot for AtNDB2 (63 kD) and porin (31 kD) using 8 μg of purified mitochondrial protein. B, AtNDB2 transcript and protein levels in the AtNDB2 overexpression lines (P3, P9, and P17) compared with the wild-type background (WT). Transcript or protein levels were first normalized to a reference gene or protein (see “Materials and Methods”), then the mean value for the wild type was set to 1. Each replicate corresponds to a separate batch of plants used for mitochondrial isolations (n = 3 ± se). *, P < 0.05, **, P < 0.005 (unpaired, two-tailed Student’s t test).
Figure 3.
Figure 3.
Molecular characterization of dual AtAOX1A and AtNDB2 overexpression lines. Plants were grown for 3 weeks on agar and then used for mitochondrial isolation. A, Example of a western blot for AtNDB2 (63 kD), AtAOX (36 kD), and porin (31 kD) using 8 μg of purified mitochondrial protein. B, AtNDB2 and AtAOX protein levels in the dual overexpression lines (P5.2, P9.1, and P20.1) compared with the wild type (WT) and the single AOX1A overexpression background (XX1). Protein levels were first normalized to porin, and the mean value for the wild type was set to 1. Each replicate corresponds to a separate batch of plants used for mitochondrial isolations (n = 3 ± se). *, P < 0.05, **, P < 0.005 (unpaired, two-tailed Student’s t test).
Figure 4.
Figure 4.
Effects of AtNDB2 disruption and overexpression on NADH and NADPH oxidation rates by purified mitochondria. Plants of the wild type (WT), Atndb2 T-DNA (SALK_036330), and AtNDB2 overexpression lines (P3, P9, and P17) were grown for 3 weeks on agar and then used for mitochondrial isolation. Assays were carried out with purified mitochondria in a cuvette, with oxygen as the electron acceptor and either NADH (A) or NADPH (B) as the electron donor. Ca-independent activity was measured in the presence of 0.25 mm EGTA. Ca-dependent activity was calculated as the rate in the presence of 2 mm CaCl2 minus the Ca-independent rate. Each replicate corresponds to a separate batch of plants used for mitochondrial isolations (n = 3–4 ± se). *, P < 0.05, **, P < 0.005 (unpaired, two-tailed Student’s t test against the wild type).
Figure 5.
Figure 5.
Effects of AtNDB2 disruption and overexpression on transcript levels of type II dehydrogenase genes and AtAOX1a and AtCI. Plants were grown hydroponically in a growth cabinet for 6 weeks under control conditions (22°C, 80–120 μmol m−2 s−1, 16/8-h day/night periods). Each replicate consisted of a single, whole rosette. Transcripts of all NDs (AtNDA1 and AtNDA2, AtNDB1AtNDB4, and AtNDC1) were normalized to two reference genes, Ubiquitin and Pdf2; therefore, values represent relative units (n = 6 ± se). *, P < 0.05, **, P < 0.005 (unpaired, two-tailed Student’s t test). WT, Wild type.
Figure 6.
Figure 6.
Effects of AOX activation on NADH oxidation rates by purified mitochondria with various AtNDB2 and AtAOX1A expression levels. Plants of the wild type (WT), Atndb2 T-DNA (SALK_036330), AtNDB2 overexpression line (P3), Ataox1a T-DNA (SALK_084897), and dual overexpression lines (P5.2, P9.1, and P20.1) were grown for 3 weeks on agar and then used for mitochondrial isolation. Assays were carried out in a cuvette with oxygen as the electron acceptor and NADH (0.2 mm) as the electron donor in the presence of ADP (1 mm) and CaCl2 (2 mm), with subsequent additions of dithiothreitol (DTT; 1 mm) and pyruvate (5 mm) to activate AOX and propyl gallate (0.25 mm) to inhibit AOX. Each replicate corresponds to a separate batch of plants used for mitochondrial isolations (n = 3 ± se). *, P < 0.05, **, P < 0.005 (unpaired, two-tailed Student’s t test).
Figure 7.
Figure 7.
Biochemical characterization of dual overexpression lines. Plants of the wild type (WT), AtAOX1a overexpression line (XX1), and dual overexpression lines (P5.2, P9.1, and P20.1) were grown for 3 weeks on agar and then used for mitochondrial isolation. Spectrophotometric assays were carried out in a spectrophotometer with oxygen as the electron acceptor and either 0.2 mm NADH (A) or NADPH (B) as the electron donor. Pyruvate (5 mm) and DTT (1 mm) were present in all cases. Ca-independent activity was measured in the presence of EGTA (0.5 mm). Ca-dependent activity was calculated as the rate in the presence of CaCl2 (2 mm) minus the Ca-independent rate. Each replicate corresponds to a separate batch of plants used for mitochondrial isolations (n = 3–4 ± se). *, P < 0.05, **, P < 0.005 (unpaired, two-tailed Student’s t test against the wild type).
Figure 8.
Figure 8.
Relationship between AtNDB2 protein content and NADH oxidation rates with different electron acceptors. Plants were grown for 3 weeks on agar and then used for mitochondrial isolation. Purified mitochondria were assayed in a quartz cuvette in a spectrophotometer. All assays were conducted in a final volume of 1 mL, with standard reaction medium (SRM) supplemented with NADH (0.2 mm), ADP (1 mm), CaCl2 (2 mm), and either DCPIP (0.1 mm; A), decylubiquinone (dUQ; 40 µm; B), or no artificial electron acceptor (C). Different markers represent different lines, including the wild type (WT; open circles), AtNDB2 overexpression lines (closed circles), AtAOX1a overexpression line XX1 (open squares), and AtAOX1a/AtNDB2 dual overexpression lines (closed squares). NADH oxidation rates for the Atndb2 T-DNA line (shown by X on the axis) are given to indicate background NADH oxidation rates that may represent remaining external NADH dehydrogenase activities, matrix-facing NADH dehydrogenase activities, or outer membrane NADH dehydrogenase activities, particularly for the DCPIP rates, which were measured with thawed mitochondria (a malate dehydrogenase latency assay for inner membrane integrity showed that these mitochondria were 70% intact). Data represent means of separate mitochondrial preparations used in enzyme assays or western blots (n = 3 ± se).
Figure 9.
Figure 9.
Dual overexpression of AtAOX1A and AtNDB2 reversed early growth delays observed with individual AtAOX1A or AtNDB2 overexpression. Measurements were performed for 14 d using plants grown on agar (A and B) or for 44 d using plants grown in soil (C and D). All plants were grown in a growth room at 22°C with 14-h daylength and photosynthetically active radiation (PAR) of 100 to 150 μmol m−2 s−1, using Sylvania Luxline Plus T5 fluoro lights. A, Roots were measured every day after complete emergence of the cotyledon (n = 16–19 ± se). Values found to be statistically significant (P < 0.05; unpaired, two-tailed Student’s t test against the wild type [WT]) were as follows: day 3, P3, P17, and 084; day 4, P3, P9, and P17; day 5, P17 and 084; day 6, P17; day 7, P17 and 084; day 8, P17; day 9, P17, 330, and 084; day 10, P17, 330, and 084; day 11, P17, 330, and 084; day 12, P17; day 13, P17 and 330; day 14 XX1, P3, P17, 330, and 084. B, Secondary roots were counted at 14 d using a light microscope (n = 16–19 ± se). Bars not sharing a common letter are statistically significantly different from each other (P < 0.001; unpaired, two-tailed Student’s t test). C, Growth stages were recorded based on the milestones outlined by Boyes et al. (2001); n = 7–16 ± se). D, Plant height was measured after bolting and measurements continued until plant height had plateaued (n = 7–23 ± se). Values found to be statistically significant (P < 0.01; unpaired, two-tailed Student’s t test against the wild type) were as follows: day 4, 084; day 5, 084; day 6, 084; day 7, 084; day 8, 20.1 and 084; day 9, 20.1 and 084; day 10, 084; day 11, XX1, P3, 9.1, and 084; day 12, 9.1 and 084; day 13, XX1, P3, 9.1, and 084; day 14, P3, 9.1, and 084; day 15, 5.2, 9.1, and 084; day 16, 5.2, 20.1, and 084; day 17, 20.1 and 084; day 18, 20.1; day 19, XX1, P3, and 20.1; day 20, 20.1; day 21, 20.1.
Figure 10.
Figure 10.
Effects of drought and moderate-light treatment on plants containing AtNDB2 or AtAOX1a T-DNA insertions. Plants of the wild type (WT), Atndb2 T-DNA, and Ataox1a T-DNA lines were grown in a controlled-temperature growth cabinet at 22°C with 16-h daylength and PAR of 80 to 120 μmol m−2 s−1 using custom-made panels of red and blue light-emitting diode (LED) light modules (Phoenix Biosystems). The position of each pot was rotated daily. After 36 d, water was withheld, with continued pot rotation. After 6 d, plants were transferred to moderate light (300 μmol m−2 s−1), with drought continued in the same manner for a further 6 d, at which point plants were either harvested or rewatered and returned to control growth conditions to check recovery. A, Photographs of representative plants grown under control conditions (left), at the end of the drought and moderate-light treatment (middle), and after 14 d of recovery (right). B and C, Dry weights (DW; B) and water contents (C) of plants harvested at the end of the drought and moderate-light treatment (n = 4 ± se). *, P < 0.05 (unpaired, two-tailed Student’s t tests compared with the wild type).
Figure 11.
Figure 11.
Effects of extended drought and moderate-light treatment on plants overexpressing AtNDB2 and/or AtAOX1a. Plants of the wild type (WT), AtNDB2 overexpression lines (P3 and P17), AtAOX1a overexpression line (XX1), and dual overexpression line (P5.2) were grown in a controlled-temperature growth cabinet at 22°C with 16-h daylength and PAR of 80 to 120 μmol m−2 s−1 using custom-made panels of red and blue LED light modules (Phoenix Biosystems). The position of each pot was rotated daily. After 32 d, water was withheld, with continued pot rotation. After 6 d, plants were transferred to moderate light (300 μmol m−2 s−1), with drought continued in the same manner for a further 7 d (i.e. a slightly prolonged stress, compared with Fig. 10), at which point plants were either harvested or rewatered and returned to control growth conditions to check recovery. A, Photographs of representative plants grown under control conditions (left), at the end of the drought and moderate-light treatment (middle), and after 14 d of recovery (right). B and C, Dry weights (DW; B) and water contents (C) of plants harvested at the end of the drought and moderate-light treatment (n = 4 ± se). *, P < 0.05 (unpaired, two-tailed Student’s t tests compared with the wild type).

References

    1. Armstrong AF, Badger MR, Day DA, Barthet MM, Smith PMC, Millar AH, Whelan J, Atkin OK (2008) Dynamic changes in the mitochondrial electron transport chain underpinning cold acclimation of leaf respiration. Plant Cell Environ 31: 1156–1169 - PubMed
    1. Arnholdt-Schmitt B, Costa JH, de Melo DF (2006) AOX: A functional marker for efficient cell reprogramming under stress? Trends Plant Sci 11: 281–287 - PubMed
    1. Bartoli CG, Yu J, Gómez F, Fernández L, McIntosh L, Foyer CH (2006) Inter-relationships between light and respiration in the control of ascorbic acid synthesis and accumulation in Arabidopsis thaliana leaves. J Exp Bot 57: 1621–1631 - PubMed
    1. Boyes DC, Zayed AM, Ascenzi R, McCaskill AJ, Hoffman NE, Davis KR, Görlach J (2001) Growth stage-based phenotypic analysis of Arabidopsis: A model for high throughput functional genomics in plants. Plant Cell 13: 1499–1510 - PMC - PubMed
    1. Carrie C, Murcha MW, Kuehn K, Duncan O, Barthet M, Smith PM, Eubel H, Meyer E, Day DA, Millar AH, et al. (2008) Type II NAD(P)H dehydrogenases are targeted to mitochondria and chloroplasts or peroxisomes in Arabidopsis thaliana. FEBS Lett 582: 3073–3079 - PubMed

Publication types

MeSH terms

LinkOut - more resources