. 2019 Aug 13;12(594):eaau1468.
doi: 10.1126/scisignal.aau1468.

Muscle-generated BDNF is a sexually dimorphic myokine that controls metabolic flexibility

Affiliations

Muscle-generated BDNF is a sexually dimorphic myokine that controls metabolic flexibility

Xiuying Yang et al. Sci Signal. .

Abstract

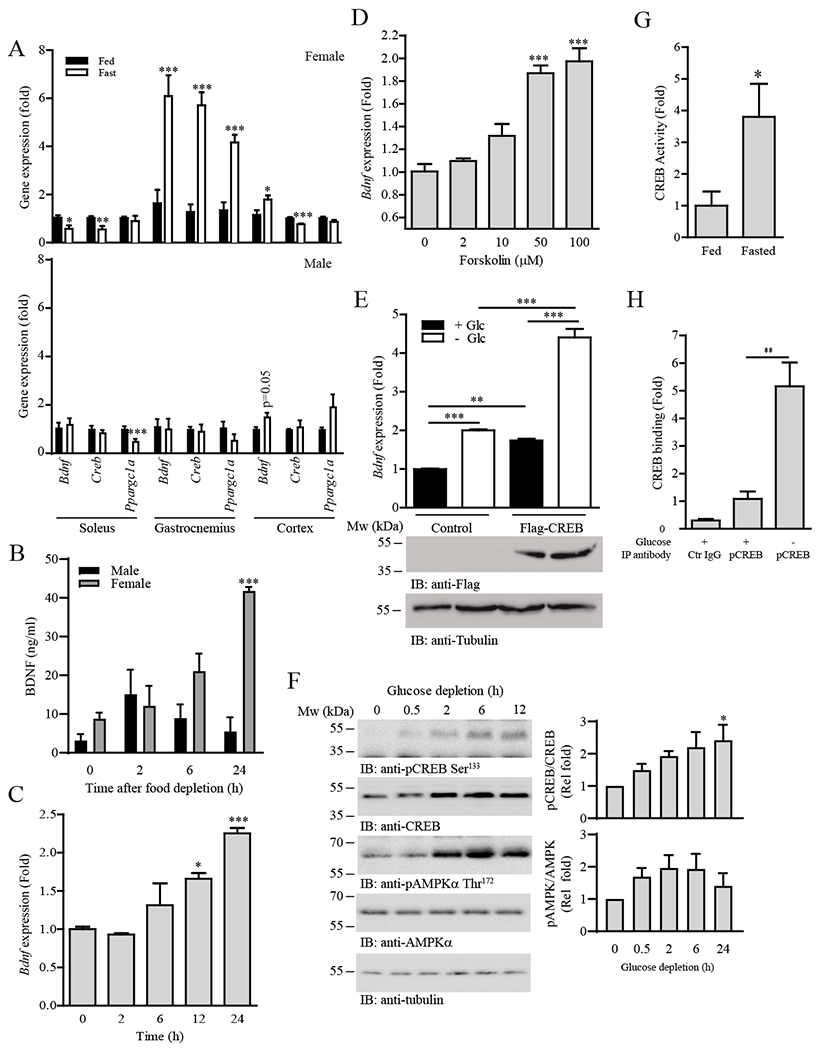
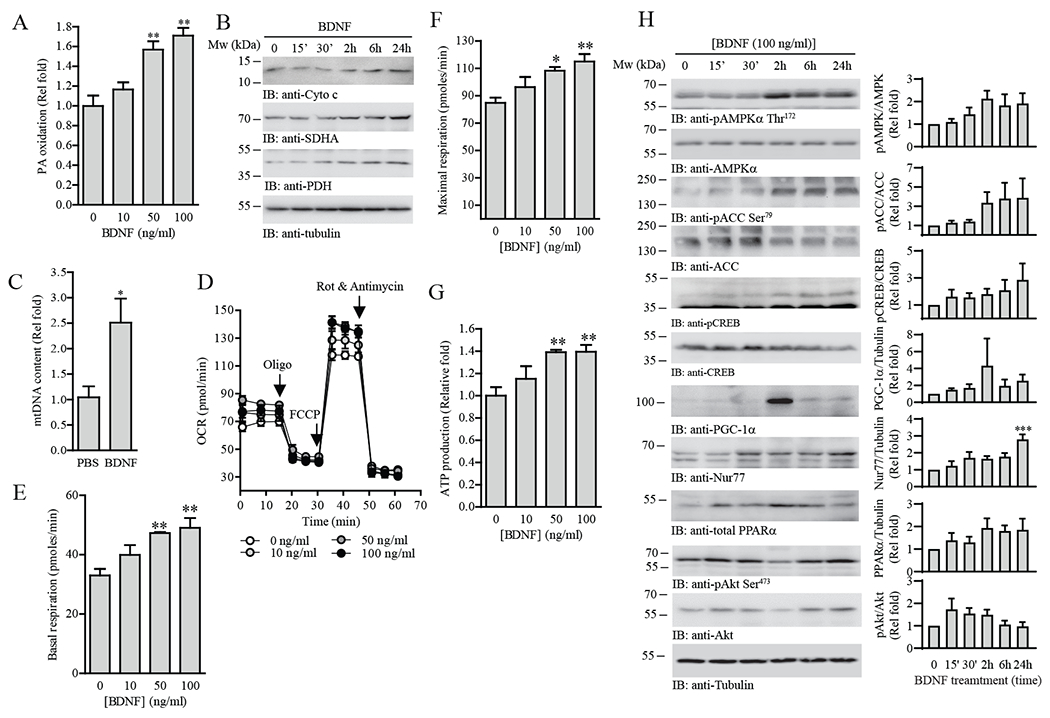
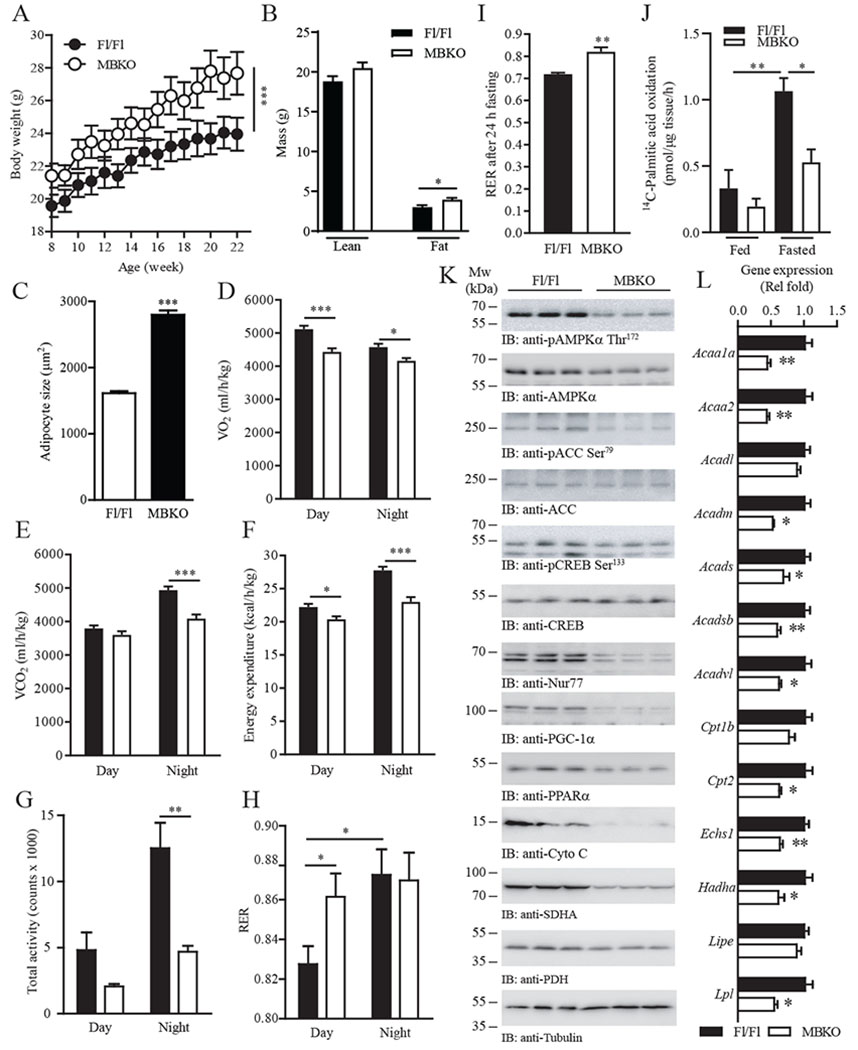
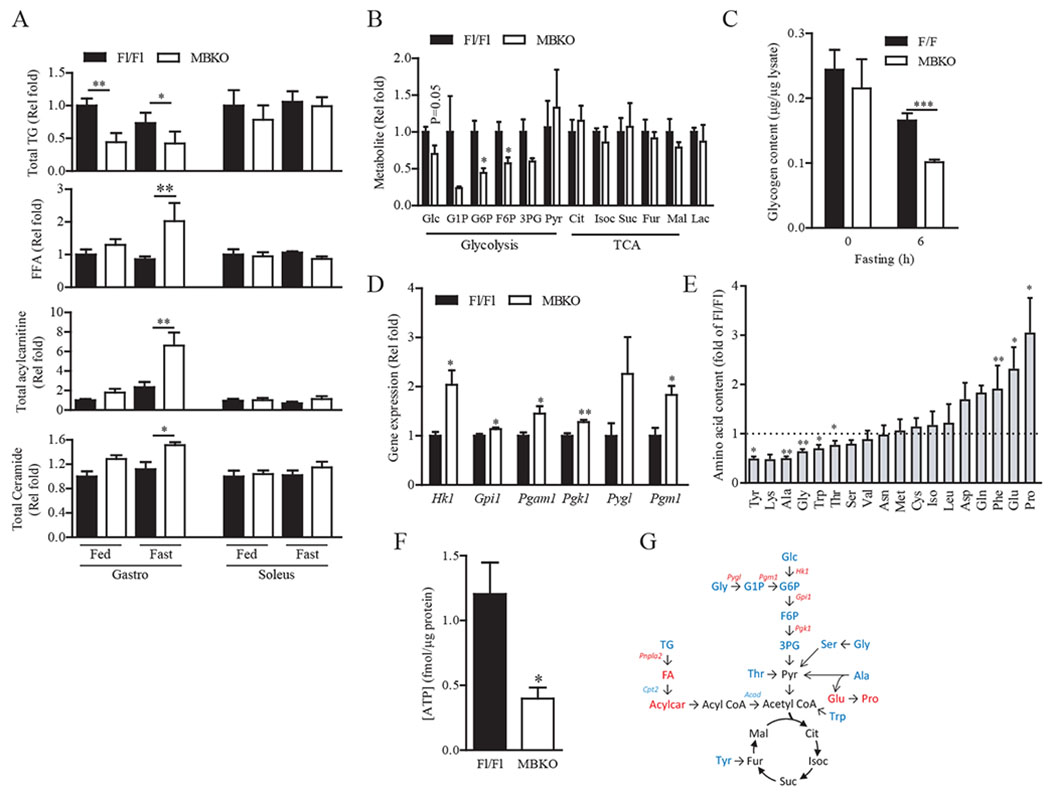
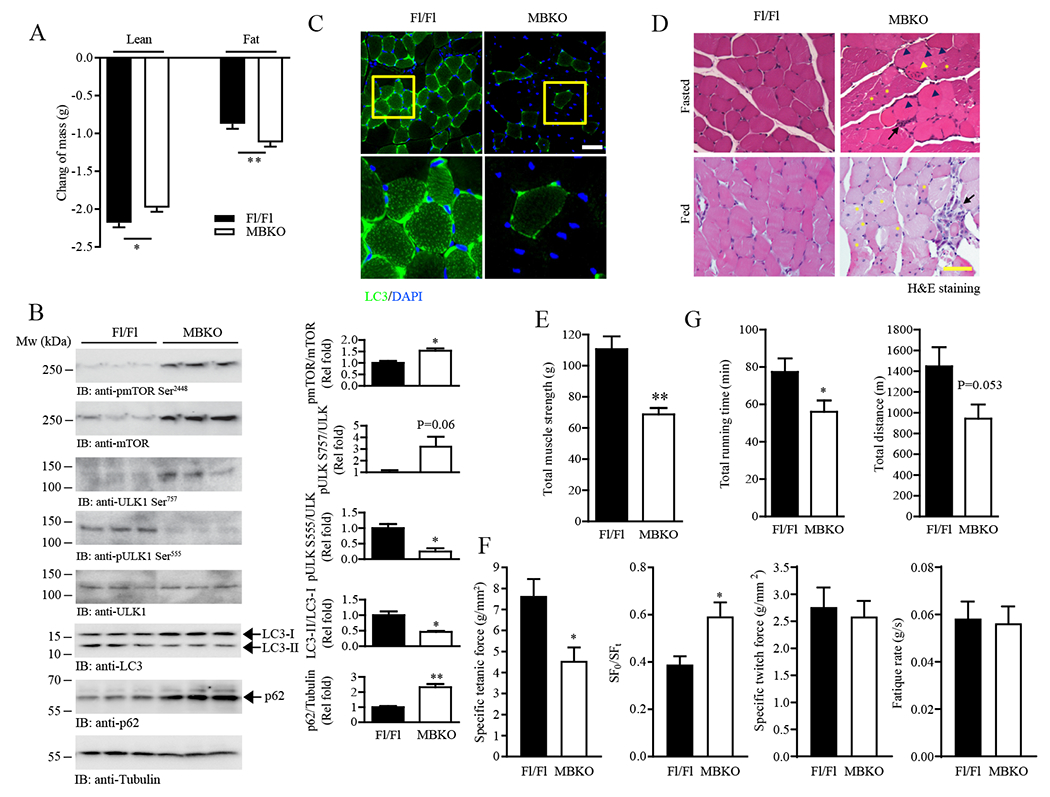
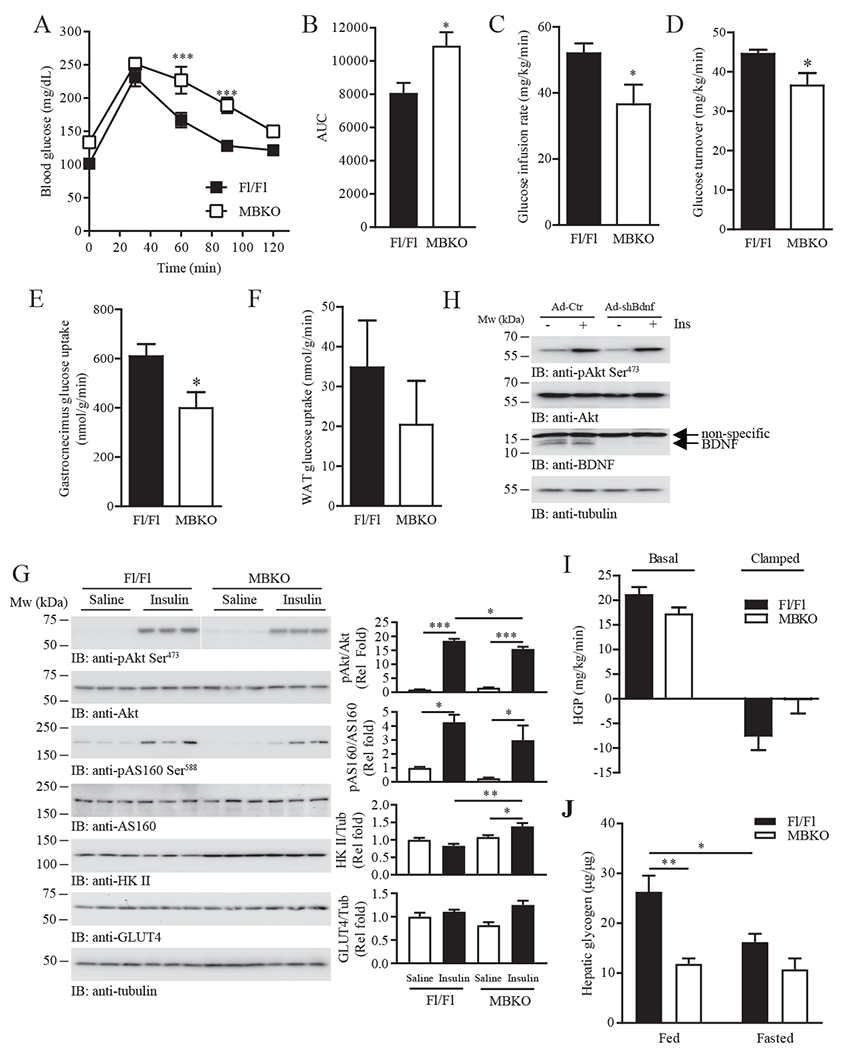
The ability of skeletal muscle to switch between lipid and glucose oxidation for ATP production during metabolic stress is pivotal for maintaining systemic energy homeostasis, and dysregulation of this metabolic flexibility is a dominant cause of several metabolic disorders. However, the molecular mechanism that governs fuel selection in muscle is not well understood. Here, we report that brain-derived neurotrophic factor (BDNF) is a fasting-induced myokine that controls metabolic reprograming through the AMPK/CREB/PGC-1α pathway in female mice. Female mice with a muscle-specific deficiency in BDNF (MBKO mice) were unable to switch the predominant fuel source from carbohydrates to fatty acids during fasting, which reduced ATP production in muscle. Fasting-induced muscle atrophy was also compromised in female MBKO mice, likely a result of autophagy inhibition. These mutant mice displayed myofiber necrosis, weaker muscle strength, reduced locomotion, and muscle-specific insulin resistance. Together, our results show that muscle-derived BDNF facilitates metabolic adaption during nutrient scarcity in a gender-specific manner and that insufficient BDNF production in skeletal muscle promotes the development of metabolic myopathies and insulin resistance.


Conflict of interest statement

CONFLICT OF INTEREST

The authors declare that they have no competing interests.

Figures

Fig. 1.
Fig. 1.
Fasting induces Bdnf expression in glycolytic muscle through CREB signaling. (A) Real-time PCR of Bdnf, Creb, and Ppargc1a (which encodes PGC-1α) expression in various mouse tissues after fasting (24 h); n = 4–5 mice per group. *P < 0.05, ***P < 0.001 compared to fed; Student’s t-test. (B) Circulating BDNF concentration in wild-type mice after fasting for various time intervals; n = 5–6 mice per group. ***P < 0.001 compared to 0 h of the same sex; one-way ANOVA. (C) Bdnf expression in C2C12 myotubes after glucose depletion for various time intervals; n = 4 independent experiments. *P < 0.05, ***P < 0.001 compared to 0 h; one-way ANOVA. (D) Real-time PCR of Bdnf expression in C2C12 myotubes stimulated with different concentrations of forskolin for 24 h; n = 4 independent experiments. ***P < 0.001 compared to 0 µM; one-way ANOVA. (E) Real-time PCR (top panel) of Bdnf expression in C2C12 myotubes transfected with empty vector (Control) or FLAG-tagged CREB (Flag-CREB) and cultured in glucose-free medium (24 h). The abundance of FLAG-CREB and tubulin were determined by immunoblotting (middle and bottom panels); n = 3 independent experiments. **P < 0.01, ***P < 0.01; two-way ANOVA. (F) C2C12 myotubes were cultured in glucose-free medium for the indicated time points and immunoblotted for phosphorylated CREB and AMPK and total CREB, AMPKα, and tubulin. The immunoblots are representative of three independent experiments. Quantification is shown in the right panel. *P < 0.05 compared to 0 h; one-way ANOVA. (G) Wild-type mice were fasted for 24 h. Gastrocnemius muscles were collected and the DNA binding activity of CREB was examined by ELISA; n = 4 mice per group. *P < 0.05; Student’s t-test. (H) Genomic DNA and associated proteins were collected from C2C12 myotubes cultured in normal or glucose-free medium for 24 h. ChIP assay was performed using control IgG (Ctr IgG) or anti-CREB, and the associated Bdnf promoter was detected using real-time PCR; n = 4 independent experiments. **P < 0.01; Student’s t-test.
Fig. 2.
Fig. 2.
BDNF increases mitochondrial content, cellular respiration, and lipid oxidation in muscle cells. (A) Palmitic (PA) oxidation in C2C12 myotubes treated with the indicated concentrations of BDNF for 24 h was measured with an extracellular flux analyzer; n = 4 independent experiments. **P < 0.01 compared to 0 ng/mL; one-way ANOVA. (B) Immunoblotting of the mitochondrial protein content in C2C12 myotubes treated with BDNF (100 ng/mL) for the indicated time points. Immunoblots are representative of two independent experiments. (C) Real-time PCR of mitochondrial DNA in C2C12 myotubes treated with BDNF (100 ng/mL, 24 h). Results were normalized to genomic DNA content; n = 3 independent experiments. *P < 0.05; Student’s t-test. (D) OCR traces for BDNF-stimulated (24 h) C2C12 myotubes; n = 4 independent experiments. Oligo, oligomycin. Rot, rotenone. (E) Basal respiration, (F) maximal respiration, and (G) ATP production of C2C12 myotubes treated with different concentrations of BDNF (10–100 ng/mL) for 24 h; n = 4 independent experiments. *P < 0.05, **P < 0.01 compared to 0 ng/mL; one-way ANOVA. (H) Analysis of various signaling pathways in C2C12 myotubes stimulated by BDNF (100 ng/mL) for the indicated time points. The phosphorylated and total abundance of the indicated proteins was determined by immunoblotting. Immunoblots are representative of three independent experiments. Quantification is shown in the right panel; n = 3 experiments. *P < 0.05 compared to 0 h; one-way ANOVA.
Fig. 3.
Fig. 3.
Deficiency in muscle-derived BDNF impairs systemic energy metabolism. (A) Growth curve of female Fl/Fl and MBKO mice fed a chow diet; n = 10 mice per group. ***P < 0.01; two-way repeated measures ANOVA. (B) Total lean and fat mass of 28-week-old female Fl/Fl and MBKO mice; n = 6 mice per group. *P < 0.01; Student’s t-test. (C) Adipocyte size in inguinal WAT collected from 28-week-old female Fl/Fl and MBKO mice; n = 5–6 mice per group. ***P < 0.01; Student’s t-test. (D to H) Daily oxygen consumption (VO2) (D), daily CO2 production (VCO2) (E), daily energy expenditure (F), daily locomotion (G), and average RER (H) of 28-week-old female MBKO mice; n = 6 mice per group. *P < 0.05, **P < 0.01, ***P < 0.001; Student’s t-test. (I) RER of 28-week-old female Fl/Fl and MBKO mice after fasting (24 h); n = 5 mice per group. **P < 0.01; Student’s t-test. (J) FAO in gastrocnemius muscle isolated from 10-month-old female Fl/Fl and MBKO mice that had been fed or fasted for 16 hours; n = 4 mice per group. *P < 0.05, **P < 0.01; two-way ANOVA. (K) Metabolic signaling in female Fl/Fl and MBKO (28-week-old) gastrocnemius muscle after fasting (24 h) as determined by immunoblotting. Each lane represents a different mouse. (L) Real-time PCR of FAO genes in the gastrocnemius muscle of fasted (24 h) female MBKO (28-week-old) mice; n = 4 mice per group. *P < 0.05, **P < 0.01; Student’s t-test. AcAA1a, encodes acetyl-CoA acyltransferase 1a; AcAA2, encodes acetyl-CoA acyltransferase 2; Acadl, encodes acyl-CoA dehydrogenase, long chain; Acadm, encodes acyl-CoA dehydrogenase, medium chain; Acads, encodes acyl-CoA dehydrogenase, short chain; Acadsb, encodes acyl-CoA dehydrogenase, short/branched chain; Acadvl, encodes acyl-CoA dehydrogenase, very long chain; Cpt1b, encodes carnitine palmitoyltransferase 1b; Cpt1b, encodes carnitine palmitoyltransferase 2; Echs1, encodes enoyl Co-A hydratase short chain 1; Hadha, encodes enoyl-CoA hydratase; Lipe, encodes hormone-sensitive lipase; Lpl, encodes lipoprotein lipase.
Fig. 4.
Fig. 4.
The skeletal muscle of MBKO mice has reduced energy content but higher lipid metabolite accumulation. (A) Total triglyceride (TG), free fatty acid (FFA), and acylcarnitine content in the gastrocnemius and soleus muscles of female MBKO mice as determined by LC/MS; n = 4 mice per group. (B) Metabolites of glycogenolysis, glycolysis, and tricarboxylic acid (TCA) cycle in the gastrocnemius muscle of female Fl/Fl and MBKO mice after 24-h fasting; n = 4–5 mice per group. Glc, glucose; G1P, glucose-1-phosphate; G6P, glucose-6-phosphate; F6P, fructose-6-phosphate; 3PG, 3-phosphoglycerate; Pyr, pyruvate; Cit, citrate; Isoc, isocitrate; Suc, succinate; Fur, fumarate; Mal, malate; Lac, lactate. (C) Glycogen content in the gastrocnemius muscle of female Fl/Fl and MBKO mice after fasting; n = 6–7 mice per group. (D) Expression of glycogenolytic and glycolytic genes in the gastrocnemius muscle of female Fl/Fl and MBKO mice after 24-h fasting as determined by RNA sequencing; n = 4 mice per group. Hk1, encodes hexokinase 1; Gpi1, encodes glucose phosphate isomerase 1; Pgam1, encodes phosphoglycerate mutase 1; Pgk1, encodes phosphoglycerate kinase 1; Pyg1, encodes glycogen phosphrylase 1; Pgm1, encodes phosphoglucomutase 1. (E) AA content in the gastrocnemius muscle from female Fl/Fl and MBKO mice fasted for 24 h; n = 5 mice per group. (F) ATP content in the gastrocnemius muscle of female MBKO mice after 24-h fasting; n = 5 mice per group. (G) Summary of the biochemical pathways of glucose and lipid metabolism affected by Bdnf ablation in the gastrocnemius during fasting. Upregulated metabolites or genes are indicated in red and the downregulated metabolites or genes are indicated in blue. *P < 0.05, **P < 0.01; Student’s t-test (A, B, DF), two-way ANOVA (C).
Fig. 5.
Fig. 5.
Diminished fasting-induced autophagy in MBKO muscle. (A) Changes in total lean and fat mass of female Fl/Fl and MBKO mice after 24-h fasting; n = 10–12 mice per group. (B) Autophagy signaling in the gastrocnemius muscle of female Fl/Fl and MBKO mice after 24 hours of fasting as determined by immunoblotting. Each lane represents a different mouse. Quantification is also shown; n = 3 mice per group. (C) Representative LC3 immunofluorescent images of gastrocnemius muscle sections from fasted (24 h) female Fl/Fl and MBKO mice (upper panel). Scale bar, 50 µm. Magnified images of the selected regions (yellow boxes) are shown in the lower panel. n = 3 mice per group. (D) Representative H&E staining of gastrocnemius muscle sections from fed or fasted female Fl/Fl and MBKO mice. Centronuclear myopathy (yellow asterisks), necrosis (black arrow heads), myositis (black arrows) and focal invasion of non-necrotic muscle fibers by inflammatory cells (yellow arrowhead) are indicated. Scale bar, 50 µm. n = 3 mice per group. (E) Total muscle strength of fed female Fl/Fl and MBKO mice (6-month-old) as determined by the grip-strength test; n = 6 mice per group. (F) The specific tetanic force, stiffness (SF0/SFt), specific twitch fore, and fatigue rate of gastrocnemius muscles isolated from fed female Fl/Fl and MBKO mice (6-month-old) as determined by ex vivo functional assessment; n = 6 mice per group. (G) Total time and distance run by fed female Fl/Fl and MBKO mice (6-month-old) on a treadmill; n = 6 mice per group. *P < 0.05, **P < 0.01; Students t-test.
Fig. 6.
Fig. 6.
MBKO mice display muscle-specific insulin resistance. (A) Glucose tolerance test (GTT) of 5 month old female Fl/Fl and MBKO mice fasted for 16 hours; n = 6 mice per group. (B) Area under curve (AUC) for the GTT shown in Fig. 6A; n = 6 mice per group. (C) Glucose infusion rate for 16 h-fasted female Fl/Fl and MBKO (28-week-old) mice during hyperinsulinemic-euglycemic clamping; n = 6–8 mice per group. (D) Whole body glucose turnover in female Fl/Fl and MBKO (28-week-old) mice during hyperinsulinemic-euglycemic clamping; n = 6–8 mice per group. (E) Insulin-stimulated glucose uptake by the gastrocnemius muscle of female Fl/Fl and MBKO (28-week-old) mice during hyperinsulinemic-euglycemic clamping; n = 6 mice per group. (F) Insulin-stimulated glucose uptake by WAT of female Fl/Fl and MBKO (28-week-old) mice during hyperinsulinemic-euglycemic clamping; n = 6 mice per group. (G) Insulin-stimulated signaling in gastrocnemius muscle isolated from 16 h-fasted female Fl/Fl and MBKO mice (6-month-old). Each lane represents a different mouse. Quantification is shown in the right panels; n = 3 mice per group. (H) Differentiated C2C12 myotubes infected for 48 h with control adenovirus (Ad-Ctr) or adenovirus expressing shBdnf (ad-shBdnf) were stimulated with human insulin (100 nM, 30 mins) and immunoblotted as indicated. Each lane represents a different set of cells. (I) Hepatic glucose production (HGP) of Fl/Fl and MBKO (28-week-old) mice during hyperinsulinemic-euglycemic clamping; n = 6 mice per group. (J) Hepatic glycogen content in fed or 24 h-fasted female Fl/Fl and MBKO mice (6-month-old); n = 4 mice per group. *P < 0.05, **P < 0.01, ***P < 0.001; two-way repeated measures ANOVA (A), Student’s t-test (B–E), two-way ANOVA (G, J).

References

    1. Zurlo F, Larson K, Bogardus C, Ravussin E, Skeletal muscle metabolism is a major determinant of resting energy expenditure. J Clin Invest 86, 1423–1427 (1990). - PMC - PubMed
    1. Goodpaster BH, Sparks LM, Metabolic Flexibility in Health and Disease. Cell Metab 25, 1027–1036 (2017). - PMC - PubMed
    1. Gao AW, Canto C, Houtkooper RH, Mitochondrial response to nutrient availability and its role in metabolic disease. EMBO Mol Med 6, 580–589 (2014). - PMC - PubMed
    1. Randle PJ, Garland PB, Hales CN, Newsholme EA, The glucose fatty-acid cycle. Its role in insulin sensitivity and the metabolic disturbances of diabetes mellitus. Lancet 1, 785–789 (1963). - PubMed
    1. Hue L, Taegtmeyer H, The Randle cycle revisited: a new head for an old hat. Am J Physiol Endocrinol Metab 297, E578–591 (2009). - PMC - PubMed

Publication types

LinkOut - more resources