. 2019 Aug 13;9(1):11757.
doi: 10.1038/s41598-019-47567-w.

Glioblastoma multiforme restructures the topological connectivity of cerebrovascular networks

Affiliations

Glioblastoma multiforme restructures the topological connectivity of cerebrovascular networks

Artur Hahn et al. Sci Rep. .

Abstract

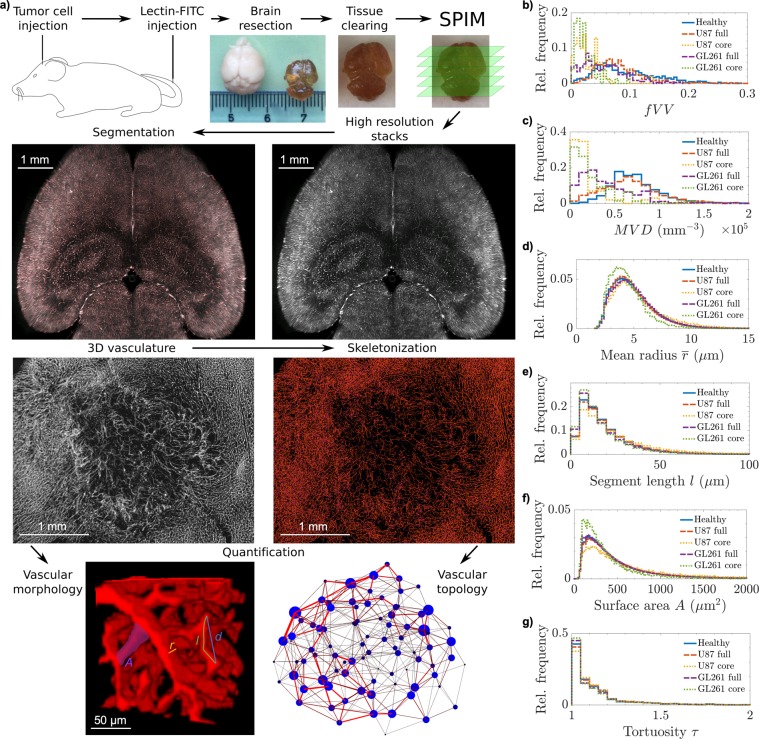
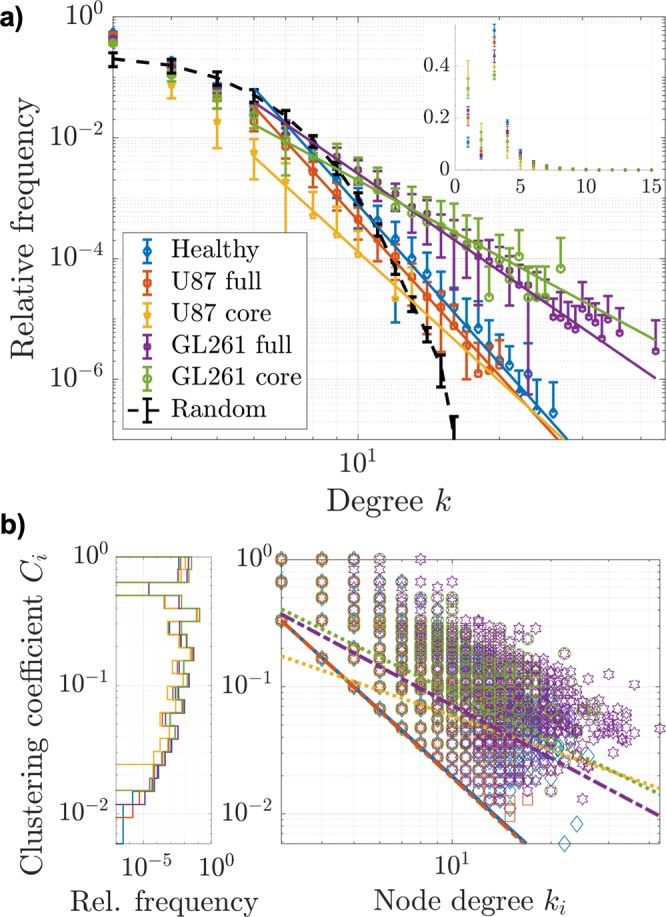
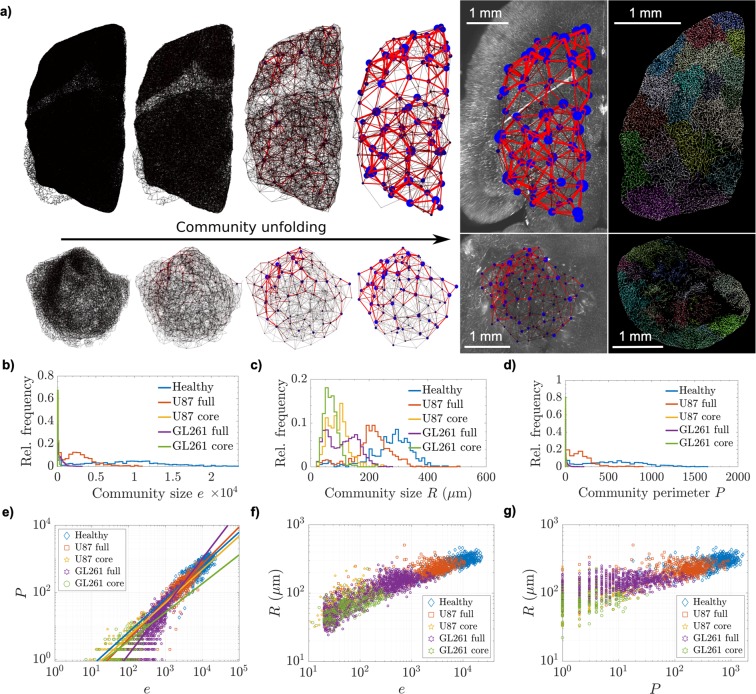
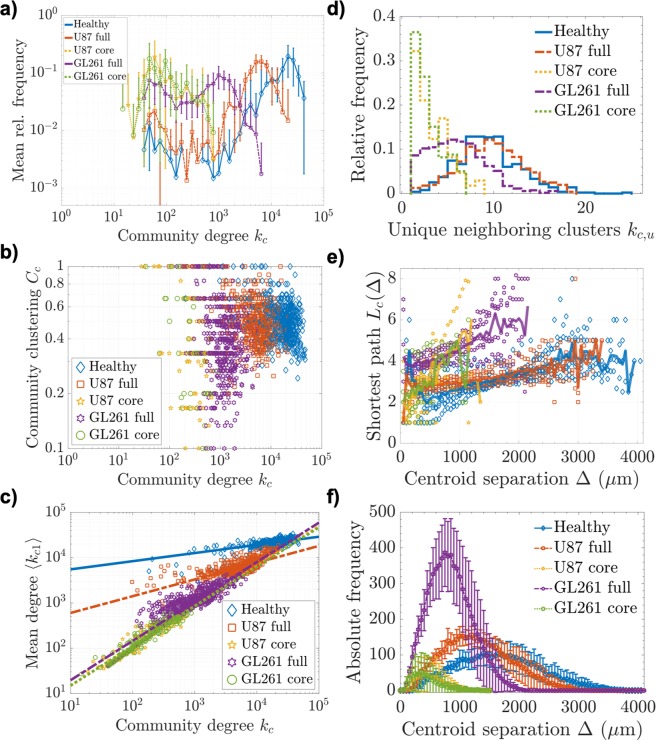
Glioblastoma multiforme alters healthy tissue vasculature by inducing angiogenesis and vascular remodeling. To fully comprehend the structural and functional properties of the resulting vascular network, it needs to be studied collectively by considering both geometric and topological properties. Utilizing Single Plane Illumination Microscopy (SPIM), the detailed capillary structure in entire healthy and tumor-bearing mouse brains could be resolved in three dimensions. At the scale of the smallest capillaries, the entire vascular systems of bulk U87- and GL261-glioblastoma xenografts, their respective cores, and healthy brain hemispheres were modeled as complex networks and quantified with fundamental topological measures. All individual vessel segments were further quantified geometrically and modular clusters were uncovered and characterized as meta-networks, facilitating an analysis of large-scale connectivity. An inclusive comparison of large tissue sections revealed that geometric properties of individual vessels were altered in glioblastoma in a relatively subtle way, with high intra- and inter-tumor heterogeneity, compared to the impact on the vessel connectivity. A network topology analysis revealed a clear decomposition of large modular structures and hierarchical network organization, while preserving most fundamental topological classifications, in both tumor models with distinct growth patterns. These results augment our understanding of cerebrovascular networks and offer a topological assessment of glioma-induced vascular remodeling. The findings may help understand the emergence of hypoxia and necrosis, and prove valuable for therapeutic interventions such as radiation or antiangiogenic therapy.


Conflict of interest statement

The authors declare no competing interests.

Figures

Figure 1
Figure 1
Data acquisition and processing with geometric quantifications. (a) Schematic illustration of experimental procedures, including tumor cell and fluorescent marker injections, brain resection and clearing, with photographs of uncleared and cleared brains with cm scale, and Selective Plane Illumination Microscropy (SPIM). In the second row, an original image from a stack of a healthy mouse brain is presented on the right, with the binary segmentation overlay in red to the left (see Supplementary Movies 1, 2 and 3 for segmentation results in more detail). Below the brain segmentation image, an average intensity projection from a 200 μm thick section of a segmented, noise-filtered, and hole-filled image stack of a U87 glioblastoma is shown. To the right, the skeletonized version of the same dataset is presented, with branch voxels in orange and branching points in magenta. The vascular network quantifications on this post-processed data are illustrated in the last row. The vascular morphology assessment is clarified in a cube of 130 μm side length, marking a radius value r, length l and endpoint-separation d, as well as a segment’s surface area A. Using the vascular skeleton, the network topology is studied, which is illustrated by a clustered graph, presenting the spatial distribution of vessel communities in a U87 glioblastoma. From the geometric quantifications, relative frequency distributions of (b) fractional vessel volume fVV and (c) microvascular density MVD in cubes with 500 μm side length, and distributions of geometric characteristics of all individual vessel segments are presented: (d) mean vessel radius r¯, (e) segment length l, (f) surface area A, and (g) segment tortuosity τ.
Figure 2
Figure 2
Vascular network topology. (a) Degree distributions (mean with SD among samples) from n = 6 healthy brain hemispheres, full U87 and GL261 tumors, and tumor cores, respectively. For comparison, the mean degree distribution from nr=12 random Erdös-Rényi graphs with the corresponding node and edge numbers, is displayed as well, following a Poisson distribution. The large plot presents the distributions for k3 on logarithmic axes, while the inlayed plot shows the full distributions on linear scales. The logarithmic plot includes straight lines in corresponding colors, representing power law fits to the vascular data. (b) Bivariate distributions of node clustering coefficients Ci with corresponding node degrees ki, including all nodes with k3 from all datasets and power law fits in corresponding colors. The marginal distributions of clustering coefficients Ci are displayed with a logarithmic ordinate axis to better illustrate differences along the entire range.
Figure 3
Figure 3
Modular network structure. (a) Schematic graphs of the community unfolding process on an entire vascular network in a healthy brain hemisphere (top) and full U87 glioblastoma (bottom). Each level of partitioning represents a local maximum in modularity Q, attained with increasing community sizes. The rightmost graph shows the clustering scheme with global maximum modularity over a central slice of the original SPIM-image. Communities are depicted by circles with diameter and brightness (blue) proportional to cluster size ej, while the weight of a connection (the number of intercommunity vessel segments) is encoded in the edge thickness and brightness (red). Cluster positions are given by their centroid rj. The specimens encompass comparable (shrunken) tissue volumes of Vh=12.11mm3 and Vg=12.87mm3 in healthy control and tumor tissue, respectively (excluding ventricular space in the healthy brain, blinded for analysis). To the right of the partitioning chains, projections of 100 μm thick sections of the skeletonized vessel data show community affiliation (at global maximum Q) through the color of each branch segment. Relative distributions of community size properties from all specimens follow, namely (b) internal number of edges e, (c) mean physical extent R, and (d) community perimeter P. Panel (e) presents the relationship between a community’s number of internal edges e and its perimeter P. Linear fits to the log-log-representation are plotted in lighter colors over the datapoints, presenting slopes ξ. The following plots illustrate the relationships between (f) community edges e and mean physical extent R, as well as (g) perimeter P and R.
Figure 4
Figure 4
Community interconnectivity. (a) Mean log-binned frequency distributions of community degree kc=2e+P (with SD among samples), (b) community clustering coefficients Cc vs. kc, and (c) mean degree of neighboring communities kc1 vs. kc with fits kc1(kc)kcκ. (d) Relative frequency distributions of the number of unique topological neighbor communities kc,u, (e) separation-dependent shortest path length Lc between two connected communities, separated by the Euclidean distance Δ ± δ/2 with increments of δ = 50 μm. The datapoints represent individual community-pair instances and the brighter lines connect the mean values over all datasets for each distance bin in Δ. (f) The number of community pairs with centroid separation Δ ± δ/2 (with SD among samples).

References

    1. González-Alonso J. Human thermoregulation and the cardiovascular system. Exp Physiol. 2012;97:340–346. doi: 10.1113/expphysiol.2011.058701. - DOI - PubMed
    1. Murray CD. The physiological principle of minimum work: I. the vascular system and the cost of blood volume. Proc Natl Acad Sci USA. 1926;12:207–214. doi: 10.1073/pnas.12.3.207. - DOI - PMC - PubMed
    1. Murray CD. The physiological principle of minimum work: Ii. oxygen exchange in capillaries. Proc Natl Acad Sci USA. 1926;12:299–304. doi: 10.1073/pnas.12.5.299. - DOI - PMC - PubMed
    1. Wiedeman MP, Tuma RF, Mayrovitz HN. An Introduction to Microcirculation. New York: Elsevier Academic Press; 1981.
    1. Lorthois S, Cassot F. Fractal analysis of vascular networks: Insights from morphogenesis. J Theor Biol. 2010;262:614–633. doi: 10.1016/j.jtbi.2009.10.037. - DOI - PubMed

Publication types