. 2019 Aug 13;9(1):11741.
doi: 10.1038/s41598-019-47926-7.

Comparative Proteomic Analysis Provides Insights into the Regulatory Mechanisms of Wheat Primary Root Growth

Affiliations

Comparative Proteomic Analysis Provides Insights into the Regulatory Mechanisms of Wheat Primary Root Growth

Le Li et al. Sci Rep. .

Abstract

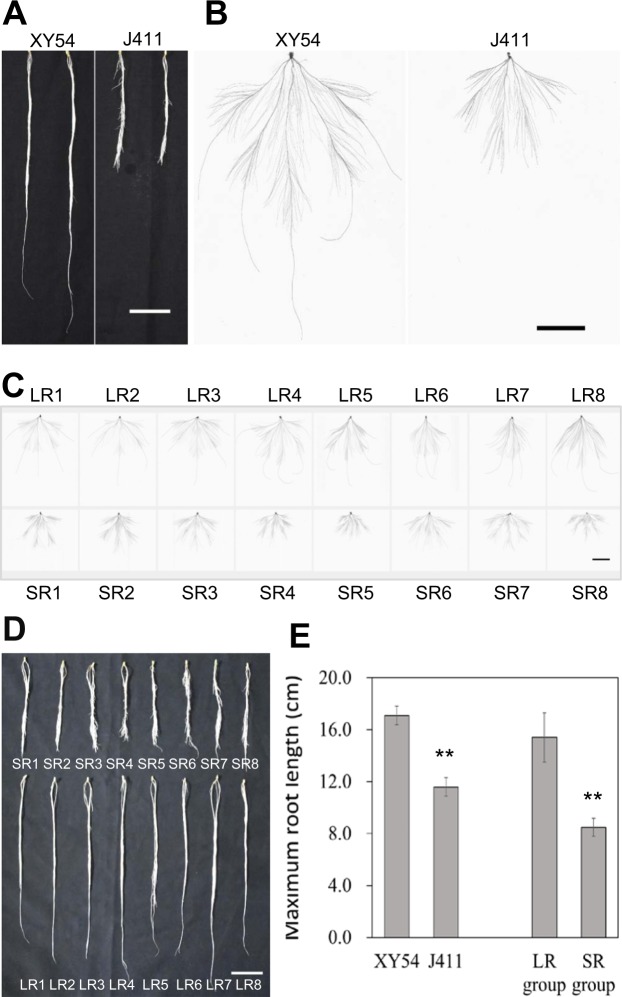
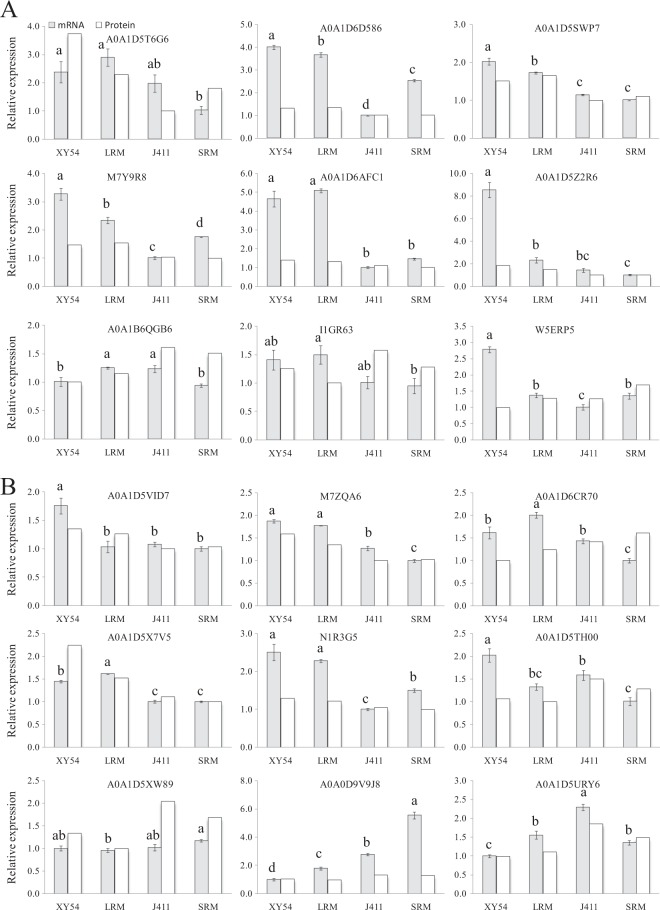
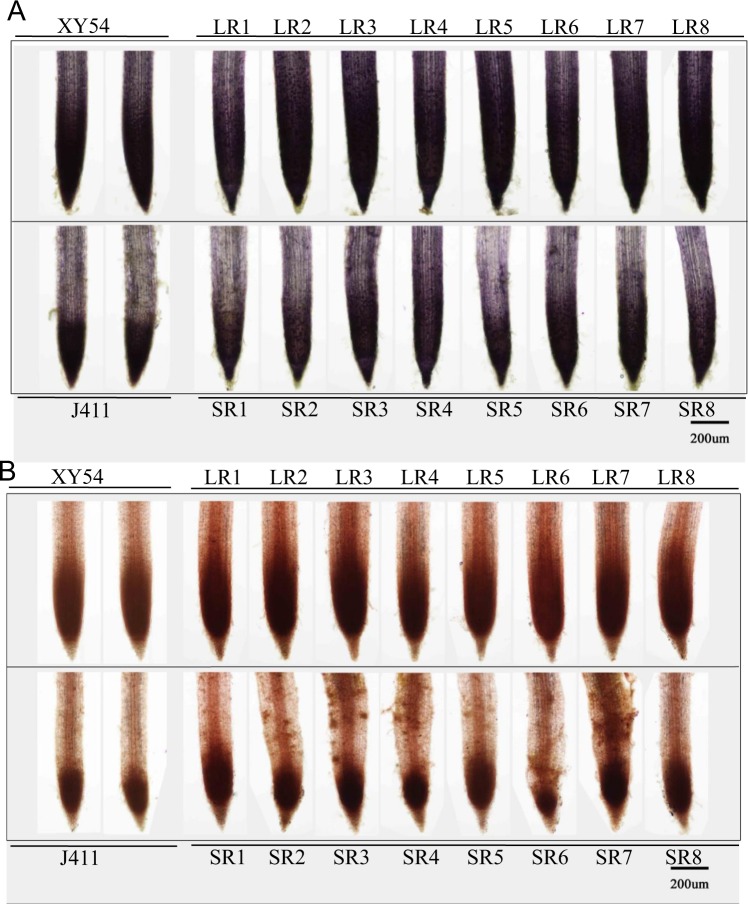
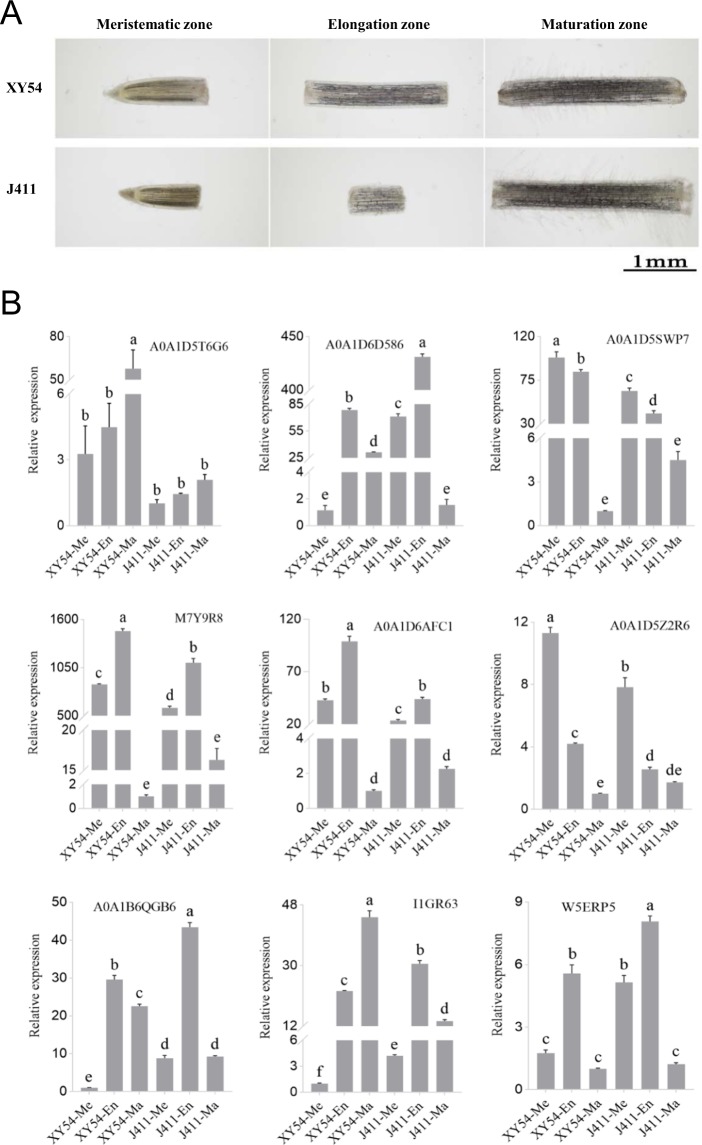
Plant roots are vital for acquiring nutrients and water from soil. However, the mechanisms regulating root growth in hexaploid wheat remain to be elucidated. Here, an integrated comparative proteome study on the roots of two varieties and their descendants with contrasting root phenotypes was performed. A total of 80 differentially expressed proteins (DEPs) associated with the regulation of primary root growth were identified, including two plant steroid biosynthesis related proteins and nine class III peroxidases. Real-time PCR analysis showed that brassinosteroid (BR) biosynthesis pathway was significantly elevated in long-root plants compared with those short-root plants. Moreover, O2.- and H2O2 were distributed abundantly in both the root meristematic and elongation zones of long root plants, but only in the meristematic zone of short-root plants. The differential distribution of reactive oxygen species (ROS) in the root tips of different genotypes may be caused by the differential expression of peroxidases. Taken together, our results suggest that the regulation of wheat primary root growth is closely related to BR biosynthesis pathway and BR-mediated ROS distribution.


Conflict of interest statement

The authors declare no competing interests.

Figures

Figure 1
Figure 1
Root phenotype of wheat varieties XY54, J411, the LR group (Long root group) and the SR group (Short root group). (AB) Roots (A) and root morphologies (B) of XY54 and J411; (CD) root morphologies (C) and roots (D) of eight randomly selected lines from the LR group and SR group, respectively; (E) average values of MRL (maximum root length) of XY54, J411, LR group and SR group. The asterisks above the columns indicate significant differences at p < 0.05 (n = 15). MRL, maximum root length. Bar = 5 cm.
Figure 2
Figure 2
Results of Venn diagram analysis, and GO and pathway enrichment analysis of the DEPs. (A) Result of Venn diagram analysis; (B) GO enrichment analysis; (C) significantly enriched pathways involving the up-regulated DEPs. The values on the vertical ordinate represent the percentage of DEPs to the background proteins in the pathway. DEPs, differentially expressed proteins.
Figure 3
Figure 3
Hierarchical clustering of DEPs involved in the regulation of primary root growth. The four columns represent the protein expression levels in XY54, the long root mixture (LRM), J411 and the short root mixture (SRM). Red and blue indicate the higher and lower expression levels, respectively. DEPs, differentially expressed proteins.
Figure 4
Figure 4
Relative mRNA expression analysis of DEPs using real-time PCR. (A) Relative mRNA expression of nine differentially expressed peroxidases; (B) relative mRNA expression of nine randomly selected DEPs. For the expression level of a protein, the lowest of the four samples was defined as a reference and its expression value was set as 1.0. Columns marked with different lowercase letters indicate that the difference between them (in gene expression levels) is significant according to Duncan’s multiple range test (n = 3, p < 0.05).
Figure 5
Figure 5
Relative mRNA expression analysis of genes involved in brassinosteroid biosynthesis using real-time PCR. The sample with the lowest expression level was set as 1.0. Columns marked with different lowercase letters indicate that the difference between them (in gene expression levels) is significant according to Duncan’s multiple range test (n = 3, p < 0.05).
Figure 6
Figure 6
Results of in situ detection of root O2.- and H2O2 in XY54, J411 and eight randomly selected lines from the long root (LR) group and short root (SR) group, respectively. NBT (Nitroblue tetrazolium) and DAB (3,3′-diaminobenzidine) were used to stain O2.- and H2O2, respectively. (A) Results of NBT staining; (B) results of DAB staining.
Figure 7
Figure 7
Relative mRNA expression analysis of differentially expressed peroxidase genes in the meristematic, elongation and maturation zones of root tips using RT-qPCR. ‘Me’ represent meristematic zone; ‘En’ represent the elongation; ‘Ma’ represent maturation zone. The lowest expression level in the samples was set as 1.0. Columns marked with different lowercase letters indicate that the difference between them (in gene expression levels) is significant according to Duncan’s multiple range test (n = 3, p < 0.05).

References

    1. Waines JG, Ehdaie B. Domestication and crop physiology: roots of Green-Revolution wheat. Ann. Bot. 2007;100:991–998. doi: 10.1093/aob/mcm180. - DOI - PMC - PubMed
    1. Den Herder G, Van Isterdael G, Beeckman T, De Smet I. The roots of a new green revolution. Trends Plant Sci. 2010;15:600–607. doi: 10.1016/j.tplants.2010.08.009. - DOI - PubMed
    1. Hochholdinger F. Untapping root system architecture for crop improvement. J. Exp. Bot. 2016;67:4431–4433. doi: 10.1093/jxb/erw262. - DOI - PMC - PubMed
    1. Wachsman G, Sparks EE, Benfey PN. Genes and networks regulating root anatomy and architecture. New Phytol. 2015;208:26–38. doi: 10.1111/nph.13469. - DOI - PubMed
    1. Rosegrant MW, Ringler C, Zhu T. Water for agriculture: maintaining food security under growing scarcity. Annu. Rev. Environ. Resour. 2009;34:205–222. doi: 10.1146/annurev.environ.030308.090351. - DOI

Publication types