. 2020 Mar;27(3):1134-1153.
doi: 10.1038/s41418-019-0403-9. Epub 2019 Aug 14.

Autophagy role(s) in response to oncogenes and DNA replication stress

Affiliations

Autophagy role(s) in response to oncogenes and DNA replication stress

Riccardo Vanzo et al. Cell Death Differ. 2020 Mar.

Abstract

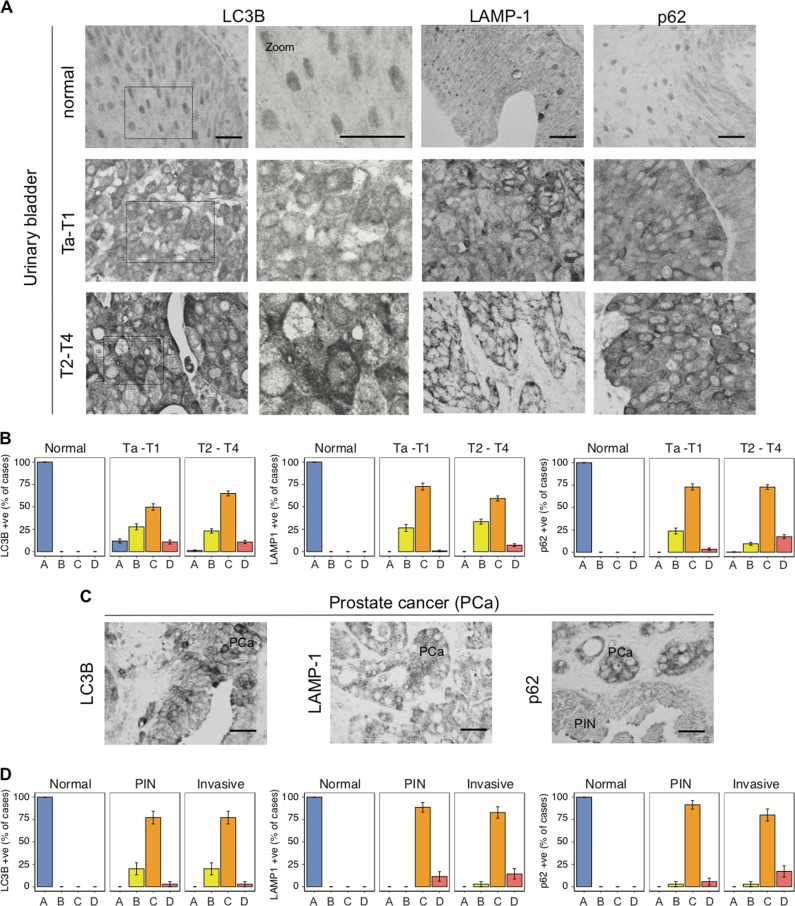
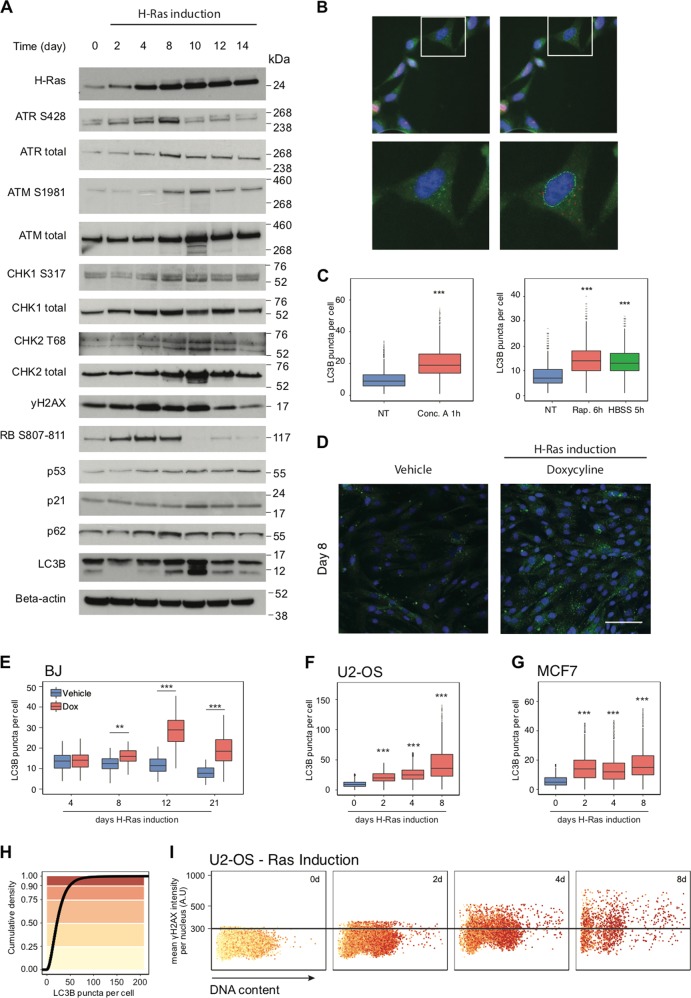
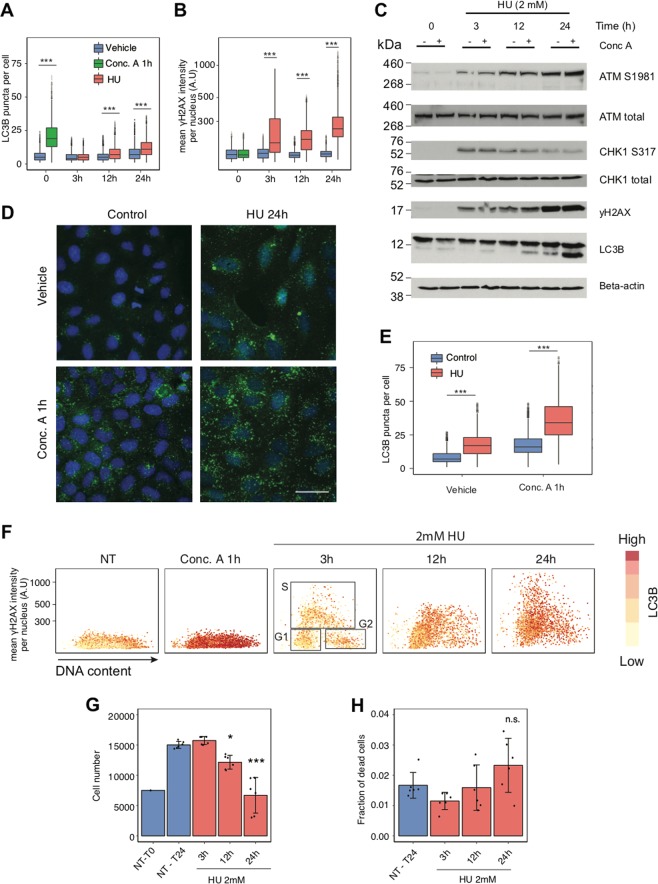
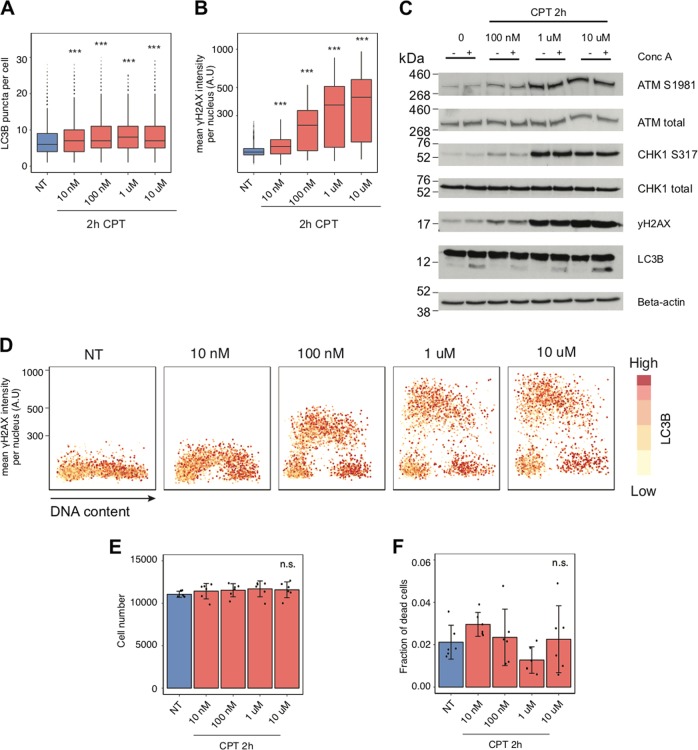
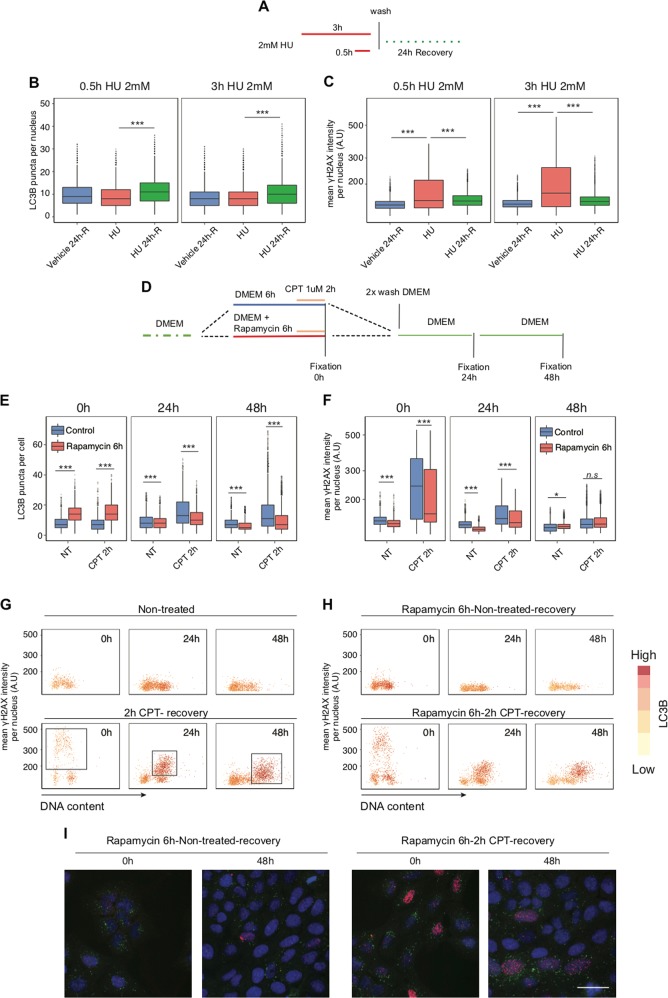
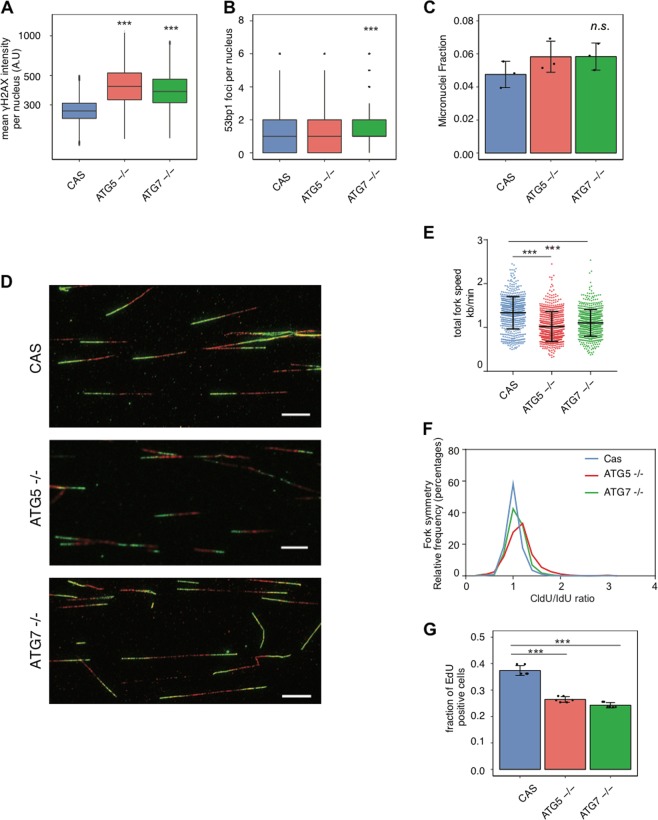
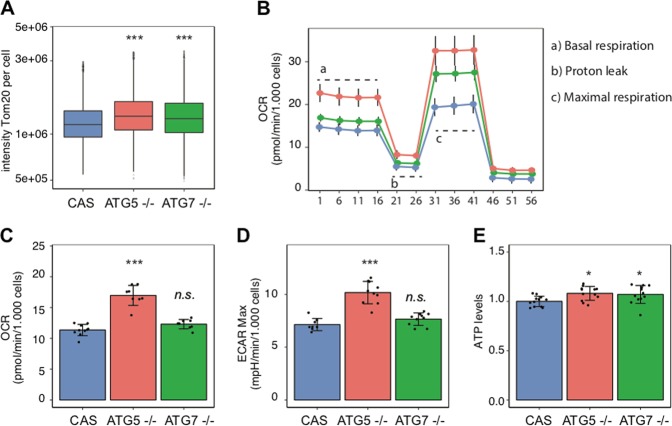
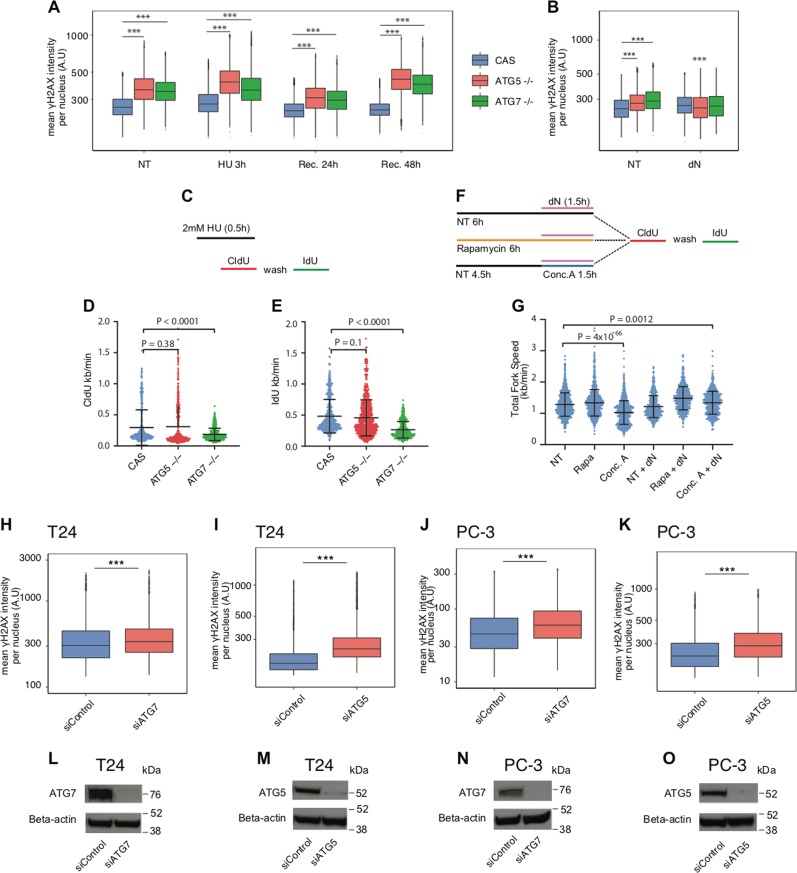
Autophagy is an evolutionarily conserved process that captures aberrant intracellular proteins and/or damaged organelles for delivery to lysosomes, with implications for cellular and organismal homeostasis, aging and diverse pathologies, including cancer. During cancer development, autophagy may play both tumour-supporting and tumour-suppressing roles. Any relationships of autophagy to the established oncogene-induced replication stress (RS) and the ensuing DNA damage response (DDR)-mediated anti-cancer barrier in early tumorigenesis remain to be elucidated. Here, assessing potential links between autophagy, RS and DDR, we found that autophagy is enhanced in both early and advanced stages of human urinary bladder and prostate tumorigenesis. Furthermore, a high-content, single-cell-level microscopy analysis of human cellular models exposed to diverse genotoxic insults showed that autophagy is enhanced in cells that experienced robust DNA damage, independently of the cell-cycle position. Oncogene- and drug-induced RS triggered first DDR and later autophagy. Unexpectedly, genetic inactivation of autophagy resulted in RS, despite cellular retention of functional mitochondria and normal ROS levels. Moreover, recovery from experimentally induced RS required autophagy to support DNA synthesis. Consistently, RS due to the absence of autophagy could be partly alleviated by exogenous supply of deoxynucleosides. Our results highlight the importance of autophagy for DNA synthesis, suggesting that autophagy may support cancer progression, at least in part, by facilitating tumour cell survival and fitness under replication stress, a feature shared by most malignancies. These findings have implications for better understanding of the role of autophagy in tumorigenesis, as well as for attempts to manipulate autophagy as an anti-tumour therapeutic strategy.


Conflict of interest statement

The authors declare that they have no conflict of interest.

Figures

Fig. 1
Fig. 1
Autophagy patterns in clinical cancer specimens and oncogene-driven cellular models. a Representative immunohistochemistry images of normal bladder mucosa (normal), early lesions (Ta–T1) and advanced bladder carcinomas (T2–T4). Note: dominant cytoplasmic staining for LC3B, LAMP-1, and both cytoplasmic and nuclear localization of p62 [6, 70]. Scale bars, 50 µm. b Subdivision of immunohistochemistry results for LC3B, p62 (cytoplasmic) and LAMP-1 into four classes according to staining patterns: A being the lowest and D the highest degree of positivity. Mean and SD are indicated for the estimated frequency in each class (N > 300). c Representative examples of immunohistochemical patterns in prostate cancers. PCa: prostate cancer, PIN: prostatic intraepithelial neoplasia. Sections were stained for LC3B, LAMP-1 or p62. Scale bars, 50 µm. d Subdivision of immunohistochemistry results for LC3B, p62 and LAMP-1 into four classes according to the staining patterns: A being the lowest and D the highest degree of positivity. Mean and SD are indicated for the estimated frequency in each class (N = 35)
Fig. 2
Fig. 2
Autophagosomes accumulate upon overexpression of H-RasV12. a The level of DNA damage response- and autophagy-related proteins was tested by immunoblotting in BJ-Ras cells. Cells were treated with 2 μg/ml of doxycycline (Dox) for the indicated time. Actin was used as a loading control. b Representative images of LC3B puncta and nuclear counterstaining (DAPI). Bottom, cropped images from the top. c Quantification of LC3B puncta per cell in U2-OS cells treated with 2 nM of concanamycin A (cells analyzed per condition > 5000), 100 nM of rapamycin or maintained in HBSS for the indicated time (cells analyzed per condition > 1000). P value associated to two-sided t-test for the difference to the non-treated control. d Representative images of LC3B puncta and nuclear counterstaining (DAPI) in BJ fibroblasts incubated with DMSO (vehicle) or 2 μg/ml of doxycycline (Dox) for 8 days. Scale bars, 100 µm. e Quantification of LC3B puncta per cell in BJ fibroblasts incubated with DMSO (vehicle) or 2 μg/ml of doxycycline (Dox) for the indicated days. Pictures analyzed per condition > 200, at least 20 cells per picture. P value associated to two-sided t-test for the difference to the matched control. f Quantification of LC3B puncta per cell in U2-OS cells incubated with 2 μg/ml of doxycycline (Dox) for the indicated days. Cells analyzed per condition > 1500. P value associated to two-sided t-test for the difference to the untreated control. g Quantification of LC3B puncta per cell in MCF7 cells incubated with 2 μg/ml of doxycycline (Dox) for the indicated time. Cells analyzed per condition > 2000. P value associated to two-sided t-test for the difference to the untreated control. h Cumulative density distribution of LC3B puncta per cell from the experiment in f is shown. Colours correspond to the colour code used in a single-cell analysis. i A single-cell analysis (single points on the scattering plot) of γH2AX mean nuclear intensity (y-axis), LC3B puncta per cell (colour code from (h)) and DNA content (x-axis) from the experiment in f
Fig. 3
Fig. 3
DNA replication stress induces autophagy. a Quantification of LC3B puncta per cell in U2-OS cells incubated with DMSO (vehicle) or 2 mM of hydroxyurea (HU) for the indicated time. As a positive control of an increase in the amount of autophagosomes per cell, U2-OS cells were treated for 1 h with 2 nM of concanamycin A (Conc. A). Cells analyzed per condition > 2500. P value associated to two-sided t-test for the difference to the matched control. b γH2AX mean nuclear intensity in a single-cell analysis, with experimental conditions as in a. P value associated to two-sided t-test for the difference to the matched control. c The level of DNA damage response- and autophagy-related proteins was tested by immunoblotting in U2-OS cells. Cells were treated with 2 mM of hydroxyurea (HU) for the indicated time. Where indicated, cells were incubated with 2 nM of concanamycin A (Conc. A) for 1 h prior to harvesting. Actin was used as a loading control. d Representative images of LC3B puncta and nuclear counterstaining (DAPI) in U2-OS. Cells were incubated with 2 mM of hydroxyurea (HU) for 24 h and/or 2 nM of concanamycin A (Conc. A) for 1 h prior to fixation, where indicated. Scale bars, 50 µm. e Quantification of LC3B puncta per cell in untreated (control) U2-OS cells or cells treated with 2 mM of hydroxyurea (HU) for 24 h. Where indicated, cells were incubated with 2 nM of concanamycin A (Conc. A) for 1 h prior to fixation. Cells analyzed per condition > 2500. P value associated to two-sided t-test for the difference to the matched control. f A single-cell analysis of γH2AX mean nuclear intensity, LC3B puncta per cell and DNA content in U2-OS cells, with experimental conditions as in a. Gates for the cell cycle phases are shown in HU 3 h. g Quantification of U2-OS cells incubated with 2 mM of hydroxyurea (HU) for the indicated time. Error bars indicate mean and SD for each independent biological replicate (N = 6). P value associated to two-sided t-test for the difference to the untreated control. h Quantification of the fraction of dead U2-OS cells from (g). Error bars indicate mean and SD for each independent biological replicate (N = 6)
Fig. 4
Fig. 4
Camptothecin treatment and autophagy. a Quantification of LC3B puncta per cell in U2-OS cells incubated with different concentrations of camptothecin (CPT) for 2 h. Cells analyzed per condition > 2500. P value associated to two-sided t-test for the difference to the untreated control. b γH2AX mean nuclear intensity in a single-cell analysis, with experimental conditions as in a. c The level of DNA damage response- and autophagy-related proteins was tested by immunoblotting in U2-OS cells. Cells were incubated with different concentrations of camptothecin (CPT) for 2 h. Where indicated, cells were incubated with 2 nM of concanamycin A (Conc. A) for 1 h prior to harvesting. Actin was used as a loading control. d A single-cell analysis of γH2AX mean nuclear intensity, LC3B puncta per cell and DNA content from (a, b). e Quantification of U2-OS cells treated with different concentrations of camptothecin (CPT) for 2 h. Error bars indicate mean and SD for each independent biological replicate (N = 6). f Quantification of the fraction of dead U2-OS cells from e. Error bars indicate mean and SD for each independent biological replicate (N = 6)
Fig. 5
Fig. 5
The relationship between drug-induced replication stress, DNA repair and autophagy. a The diagram of experimental settings for b, c is shown. b Quantification of LC3B puncta per cell in U2-OS cells that were incubated with 2 mM of HU for the indicated time, washed and left to recover from the drug for 24 h. Cells analyzed per condition > 2500. P value associated to two-sided t-test for the difference to the sample treated with 2 mM of HU for 2 h. c γH2AX mean nuclear intensity in a single-cell analysis, with experimental conditions as in a. Cells analyzed per condition > 2500. P value associated to two-sided t-test for the difference to the sample treated with 2 mM of HU for 2 h. d The diagram of experimental settings for (e–h) is shown. e Quantification of LC3B puncta per cell in U2-OS cells treated as in d. Cells analyzed per condition > 2500. f γH2AX mean nuclear intensity in a single-cell analysis, with experimental conditions as in d. g A single-cell analysis of γH2AX mean nuclear intensity, LC3B puncta per cell and DNA content in cells treated as in d. Cells analyzed per condition > 2500. Squares indicate the proportion of cells in S phase that accumulate a high level of autophagy (CPT 2 h, 1016 cells; 24 h recovery, 1178 cells; 48 h recovery, 879 cells). h Cells were pretreated with 100 nM of rapamycin for 6 h to induce autophagy prior to CPT treatment and analyzed as in g. i Representative images of LC3B puncta, γH2AX staining and nuclear counterstaining (DAPI) in U2-OS treated as in h. Scale bars, 50 µm
Fig. 6
Fig. 6
The relationship between drug-induced replication stress, DNA repair and autophagy. a γH2AX mean nuclear intensity per nucleus in knockout MCF7 cells: (CAS) parental control, ATG5−/− and ATG7−/−. Cells analyzed per condition > 16 000. b An average number of 53BP1 foci per nucleus in knockout MCF7 cells: (CAS) parental control, ATG5−/− and ATG7−/−. Cells analyzed per condition > 9000. P value associated to two-sided t-test for the difference to the matched control. c Micronuclei fraction in knockout MCF7 cells: (CAS) parental control, ATG5−/− and ATG7−/− (N = 3). P value associated to two-sided t-test for the difference to the matched control. d Examples of DNA fibres from knockout MCF7 cells. Scale bars, 10 µm. e Early passage MCF7 ATG5- and ATG7-knockout cells were pulse-labelled with CldU for 20 min, followed by a second pulse of IdU for 20 min. The length of CldU and IdU was measured and converted into fork speed in kb/min (results from three independent slides; scored forks CAS N = 646, average speed 1.33 kb/min; ATG5−/− N = 680, 1.0 kb/min; ATG7−/− N = 653, 1.1 kb/min). P value associated to two-sided t-test with Welch’s correction. f The ratio between CldU/IdU was analyzed and plotted as relative frequencies (CAS vs ATG5−/− P < 0.0001 Kolmogorov–Smirnov test; CAS vs ATG7−/− P < 0.0001 Kolmogorov–Smirnov test). g The proportion of knockout MCF7 cells in S phase (EdU positive). Mean and SD are plotted for six independent samples. P value associated to two-sided t-test for the difference to the matched control
Fig. 7
Fig. 7
Knockout of autophagy genes has no detrimental effect on basal metabolism. a Tomm20 mean intensity per cell in knockout MCF7 cells: (CAS) parental control, ATG5−/− and ATG7−/−. Cells analyzed per condition > 10000. P value associated to two-sided t-test for the difference to the matched control. b Oxygen consumption rate (OCR) in ATG5- and ATG7-knockout MCF7 cells. Oligomycin (1 μM) was applied to inhibit the F0/F1-ATP synthase and evaluate the proton leak. Carbonylcyanide-p-trifluoromethoxyphenylhydrazone (FCCP) was added next to obtain the maximum respiratory rate (MRR). Finally, a combination of rotenone and antimycin-A was used to inhibit the activity of C-I and C-III and to measure non-mitochondrial respiration. Samples analyzed per cell line N = 8. c The mean of OCR values for knockout MCF7 cells. P value associated to two-sided t-test for the difference to the matched control. Samples analyzed per cell type N = 8. d The mean of ECAR values for knockout MCF7 cells. OCR and ECAR values were corrected for non-mitochondrial respiration. Samples analyzed per cell type N = 8. P value associated to two-sided t-test for the difference to the matched control. e The mean ATP level in knockout MCF7 cells (N = 12). P value associated to two-sided t-test for the difference to the matched control
Fig. 8
Fig. 8
Autophagy is required for efficient recovery from RS. a γH2AX mean nuclear intensity in knockout MCF7 cells after treatment with 2 mM of HU for 3 h and during recovery. Cells analyzed per condition > 8000. P value associated to two-sided t-test for the difference to the matched control. b γH2AX mean nuclear intensity in knockout MCF7 cells after treatment with 100 nM of deoxy-nucleosides (dA, dT, dC, dG) for 24 h. Cells analyzed per condition > 12000. P value associated to two-sided t-test for the difference to the matched control. c The diagram of experimental settings for (d, e) is shown. d The induction of fork arrest by HU treatment in knockout MCF7 cells (CldU mean fork speed CAS = 0.29 kb/min, scored forks N = 582; ATG5−/ = 0.31 kb/min, N = 646; ATG7−/ = 0.18 kb/min, N = 703). P value associated to two-sided t-test with Welch’s correction. e Fork recovery after HU treatment in knockout MCF7 cells. CldU and HU were washed and cells were incubated for 20 min in the fresh medium containing IdU (IdU mean fork speed CAS = 0.48 kb/min, N = 582; ATG5−/ = 0.45 kb/min, N = 646; ATG7−/ = 0.26 kb/min, N = 703). P value associated to two-sided t-test with Welch’s correction. f The diagram of experimental settings for (g) is shown. g MCF7 CAS cells were pulse-labelled with CldU for 20 min, followed by a second pulse of IdU for 20 min. Before being pulse-labelled, cells were incubated with 100 nM of rapamycin for 6 h (Rapa), 2 nM of concanamycin A for 1.5 h (Conc. A) and 100 nM of dN for 1.5 h, where indicated. The length of CldU and IdU was measured and converted into fork speed in kb/min (results from two independent experiments; scored forks NT = 1405, average speed 1.28 kb/min; Rapa = 1209, 1.33 kb/min; Conc. A = 1274, 1.02 kb/min; NT + dN = 678, 1.21 kb/min; Rapa + dN = 546, 1.48 kb/min; Conc. A = 606, 1.33 kb/min). P value associated to two-sided t-test with Welch’s correction. h γH2AX mean nuclear intensity in T24 cells 72 h post transfection with siControl or siATG7 RNA. Cells analyzed per condition > 10000. P value associated to two-sided t-test for the difference to the matched control. i γH2AX mean nuclear intensity in T24 cells 72 h post transfection with siControl or siATG7 RNA. Cells analyzed per condition > 8000. P value associated to two-sided t-test for the difference to the matched control. j γH2AX mean nuclear intensity in PC-3 cells 72 h post transfection with siControl or siATG7 RNA. Cells analyzed per condition > 8000. P value associated to two-sided t-test for the difference to the matched control. k γH2AX mean nuclear intensity in PC-3 cells 72 h post transfection with siControl or siATG5 RNA. Cells analyzed per condition > 8000. P value associated to two-sided t-test for the difference to the matched control. l The level of the ATG7 protein was tested by immunoblotting in T24 cells 72 h after siRNA transfection. Actin was used as a loading control. m The level of the ATG5 protein was tested by immunoblotting in T24 cells 72 h after siRNA transfection. Actin was used as a loading control. n The level of the ATG7 protein was tested by immunoblotting in PC-3 cells 72 h after siRNA transfection. Actin was used as a loading control. o The level of the ATG5 protein was tested by immunoblotting in PC-3 cells 72 h after siRNA transfection. Actin was used as a loading control

Comment in

References

    1. Yang Z, Klionsky DJ. Mammalian autophagy: core molecular machinery and signaling regulation. Curr Opin Cell Biol. 2010;22:124–31. doi: 10.1016/j.ceb.2009.11.014. - DOI - PMC - PubMed
    1. Mizushima N, Komatsu M. Autophagy: renovation of cells and tissues. Cell. 2011;147:728–41. doi: 10.1016/j.cell.2011.10.026. - DOI - PubMed
    1. Hewitt G, Korolchuk VI. Repair, reuse, recycle: the expanding role of autophagy in genome maintenance. Trends Cell Biol. 2017;27:340–51. doi: 10.1016/j.tcb.2016.11.011. - DOI - PubMed
    1. Parzych KR, Ariosa A, Mari M, Klionsky DJ. A newly characterized vacuolar serine carboxypeptidase, Atg42/Ybr139w, is required for normal vacuole function and the terminal steps of autophagy in the yeast Saccharomycescerevisiae. Mol Biol Cell. 2018;29:1089–99. doi: 10.1091/mbc.E17-08-0516. - DOI - PMC - PubMed
    1. Komatsu M, Ichimura Y. Physiological significance of selective degradation of p62 by autophagy. FEBS Lett. 2010;584:1374–8. doi: 10.1016/j.febslet.2010.02.017. - DOI - PubMed

Publication types