

Systematic analysis of the frequently amplified 2p15-p16.1 locus reveals PAPOLG as a potential proto-oncogene in follicular and transformed follicular lymphoma
- PMID: 31410080
- PMCID: PMC6667098
- DOI: 10.3906/biy-1810-2
Systematic analysis of the frequently amplified 2p15-p16.1 locus reveals PAPOLG as a potential proto-oncogene in follicular and transformed follicular lymphoma
Abstract
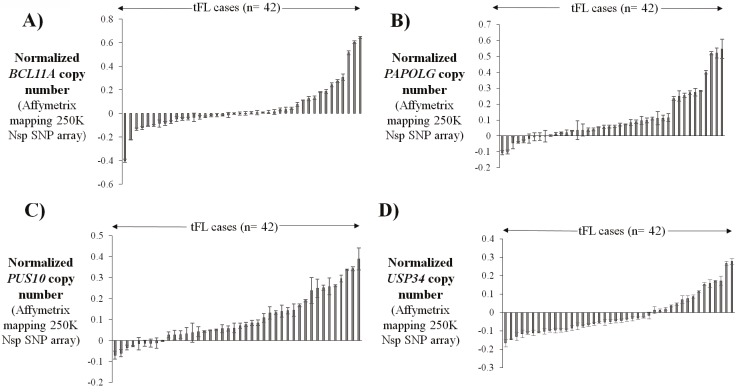
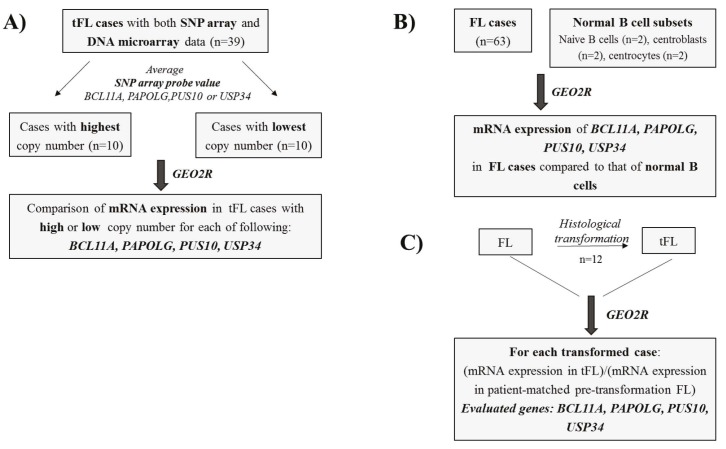
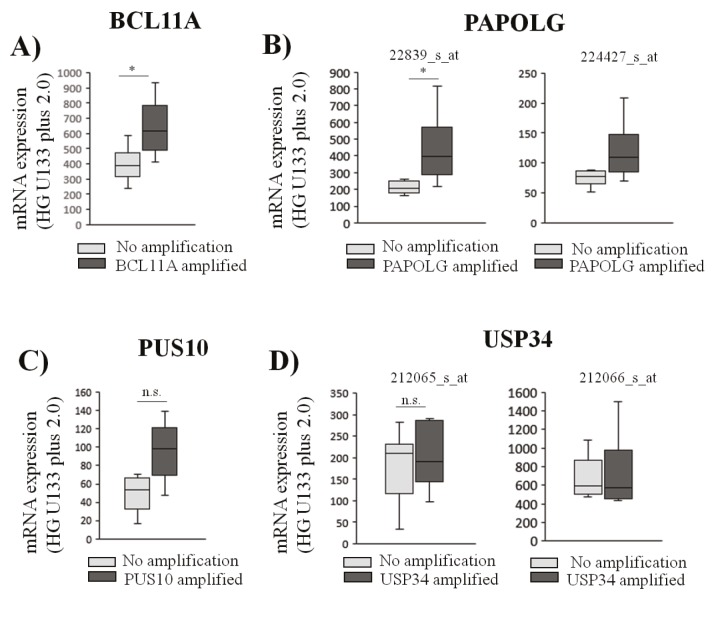
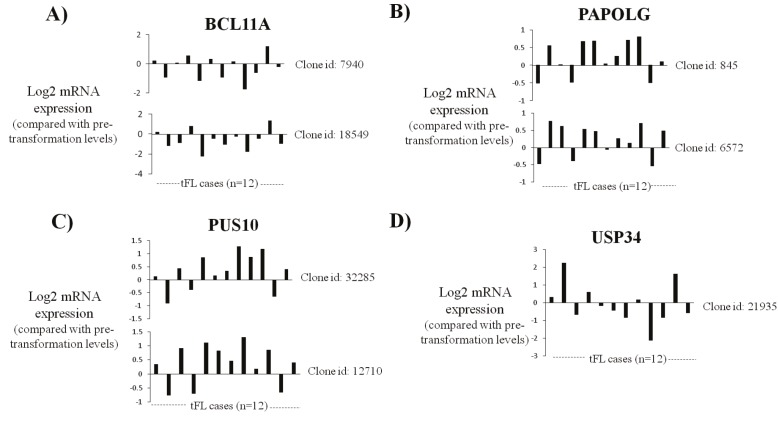
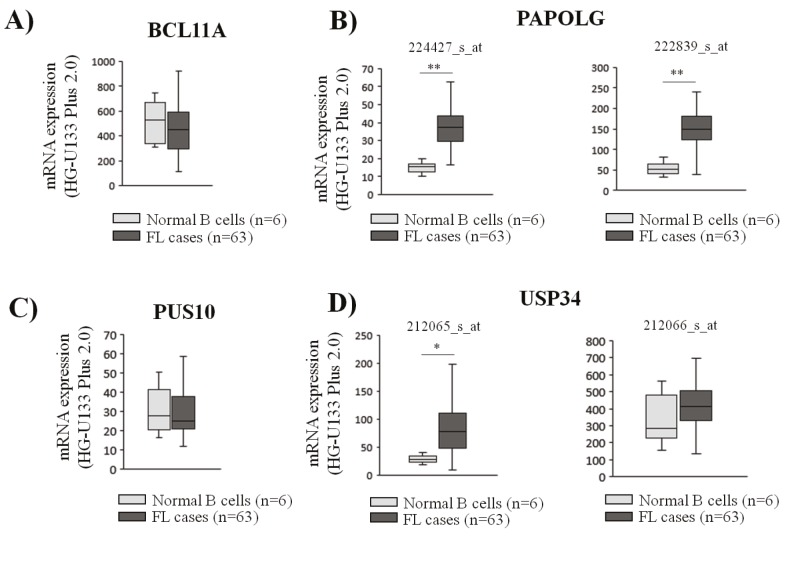
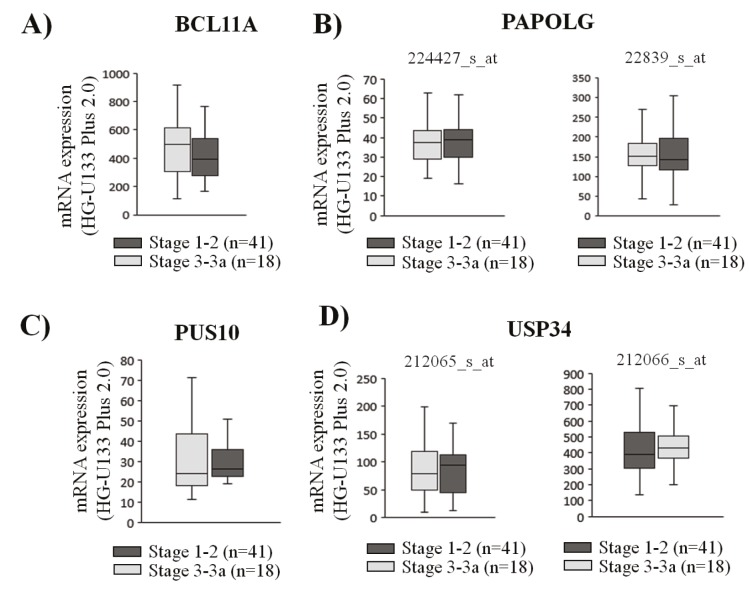
Transformed follicular lymphoma (tFL) originates from histological transformation of follicular lymphoma (FL), which is the most common indolent non-Hodgkin lymphoma. High-resolution genomic copy-number analysis previously identified frequent amplification of the 2p15-p16.1 locus in FL and tFL cases. The genes (i.e. BCL11A, PAPOLG, PUS10, and USP34) in this amplified locus have not been systematically investigated to date in terms of their role in FL pathogenesis or transformation to tFL. Here we investigated the relationship between amplification and expression of genes in 2p15-p16.1 as well as their expression after histological transformation. NCBI GEO SNP array and gene expression profile (GEP) data of tFL cases were analyzed to evaluate the relationship between amplification and mRNA expression. Moreover, transcript levels of these four genes in FL cases were compared with those of patient-matched tFL cases and normal B-cells. Amplification of the 2p15-p16.1 locus is associated with increased transcription of BCL11A and PAPOLG in tFL cases, of which the latter showed increased expression after histological transformation. Compared with the level in normal B-cells, PAPOLG was significantly overexpressed in FL cases, but expression levels of the other three genes did not show any significant difference. Altogether these results suggest that PAPOLG may be the most critical gene in terms of transformation to tFL.
Keywords: 1; 2p15-16; Amplification; BCL11A; PAPOLG; PUS10; USP34; proto-oncogene; tFL.
Conflict of interest statement
CONFLICT OF INTEREST: none declared
Figures
Similar articles
-
The relationship of REL proto-oncogene to pathobiology and chemoresistance in follicular and transformed follicular lymphoma.Leuk Res. 2017 Mar;54:30-38. doi: 10.1016/j.leukres.2017.01.001. Epub 2017 Jan 9. Leuk Res. 2017. PMID: 28095352
-
[The Importance of MicroRNA Deregulation in the Molecular Pathogenesis and Histological Transformation of Follicular Lymphoma].Klin Onkol. 2017 Spring;30(Supplementum1):163-165. Klin Onkol. 2017. PMID: 28471196 Czech.
-
Amplification of 2p as a genomic marker for transformation in lymphoma.Genes Chromosomes Cancer. 2014 Sep;53(9):750-68. doi: 10.1002/gcc.22184. Epub 2014 May 15. Genes Chromosomes Cancer. 2014. PMID: 24832791 Free PMC article.
-
[Analysis of genomic copy number alterations of malignant lymphomas and its application for diagnosis].Gan To Kagaku Ryoho. 2007 Jul;34(7):975-82. Gan To Kagaku Ryoho. 2007. PMID: 17637530 Review. Japanese.
-
New concepts in follicular lymphoma biology: From BCL2 to epigenetic regulators and non-coding RNAs.Semin Oncol. 2018 Oct;45(5-6):291-302. doi: 10.1053/j.seminoncol.2018.07.005. Epub 2018 Oct 23. Semin Oncol. 2018. PMID: 30360879 Review.
Cited by
-
Genomic signatures and prognosis of advanced stage Chinese pediatric T cell lymphoblastic lymphoma by whole exome sequencing.Front Pediatr. 2023 Aug 16;11:1224966. doi: 10.3389/fped.2023.1224966. eCollection 2023. Front Pediatr. 2023. PMID: 37664545 Free PMC article.
-
Molecular landscape of distinct follicular lymphoma histologic grades: insights from genomic and transcriptome analyses.Leukemia. 2025 Jun;39(6):1425-1434. doi: 10.1038/s41375-025-02603-9. Epub 2025 Apr 15. Leukemia. 2025. PMID: 40234612
-
Genetic alterations in B cell lymphoma subtypes as potential biomarkers for noninvasive diagnosis, prognosis, therapy, and disease monitoring.Turk J Biol. 2020 Feb 17;44(1):1-14. doi: 10.3906/biy-1908-23. eCollection 2020. Turk J Biol. 2020. PMID: 32123491 Free PMC article.
-
Comprehensive analysis of GSEC/miR-101-3p/SNX16/PAPOLG axis in hepatocellular carcinoma.PLoS One. 2022 Apr 28;17(4):e0267117. doi: 10.1371/journal.pone.0267117. eCollection 2022. PLoS One. 2022. PMID: 35482720 Free PMC article.
References
-
- Al-Tourah AJ , Gill KK , Chhanabhai M , Hoskins PJ , Klasa RJ , Savage KJ , Sehn LH , Shenkier TN , Gascoyne RD , Connors JM ( 2008. ). Population-based analysis of incidence and outcome of transformed non-Hodgkin's lymphoma . J Clin Oncol 26 : 5165 - 5169 . - PubMed
-
- Bea S , Tort F , Pinyol M , Puig X , Hernandez L , Hernandez S , Fernandez PL , van Lohuizen M , Colomer D , Campo E ( 2001. ). BMI-1 gene amplification and overexpression in hematological malignancies occur mainly in mantle cell lymphomas . Cancer Res 61 : 2409 - 2412 . - PubMed
-
- Bhargava R , Gerald WL , Li AR , Pan Q , Lal P , Ladanyi M , Chen B ( 2005. ). EGFR gene amplification in breast cancer: correlation with epidermal growth factor receptor mRNA and protein expression and HER-2 status and absence of EGFR activating mutations . Mod Pathol 18 : 1027 - 1033 . - PubMed
LinkOut - more resources
Full Text Sources