. 2019 Jul 9;9(17):4946-4958.
doi: 10.7150/thno.35458. eCollection 2019.

Integrative multi-omics analysis identifies a prognostic miRNA signature and a targetable miR-21-3p/TSC2/mTOR axis in metastatic pheochromocytoma/paraganglioma

Affiliations

Integrative multi-omics analysis identifies a prognostic miRNA signature and a targetable miR-21-3p/TSC2/mTOR axis in metastatic pheochromocytoma/paraganglioma

Bruna Calsina et al. Theranostics. .

Abstract

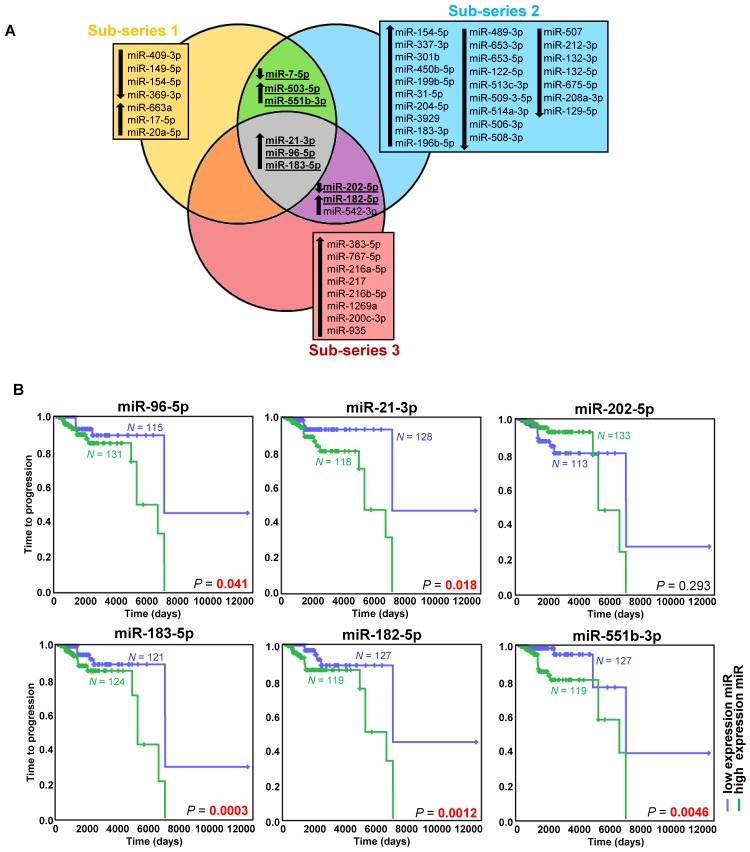
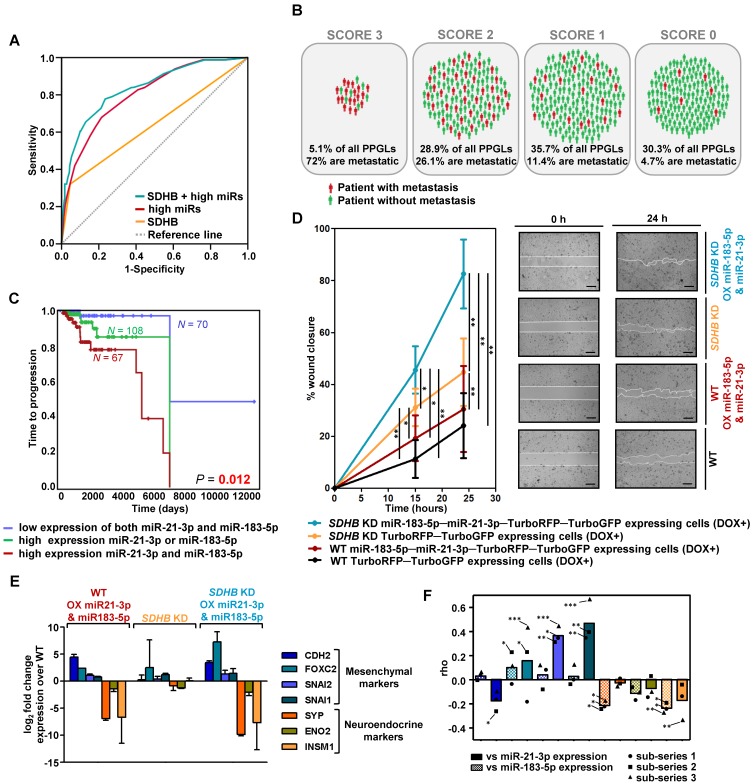
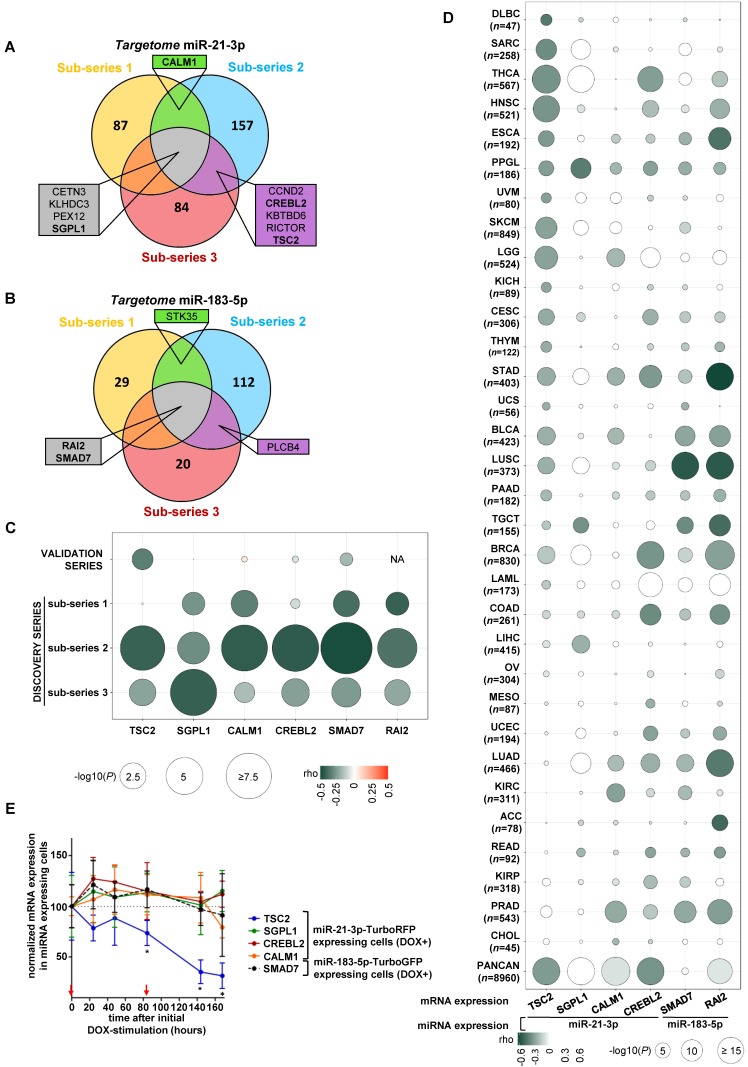
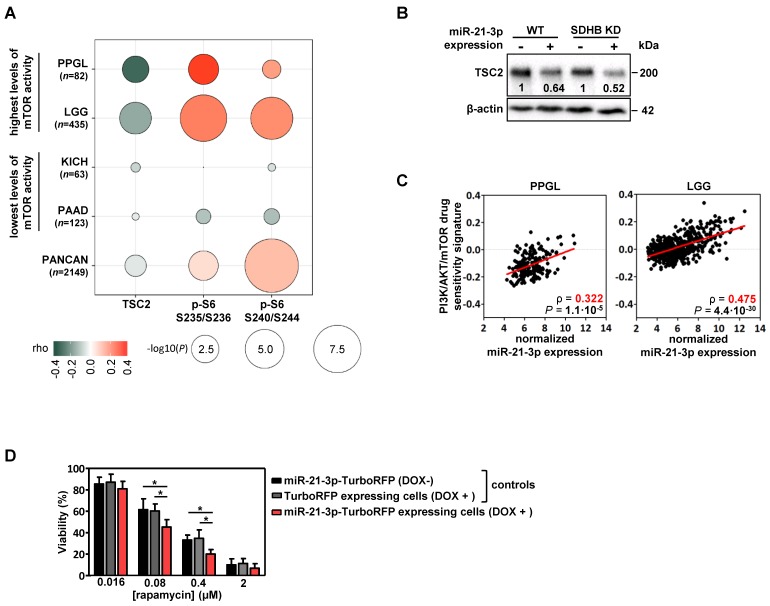
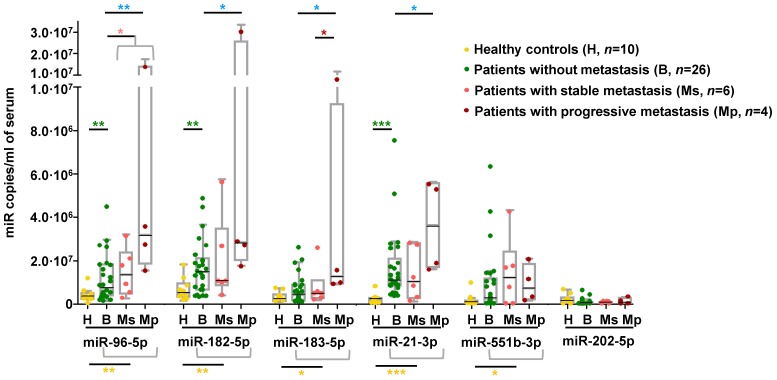
Rationale: Pheochromocytomas and paragangliomas (PPGLs) are rare neuroendocrine tumors that present variable outcomes. To date, no effective therapies or reliable prognostic markers are available for patients who develop metastatic PPGL (mPPGL). Our aim was to discover robust prognostic markers validated through in vitro models, and define specific therapeutic options according to tumor genomic features. Methods: We analyzed three PPGL miRNome datasets (n=443), validated candidate markers and assessed them in serum samples (n=36) to find a metastatic miRNA signature. An integrative study of miRNome, transcriptome and proteome was performed to find miRNA targets, which were further characterized in vitro. Results: A signature of six miRNAs (miR-21-3p, miR-183-5p, miR-182-5p, miR-96-5p, miR-551b-3p, and miR-202-5p) was associated with metastatic risk and time to progression. A higher expression of five of these miRNAs was also detected in PPGL patients' liquid biopsies compared with controls. The combined expression of miR-21-3p/miR-183-5p showed the best power to predict metastasis (AUC=0.804, P=4.67·10-18), and was found associated in vitro with pro-metastatic features, such as neuroendocrine-mesenchymal transition phenotype, and increased cell migration rate. A pan-cancer multi-omic integrative study correlated miR-21-3p levels with TSC2 expression, mTOR pathway activation, and a predictive signature for mTOR inhibitor-sensitivity in PPGLs and other cancers. Likewise, we demonstrated in vitro a TSC2 repression and an enhanced rapamycin sensitivity upon miR-21-3p expression. Conclusions: Our findings support the assessment of miR-21-3p/miR-183-5p, in tumors and liquid biopsies, as biomarkers for risk stratification to improve the PPGL patients' management. We propose miR-21-3p to select mPPGL patients who may benefit from mTOR inhibitors.

Keywords: liquid biopsy; miR-21-3p; multi-omic integration; pheochromocytoma/paraganglioma; prognostic biomarker.


Conflict of interest statement

Competing Interests: The authors have declared that no competing interest exists.

Figures

Figure 1
Figure 1
miRNAs associated with metastatic behavior. (A) Venn diagram of differentially expressed miRNAs (FDR<0.05, |log2 fold change| ≥ 0.75) in the different sub-series of the discovery series (n=443). Downregulated miRNAs are indicated with a downward pointing arrow, and upregulated miRNAs are indicated with an upward pointing arrow. miRNAs selected for validation are shown in bold and are underlined. (B) Kaplan-Meier plots of time to progression (time between the first PPGL diagnosis and the first documented metastases) of patients according to the expression level of the indicated miRNA in tumor tissue. High expression (above the median expression level of the whole group) of the miRNA is represented in blue and low expression (below the median level) in green (n=246 patients from the discovery and validation series, either presenting metachronous metastases ─ presented ≥ one year after diagnosis ─, or with more than one-year follow-up - median follow-up time=1290 days). Patients without evidence of metastases were censored at the date of the last follow-up. P-values were calculated with a log-rank test. N: number of patients.
Figure 2
Figure 2
Risk model of metastasis prediction. (A) Receiver operating characteristic curve analysis showing the accuracy of the miR-SDHB classifier to discriminate mPPGL patients. Data correspond to all samples from the discovery plus the validation series (n=492). miRNAs associated with a shorter TTP were included in the analysis. To combine the data of the different series for the generation of the model, the expression of each miRNA was expressed as a dichotomous variable using the median miRNA expression as the cutoff in each series. Binary variables that identified the different series and the SDHB status were included. AUC, 95%CI and P-values are given in the text. (B) Schematic representation of patients from discovery and validation series (n=492) divided into four groups depending on the miR-SDHB classifier (score 3 = high miR-183-5p and high miR-21-3p and SDHB mutated; score 2 = high miR-21-3p or high miR-183-5p and SDHB mutated, or high miR-21-3p and miR-183-5p and SDHB not mutated; score 1 = high miR-21-3p or high miR-183-5p or SDHB mutated; score 0 = none of the aforementioned criteria apply). Red icons: patients with mPPGL; green icons: non-metastatic patients. (C) Kaplan-Meier plot of TTP of patients according to the expression levels of the miRNAs indicated. High and low expression indicates expression above and below the median expression level of the whole group, respectively. N: number of patients. P-values were calculated with a log-rank test. (D) Wound healing assay in SK-N-AS cells with/without SDHB stably silenced and with/without ectopic expression of miR-21-3p and miR-183-5p. Wound area was assessed at 0, 15 and 24 h. Quantification is based on 18 pictures/condition, n=2. Error bars represent SD.*P<0.05, **P<0.01; two-tailed unpaired t-test. Scale bars=100 µm. (E, F) Expression of the indicated mesenchymal and neuroendocrine genes observed in the SK-N-AS cell model and in the discovery series. (E) Log2 fold change expression of the indicated genes relative to WT TurboRFP-TurboGFP-expressing control cells after normalization of each sample to β-actin. All cells were pretreated with doxycycline (1µg/ml, 120h). Expression is reported as mean of triplicates and error bars represent SD. (F) Spearman's correlations (rho) between the genes shown in Figure (E) and miR-21-3p (smooth columns) or miR-183-5p (dotted columns) expression in the discovery series. Bars indicate the mean of the 3 sub-series; individual values of each sub-series are also shown (•=sub-series 1, ■=sub-series 2, ▲=sub-series 3). ***P<1·10-9, **P<1·10-4, *P<0.05. DOX+: doxycycline pretreated cells (1µg/ml, 120h). WT: wild type; OX: overexpressing; KD: knock down.
Figure 3
Figure 3
Identification of potential gene targets of miR-21-3p and miR-183-5p. (A, B) Venn diagrams summarizing significant genes showing a negative correlation (P<0.05) with miR-21-3p and miR-183-5p expression, respectively, in each sub-series of the Discovery series. Only genes shared between at least two sub-series are shown; rho and p-values are shown in Tables S4 and S5. Genes selected for validation are shown in bold. (C) Bubble diagram showing the correlation between mRNA levels of selected target genes in the discovery and validation series; the colors of the bubbles indicate the rho-value and their diameter is proportional to - log10(P) as indicated below the panel. NA: data not available. (D) Bubble diagrams showing the correlations between mRNA expression of the selected target genes and miRNA expression across 32 TCGA projects representing the major cancer types: LAML, acute myeloid leukemia; ACC, adrenocortical carcinoma; BLCA, bladder urothelial carcinoma; LGG, brain lower grade glioma; BRCA, breast invasive carcinoma; CESC, cervical squamous cell carcinoma and endocervical adenocarcinoma; CHOL, cholangiocarcinoma; COAD, colon adenocarcinoma; READ, rectum adenocarcinoma; ESCA, esophageal carcinoma; HNSC, head and neck squamous cell carcinoma; KICH, kidney chromophobe; KIRC, kidney renal clear cell carcinoma; KIRP, kidney renal papillary cell carcinoma; LIHC, liver hepatocellular carcinoma; LUAD, lung adenocarcinoma; LUSC, lung squamous cell carcinoma; DLBC, lymphoid neoplasm diffuse large B-cell lymphoma; MESO, mesothelioma; OV, ovarian serous cystadenocarcinoma; PAAD, pancreatic adenocarcinoma; PCPG, pheochromocytoma and paraganglioma ('PPGL' in our report); PRAD, prostate adenocarcinoma; SARC, sarcoma; SKCM, skin cutaneous melanoma; STAD, stomach adenocarcinoma; TGCT, testicular germ cell tumors; THYM, thymoma; THCA, thyroid carcinoma; UCS, uterine carcinosarcoma; UCEC, uterine corpus endometrial carcinoma; PANCAN: dataset downloaded from UCSC Xena. Glioblastoma multiforme was not included in the study since miRNA expression data was not available in UCSC Xena. n: number of samples per project. Colors and diameters of the bubbles are as in (C) and are summarized at the bottom of the panel. (E) Normalized mRNA expression of genes selected from the targetome in miR-21-3p─TurboRFP expressing cells (TSC2, SGPL1, CREBL1, CALM1) or miR-183- 5p─TurboGFP expressing cells (SMAD7). Expression for each condition is normalized to β-actin and expression in control cells (mean + SD; n=3). We represent the average of WT and SDHB KD cells of the mean-centered expression of the miRNA expressing cells (DOX+) over TurboRFP or TurboGFP expressing control cells (DOX+), respectively after initial doxycycline stimulation (1µg/ml) at t0. Two-tailed unpaired t-test was applied to test for differences with control cells not overexpressing miRNA (*: P<0.05). Red arrows indicate medium changes (DOX-stimulation).
Figure 4
Figure 4
Involvement of miR-21-3p in mTOR pathway regulation. (A) Bubble plot indicating Spearman's correlations (rho) between key mTOR pathway proteins that could be affected by TSC2 mRNA downregulation and miR-21- 3p upregulation. TCGA RPPA data of TSC2 protein, p-S6 S235/236 and S240/244 was correlated with miR-21-3p expression in PPGL and LGG TCGA samples (showing the highest mTOR pathway activity reported by Zhang et al.25), as well as in KICH and PAAD samples (lowest levels of mTOR pathway activity); bubble colors indicate the rho coefficient and their diameter is proportional to - log10(P) as indicated below the panel. (B) Representative western blot of TSC2 expression in SK-N-AS WT and SDHB KD cells, with or without ectopic expression of miR-21-3p (miR-21-3p-TurboRFP expressing cells DOX + and control TurboRFP expressing cells DOX +, respectively). Relative quantification of the TSC2 signal in miR-21-3p expressing cells was normalized to the one in TurboRFP expressing cells (DOX +). B-actin has been used as loading control. (C) Scatter plots showing the correlation between miR-21-3p expression and PI3K/AKT/mTOR drug sensitivity signature (from Zhang et al.25) in PPGL (n=178) and LGG (n=514) tumors from the TCGA project. Spearman's correlation coefficient (ρ) and P-values are shown. (D) Cell viability percentage in SK-N-AS miR-21-3p - TurboRFP cells (induced with doxycycline [DOX+] or not [DOX-]) and in SK-N-AS TurboRFP [DOX+] cells treated with the indicated concentrations of rapamycin for 96h. Proportion of viability is shown as the mean ± SD of 2-paired independent experiments performed in triplicate. Two-tailed unpaired t-test was applied to test for differences (*: P<0.01). DOX+: doxycycline pretreated cells (1µg/ml, 120h).
Figure 5
Figure 5
Detection of mPPGL-related miRNAs in the circulation. Box and whisker plots indicate serum levels of the indicated miRNAs in healthy (H, yellow), non-metastatic (B, green) and mPPGL patients (Ms and Mp; orange and brown, respectively) determined by ddPCR. Distinction between stable mPPGL (Ms) and progressive mPPGL (Mp) was based on clinical and radiological data (see Table S8). Mann-Whitney test was applied to test for significant differences. Significant differences between H and the patient cohort (including B, Ms and Mp) are indicated with yellow asterisks, between H and B with green asterisks, between B and metastatic (including Ms and Mp) patients with pink asterisks, between B and Mp with blue asterisks, and Ms and Mp with red asterisks. *: P<0.05, **: P<0.01 and ***: P<0.00001.

References

    1. Favier J, Amar L, Gimenez-Roqueplo A-P. Paraganglioma and phaeochromocytoma: from genetics to personalized medicine. Nat Rev Endocrinol. 2015;11(2):101–11. - PubMed
    1. Jimenez C. Treatment for patients with malignant pheochromocytomas and paragangliomas: A perspective from the hallmarks of cancer. Front Endocrinol (Lausanne) 2018;9:277. - PMC - PubMed
    1. Baudin E, Habra MA, Deschamps F. et al. Therapy of endocrine disease: Treatment of malignant pheochromocytoma and paraganglioma. Eur J Endocrinol. 2014;171(3):R111–22. - PubMed
    1. Plouin PF, Amar L, Dekkers OM. et al. European Society of Endocrinology Clinical Practice Guideline for long-term follow-up of patients operated on for a phaeochromocytoma or a paraganglioma. Eur J Endocrinol. 2016;174(5):G1–G10. - PubMed
    1. John H, Ziegler WH, Hauri D, Jaeger P. Pheochromocytomas: Can malignant potential be predicted? Urology. 1999;53(4):679–683. - PubMed

Publication types

MeSH terms