. 2019 Jul 9;9(18):5359-5373.
doi: 10.7150/thno.34024. eCollection 2019.

Fatty acid-induced CD36 expression via O-GlcNAcylation drives gastric cancer metastasis

Affiliations

Fatty acid-induced CD36 expression via O-GlcNAcylation drives gastric cancer metastasis

Mingzuo Jiang et al. Theranostics. .

Abstract

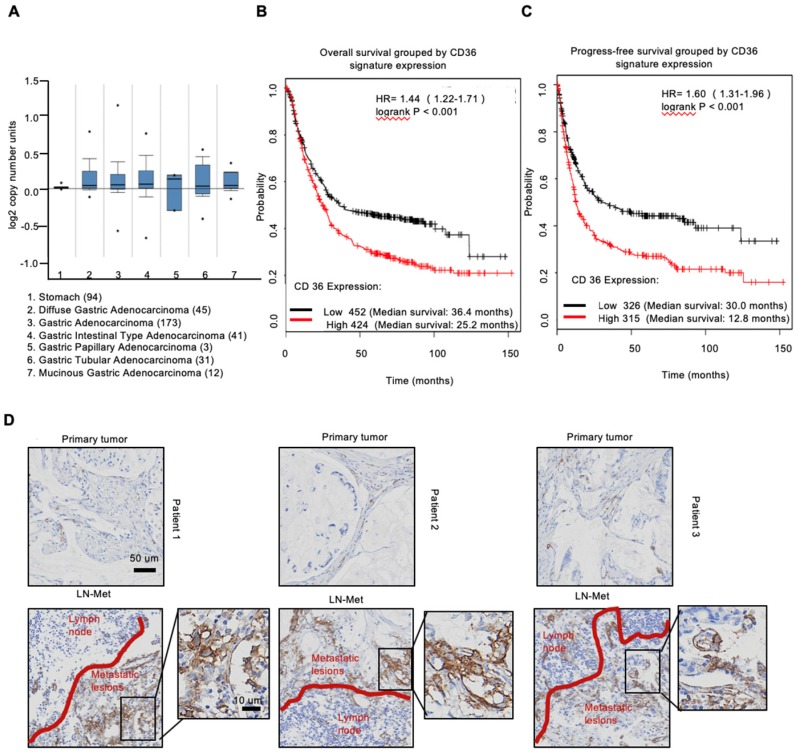
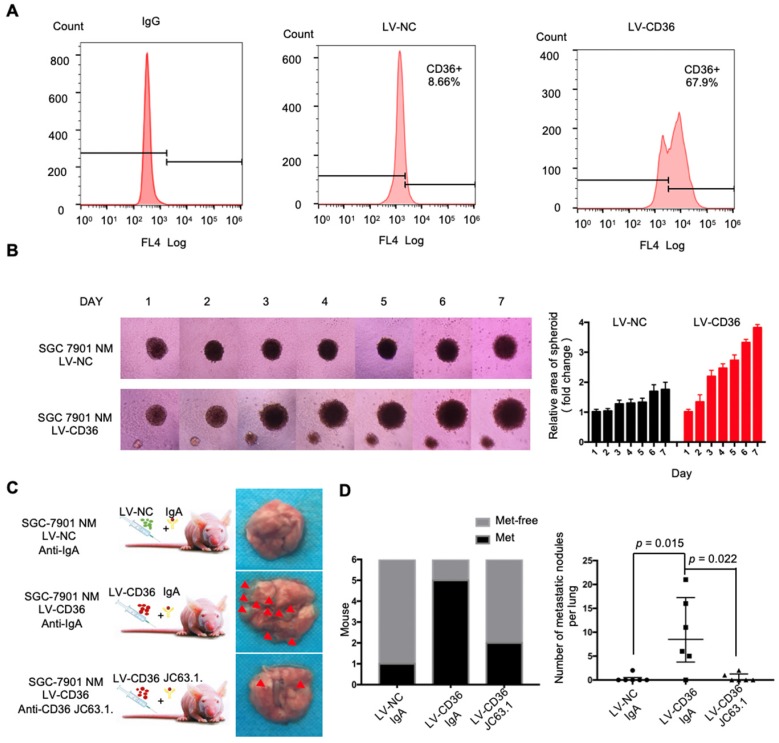
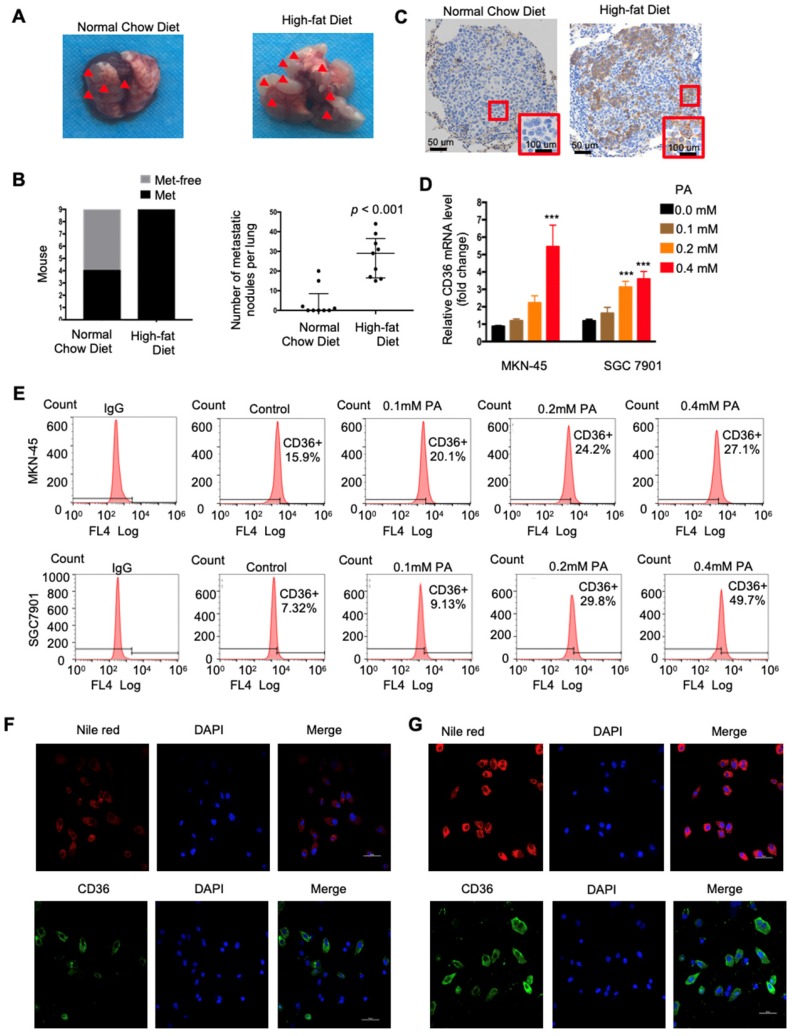
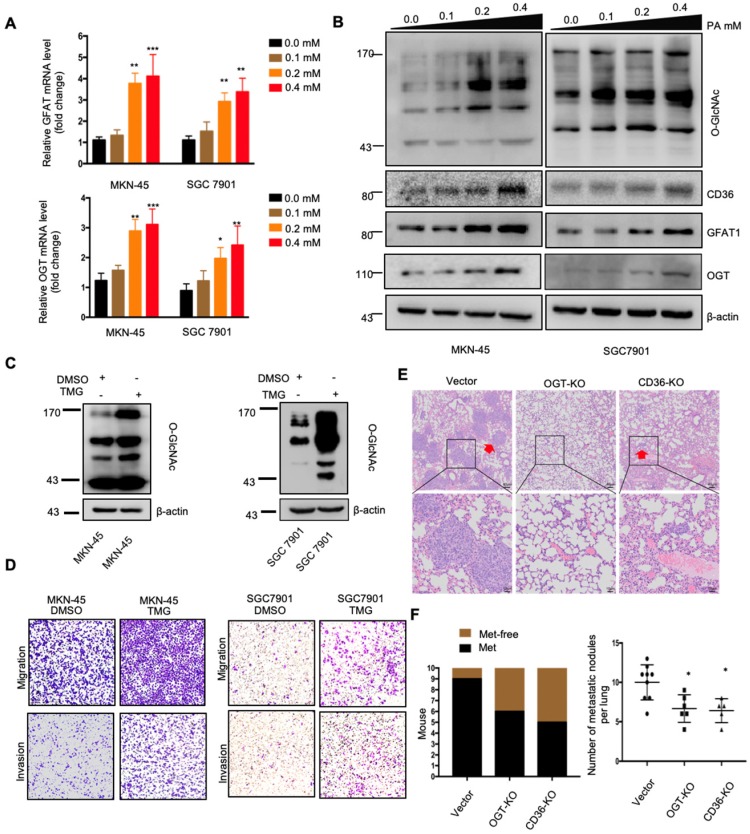
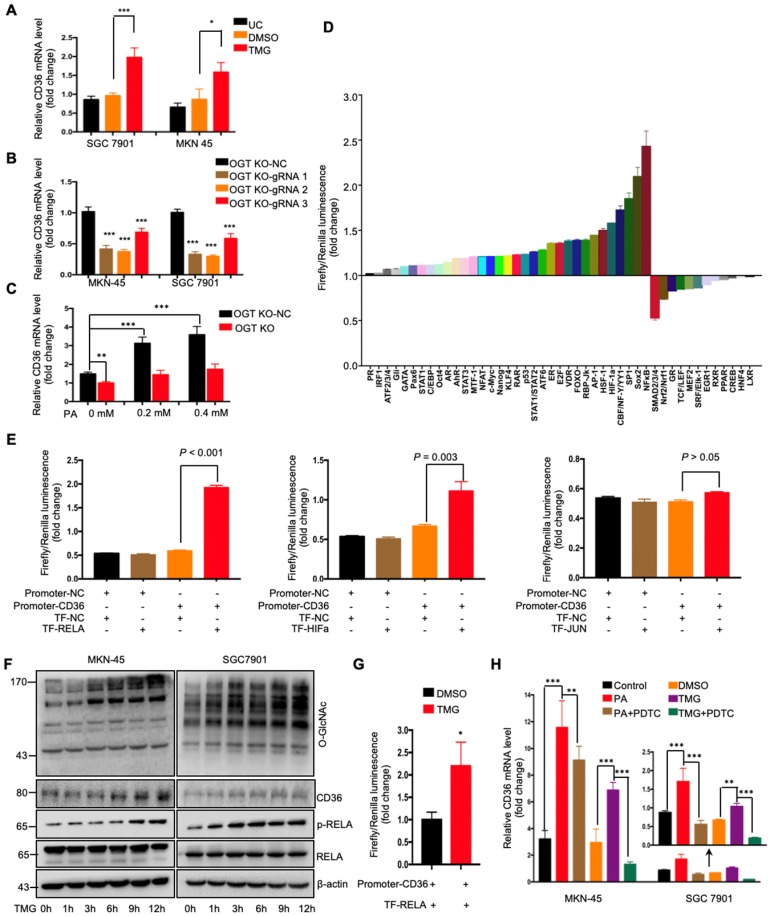
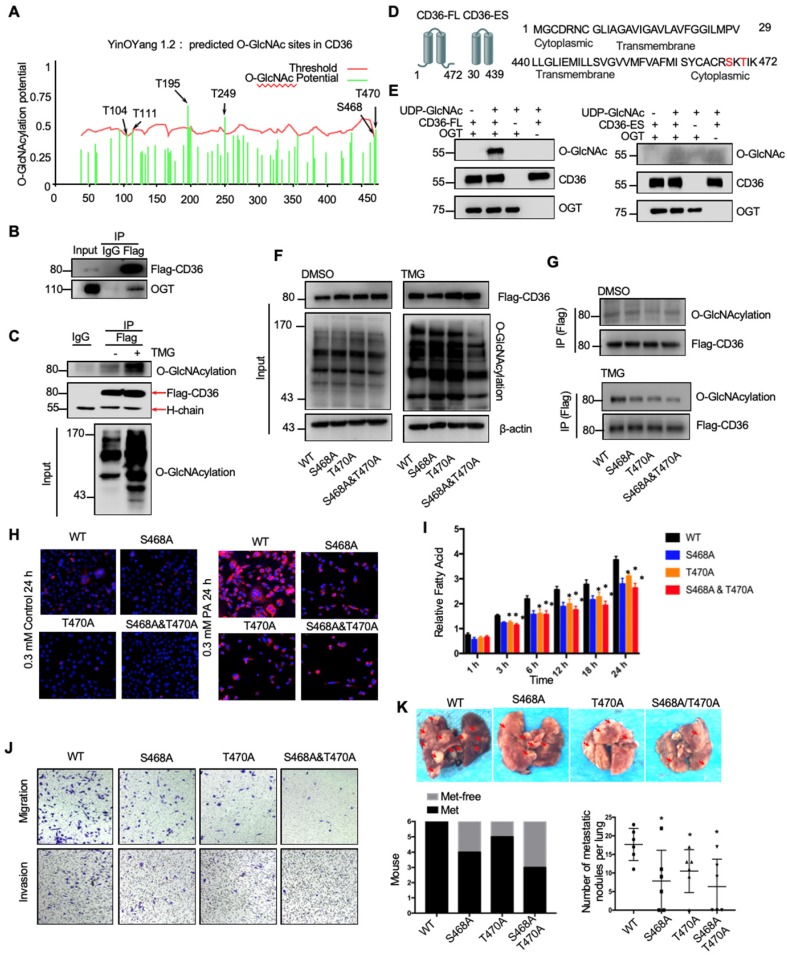
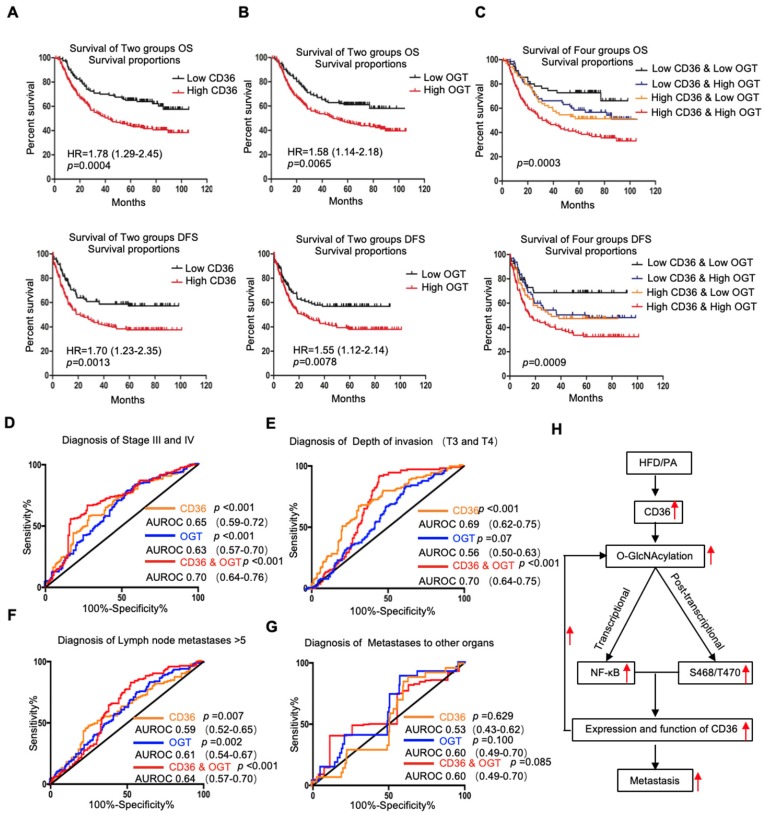
Metastasis is the primary cause of death in patients with advanced cancer. Recently, a high-fat diet was shown to specifically promote the metastatic potential of specific cancer cells in a CD36-dependent manner. However, the molecular basis of the fatty acid (FA)-induced upregulation of CD36 has remained unclear. Methods: RT-qPCR, FACS analysis, immunoblotting and immunohistochemistry, as well as retrieving TCGA database, were carried out to quantitate CD36 expression in gastric cancer (GC) tissues and cell lines. Transwell assay and xenografts were used to assess cell metastasis abilities in vitro and in vivo after indicated treatment. Luciferase reporter assay was carried out to evaluate the changes in signaling pathways when O-GlcNAcylation level was increased in GC cells and in vitro O-GlcNAcylation assay was utilized for wild and mutant types of CD36 protein to explore the potential O-GlcNAcylation sites. Results: High CD36 expression is a predictor of poor survival and promotes metastasis of GC cells and the use of neutralizing antibodies to block CD36 inhibits GC metastasis in mice. FA or a HFD promotes the metastatic potential of GC cells by upregulating CD36 via increasing the O-GlcNAcylation level. Increased O-GlcNAcylation levels promote the transcription of CD36 by activating the NF-κB pathway and also increase its FA uptake activity by directly modifying CD36 at S468 and T470. Conclusion: FA-induced hyper-O-GlcNAcylation promotes the transcription and function of CD36 by activating the NF-κB pathway and directly modifying CD36 at S468 and T470, which drives GC metastasis.

Keywords: CD36; O-GlcNAcylation; fatty acid; gastric cancer; metastasis.


Conflict of interest statement

Competing Interests: The authors have declared that no competing interest exists.

Figures

Figure 1
Figure 1
Upregulation of CD36 predicts poor survival in GC. (A) CD36 gene copy number in 305 GC tumor samples and 94 normal controls from TCGA data. The data were analyzed by ONCOMINE. (B,C) Kaplan-Meier curve depicting the OS of 876 GC patients (B) and the progression-free survival of 641 GC patients (C). The data were analyzed by a Kaplan-Meier plotter (http://kmplot.com/analysis/). (D) Representative images of IHC staining of CD36 in primary tumor tissues and positive metastatic lymph nodes of three GC patients.
Figure 2
Figure 2
Upregulation of CD36 in GC cell promotes cell metastasis. (A) Flow cytometry analysis showing the expression of CD36 in SGC 7901-NM cells transfected with a lentiviral vector encoding CD36 or negative control vector. K isotype IgG was used as a negative control. (B)3D spheroid BME cell invasion assay of SGC 7901-NM cells transfected with lentiviral vector encoding CD36 (LV-CD36) or with negative control vector (LV-NC). Photographs of all the spheroids in each well every 24 h for 7 days using a 4× objective. Quantitative analysis of the surface area of all spheroids. Normalized areas for all the spheroids are presented relative to the area on the first day. All of the areas were calculated three times using ImageJ, and the values represent the means ± SD. (C) The indicated cells were injected into nude mice (n = 6 for each group) via the tail vein along with weekly intraperitoneal injections of 20 μg of the anti-CD36 neutralizing monoclonal antibody JC63.1 or 20 μg of the corresponding IgA. Animals were sacrificed at 8 weeks after the injections. Photos of representative lung tissue samples in each group are shown. (D) Left: The histogram shows the proportion of mice with lung metastasis in each group. “Met” is short for “metastasis,” and “Met-free” indicates “metastasis-free.” Right: Mann Whitney test was used to evaluate the number of metastatic nodes in the lungs of mice from each group.
Figure 3
Figure 3
High fat diets induced CD36 expression and promoted metastasis in mice. (A) SGC 7901 cells were injected into the tail vein of nude mice (n = 9 for each group) fed either a HFD or a normal chow diet. Photos of representative lung tissue samples in each group are shown. (B) Left: The histogram shows the proportion of mice with lung metastasis in each group. “Met” is short for “metastasis,” and “Met-free” represents “metastasis-free.” Right: Mann Whitney test was used to evaluate the number of metastatic nodes in the lungs of each group. (C) Representative CD36 staining of the metastatic nodes in mouse lungs from the HFD or normal chow diet groups. (D) CD36 mRNA levels in MKN-45 or SGC 7901 cells were assessed by real-time PCR after treatment with the indicated concentration of PA or control solvent for 24 h. The values shown are expressed as the means ± SD of three independent experiments. (E) Flow cytometry analysis of CD36 levels in MKN-45 or SGC 7901 cells after treatment with the indicated concentration of PA or control solvent for 24 h. K isotype IgG was used as a negative control. (F, G) Immunofluorescence staining showed the FA and CD36 levels in SGC 7901 cells without (F) or with (G) 0.4 µM PA treatment for 24 h. FAs were stained by Nile red.
Figure 4
Figure 4
PA treatment promoted metastasis and induced CD36 expression through activating the HBP. (A) GFAT and OGT mRNA levels in MKN-45 or SGC 7901 cells were assessed by real-time PCR after treatment with the indicated concentration of PA or control solvent for 3 h. The values shown are expressed as the means ± SD of three independent experiments. (B) GFAT, OGT and CD36 levels in MKN-45 or SGC 7901 cells were assessed by western blotting after treatment with the indicated concentration of PA or control solvent for 3 h. (C) The levels of O-GlcNAcylation in MKN-45 or SGC 7901 cells were assessed by western blotting after treatment with 10 μM TMG or isometric DMSO for 24 h. β-actin was used as a loading control. (D) Transwell migration and invasion assay of MKN-45 and SGC 7901 cells after10 μM TMG or isometric DMSO treatment for 24 h. (E) Indicated cells were injected into nude mice (n = 10 for each group) via the tail vein and mice were fed with HFD. Animals were sacrificed at 6 weeks after the injections. Representative HE staining of the metastatic nodes in mouse lungs from each group. (F) Left: The histogram shows the proportion of mice with lung metastasis in each group. “Met” is short for “metastasis,” and “Met-free” represents “metastasis-free.” Right: Mann Whitney test was used to evaluate the number of metastatic nodes in the lungs of each group. * represents Mann Whitney test p < 0.05.
Figure 5
Figure 5
O-GlcNAcylation promoted CD36 transcription via activating the NF-κB pathway. (A) CD36 mRNA levels in MKN-45 or SGC 7901 cells were assessed by real-time PCR after a 24-hour treatment with TMG (10 μM) or isometric DMSO. (B) CD36 mRNA levels were assessed in MKN-45 or SGC 7901 OGT-knockout cells by real-time PCR. (C) CD36 mRNA levels in SGC 7901 cells with or without OGT knockout after treatment with the indicated concentration of PA for 24 h. (D) A luciferase reporter assay showed changes in the activity of 45 signal transduction pathways in SGC 7901 cells after a 24-hour treatment with TMG (10 μM). (E) A luciferase reporter assay showed the regulation of CD36 transcription by the indicated transcription factors in HEK 293T cells. (F) The levels of O-GlcNAcylation, RELA, phosphorylated RELA and CD36 in MKN-45 or SGC 7901 cells were assessed by western blotting after treatment with 10 μM TMG or isometric DMSO for the indicated times. β-actin was used as a loading control. (G) A luciferase reporter assay showed the regulation of CD36 transcription by NF-κB after treatment with 10 μM TMG or isometric DMSO for 12 h. (H) CD36 mRNA levels in MKN-45 or SGC 7901 cells were assessed by real-time PCR after the indicated treatment. The values shown are expressed as the means ± SD of three independent experiments. Control: control solvent treatment for 24 h; PA: treatment with 0.4 μM of PA for 24 h; PA+PDTC: treatment with 0.4 μM of PA for 24 h and pretreatment with 50 µmol of pyrrolidine dithiocarbamate for 4 h; DMSO: isometric DMSO treatment for 24 h; TMG: treatment with 10 μM of TMG for 24 h; TMG+PDTC: treatment with 10 μM of TMG for 24 h and pretreatment with 50 µmol of pyrrolidine dithiocarbamate for 4 h.
Figure 6
Figure 6
O-GlcNAcylation modification of CD36 in S468 and T470 enhances its FA uptake activity. (A) The O-GlcNAc sites of CD36 predicted by the YinOYang 1.2 server (www.cbs.dtu.dk/services/YinOYang) are shown with a black arrowhead at the top. The green vertical lines show the potential O-GlcNAc-modified Ser/Thr residues, and the red horizontal wavy line indicates the threshold for modification potential. (B) Total lysates from SGC 7901 cells expressing FLAG-tagged CD36 (FLAG-CD36) were subjected to IP with FLAG Ab, followed by western blotting using the indicated antibodies (Abs). (C) Total lysates from SGC 7901 cells expressing FLAG-tagged CD36 (FLAG-CD36) with or without TMG were subjected to IP with IgG or FLAG, followed by western blotting using O-GlcNAcylation or FLAG antibodies. (D) Schematic model of the recombinant CD36 full length (CD36-FL) protein and CD36 extracellular segment (CD36-ES). (E) O-GlcNAcylation assays using recombinant human CD36-FL or CD36-ES were performed in the presence or absence of UDP-GlcNAc or recombinant human OGT. Reaction mixtures were immunoblotted with antibodies against O-GlcNAc (RL2), CD36, and OGT. (F, G) Lentiviral vectors encoding FLAG-tagged wild-type (WT) CD36, CD36 with an alanine substitution at S468 (S468A), CD36 with an alanine substitution at T470 (T470A) or CD36 with alanine substitutions at both S468 and T470 (S468A/T470A) were transfected into SGC 7901 cells after knocking out endogenous CD36 expression. Then, the cells were treated with 10 μM TMG or isometric DMSO for 12 h before cell lysis, and then the O-GlcNAcylation of CD36 was detected. (H) Representative Nile red staining of SGC 7901 cells transfected with WT, S468A, T470A or S468A &T470A CD36 lentiviral vectors after treatment with 0.3 μM of PA or isometric control solvent for 24 h. (I) Fluorescence of SGC 7901 cells transfected with the indicated lentiviral vector. Fluorescence was measured at the indicated times after the addition of uptake reaction mix. Data are expressed as the mean RFU ± SD of three independent plates, with each data point representing the mean of quadruplicate wells. * represents Student's t test p < 0.05. (J) Transwell assay of SGC 7901 cells transfected with the indicated lentiviral vector after 0.4 μM PA treatment for 24 h. (K) Indicated SGC 7901 cells were injected into the tail vein of nude mice (n = 6 for each group) fed either a HFD or a normal chow diet. Photos of representative lung tissue samples in each group are shown. Left: The histogram shows the proportion of mice with lung metastasis in each group. “Met” is short for “metastasis,” and “Met-free” represents “metastasis-free.” Right: Mann Whitney test was used to evaluate the number of metastatic nodes in the lungs of each group.
Figure 7
Figure 7
Association of CD36 and OGT expression with the prognosis of GC patients. (A-C) Kaplan-Meier curve depicting the OS and progression-free survival of a publicly available cohort of 300 GC patients (GSE62254). High and low expression of CD36 or OGT were defined by patients whose tumors expressed CD36 or OGT at levels higher and lower than the median, respectively. (D-G) Area under the receiver-operating characteristic (AUROC) curves of CD36 or OGT or both were used to diagnose the indicated patients in all 300 GC patients from GSE62254. (H) Schematic model of Fatty acid-induced CD36 expression via O-GlcNAcylation drives gastric cancer metastasis.

References

    1. Fidler IJ. The pathogenesis of cancer metastasis: the 'seed and soil' hypothesis revisited. Nat Rev Cancer. 2003;3:453–8. - PubMed
    1. Chaffer CL, Weinberg RA. A perspective on cancer cell metastasis. Science. 2011;331:1559–64. - PubMed
    1. Siegel RL, Miller KD, Jemal A. Cancer Statistics, 2017. CA Cancer J Clin. 2017;67:7–30. - PubMed
    1. Bertuccio P, Chatenoud L, Levi F. et al. Recent patterns in gastric cancer: a global overview. Int J Cancer. 2009;125:666–73. - PubMed
    1. Torre LA, Bray F, Siegel RL. et al. Global cancer statistics, 2012. CA Cancer J Clin. 2015;65:87–108. - PubMed

Publication types

MeSH terms