. 2019 Aug 13;28(7):1703-1716.e6.
doi: 10.1016/j.celrep.2019.07.032.

m6A RNA Methylation Maintains Hematopoietic Stem Cell Identity and Symmetric Commitment

Affiliations

m6A RNA Methylation Maintains Hematopoietic Stem Cell Identity and Symmetric Commitment

Yuanming Cheng et al. Cell Rep. .

Abstract

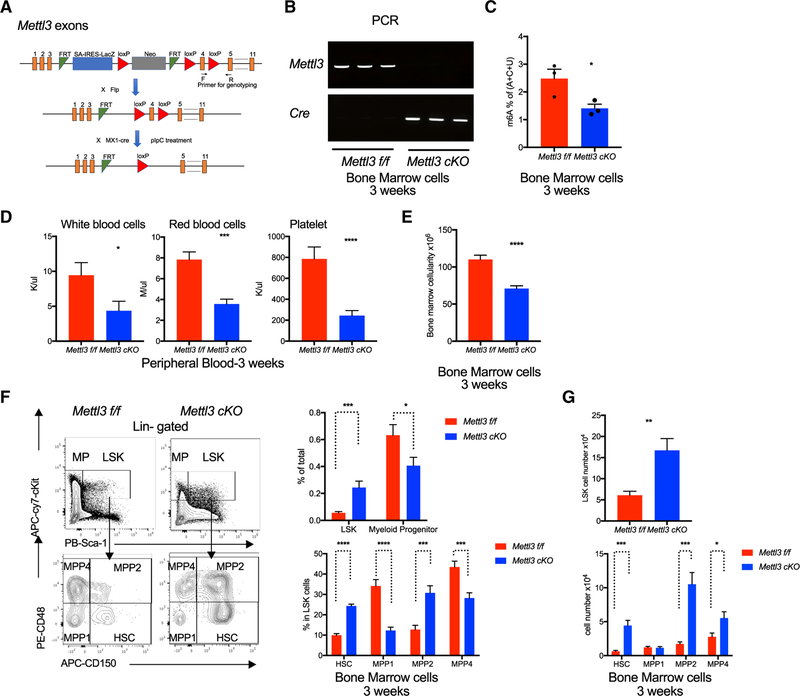
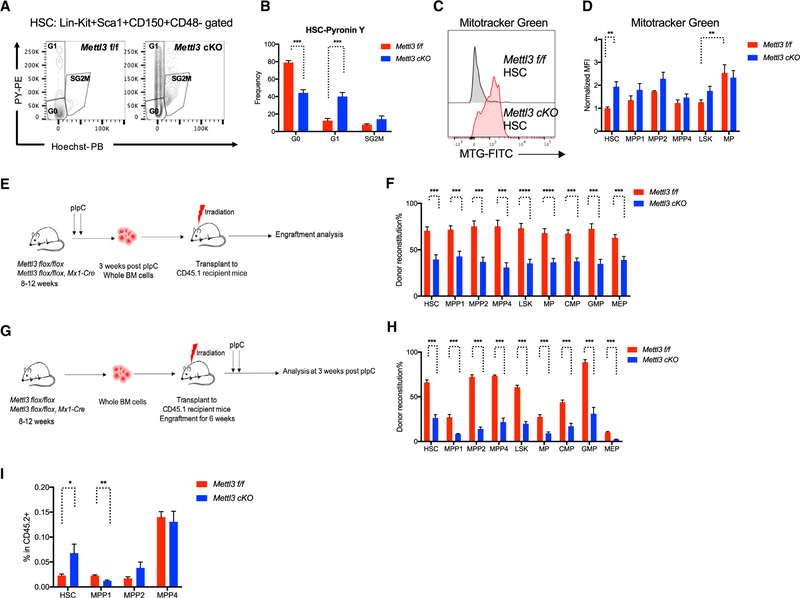
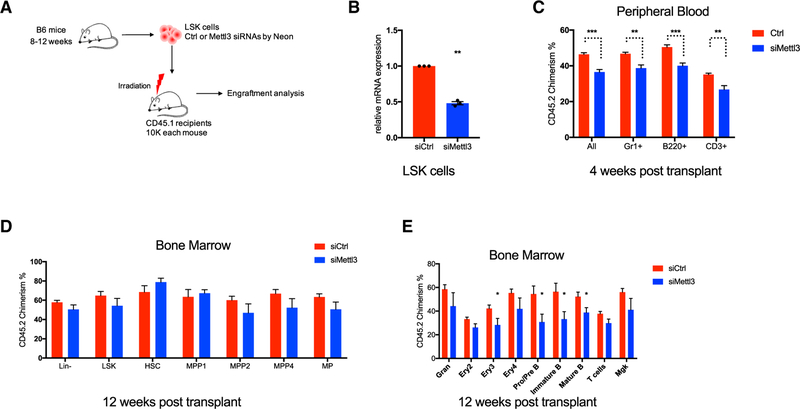
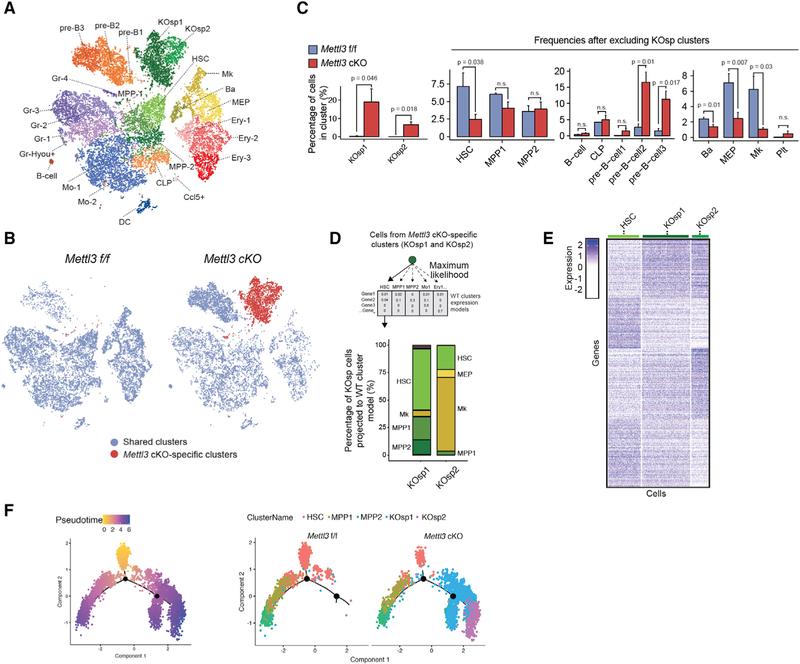
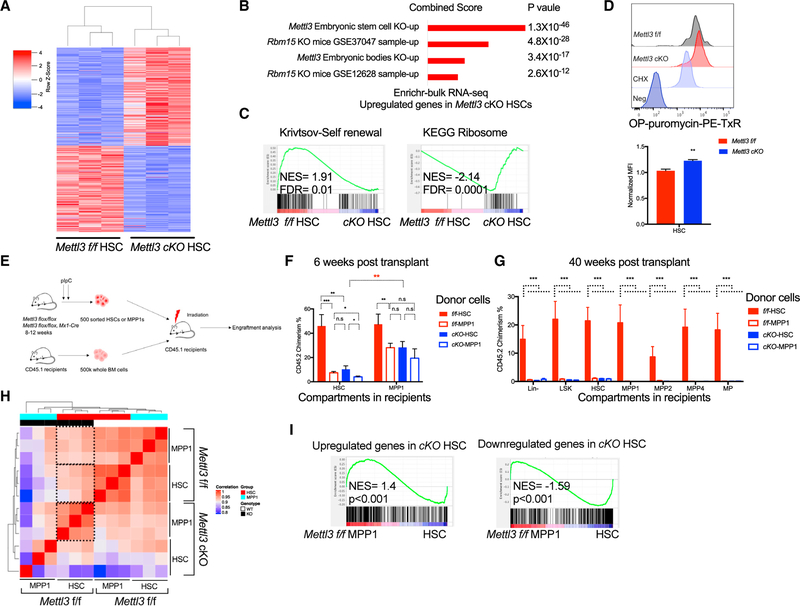
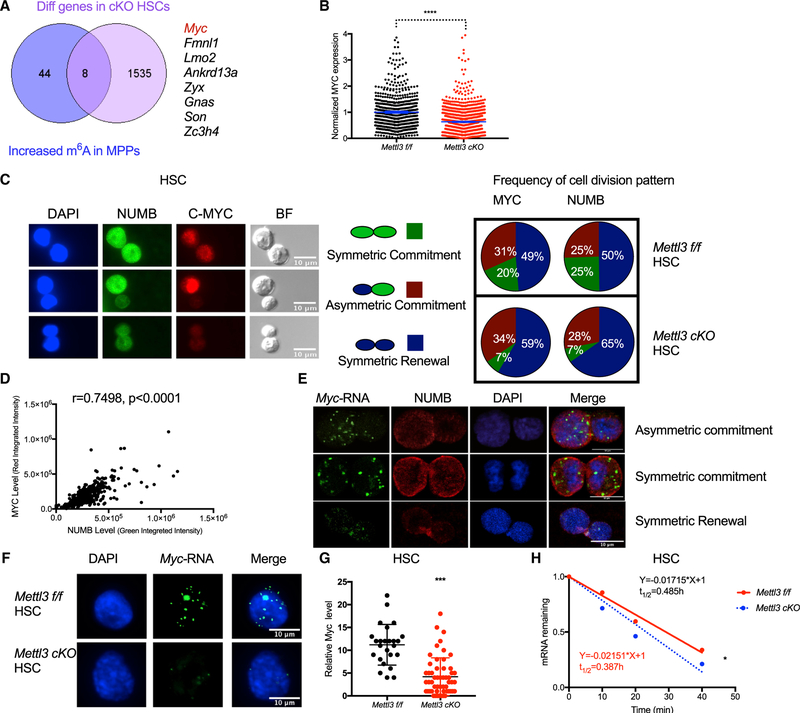
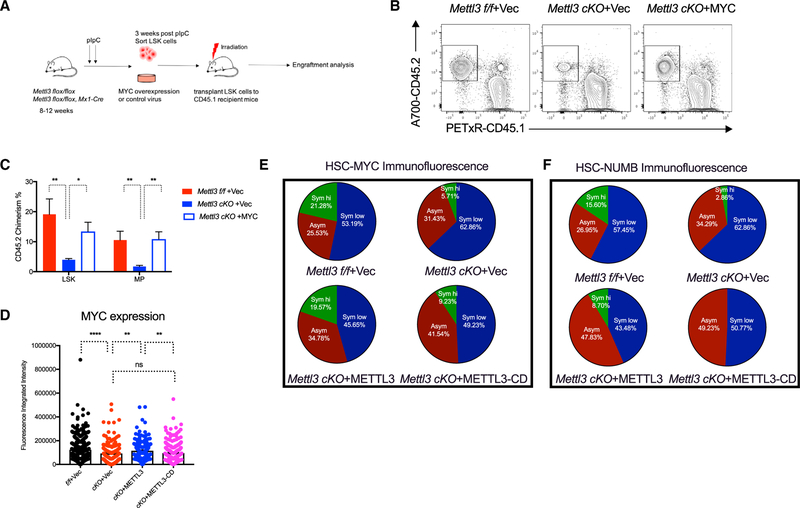
Stem cells balance cellular fates through asymmetric and symmetric divisions in order to self-renew or to generate downstream progenitors. Symmetric commitment divisions in stem cells are required for rapid regeneration during tissue damage and stress. The control of symmetric commitment remains poorly defined. Using single-cell RNA sequencing (scRNA-seq) in combination with transcriptomic profiling of HSPCs (hematopoietic stem and progenitor cells) from control and m6A methyltransferase Mettl3 conditional knockout mice, we found that m6A-deficient hematopoietic stem cells (HSCs) fail to symmetrically differentiate. Dividing HSCs are expanded and are blocked in an intermediate state that molecularly and functionally resembles multipotent progenitors. Mechanistically, RNA methylation controls Myc mRNA abundance in differentiating HSCs. We identified MYC as a marker for HSC asymmetric and symmetric commitment. Overall, our results indicate that RNA methylation controls symmetric commitment and cell identity of HSCs and may provide a general mechanism for how stem cells regulate differentiation fate choice.

Keywords: MYC; RNA methylation; cell identity; hematopoietic stem cell; m(6)A; symmetric and asymmetric cell division.


Figures

Figure 1.
Figure 1.. Expansion of HSCs in Mettl3 cKO Mice
(A) Target scheme for Mettl3 conditional knockout (cKO) mice. Primers were designed for genotyping by targeting Mettl3 exon 4. (B) Successful deletion of Mettl3 in the cKO bone marrow 3 weeks post-pIpC injections. PCR by using genomic DNA from pIpC-treated mice bone marrow cells to validate Mettl3 exon4 deletion and Ore expression. Primers used were indicated in (A). (C) Decreased m6A in cKO mice 3 weeks post-pIpC. Global m6A levels in Mettl3 f/f and Mettl3 cKO BM cells were measured by two-dimensional thin-layer chromatography (TLC). n = 3. (D) Mettl3 cKO mice developed a pancytopenia phenotype 3 weeks post-pIpC. Whole blood counts of white blood cell (WBCs), red blood cells (RBCs), and platelets (PLT) of Mettl3 f/f and Mettl3 cKO mice. n = 11. (E) Reduction in bone marrow cellularity in cKO mice 3 weeks post-pIpC. Bone marrow cellularity of Mettl3 f/f and Mettl3 cKO mice was determined. n = 11. (F) Left: representative flow cytometry plots for gating strategies of hematopoietic stem and progenitor cell (HSPC) compartments. An expansion in HSPC population and a reduction in myeloid progenitors upon Mettl3 depletion. Right top: frequency of LSK (LincKit+Sca-1+) and MP (Myeloid progenitor, LincKit+Sca-1) in BM cells. Right bottom: percentage of HSC (LSK, CD150+CD48), MPP1 (LSK, CD150CD48), MPP2 (LSK, CD150+CD48+), and MPP4 (LSK, CD150CD48+) in LSK population. n = 11. (G) Absolute cell numbers of LSKs, HSCs, and MPPs in Mettl3 f/f and Mettl3 cKO mice at 3weeks post-pIpC injection. n = 11. Mean and SEM are shown (*p<0.05, **p < 0.01, ***p < 0.001, and ****p < 0.0001). n represents number of mice.
Figure 2.
Figure 2.. Mettl3 cKO HSCs Are Less Quiescent and Functionally Defective
(A) Mettl3 cKO HSCs are less quiescent. Representative flow cytometry plots for assessing cell cycle status of Mettl3 f/f and Mettl3 cKO HSC by Pyronin Y staining. (B) Quantification of cell cycle analysis. n = 5. (C) Increased mitochondrial mass in Mettl3 cKO HSCs. Representative histograms of Mitotracker Green staining in Mettl3 f/f and Mettl3 cKO HSCs. (D) Mitochondrial mass of different HSPC population was evaluated by Mitotracker Green staining quantified by flow cytometry. n = 5. (E) Scheme of transplant strategy. Non-competitive reconstitution assay in which 106 donor BM cells from Mettl3 f/f or Mettl3 cKO mice at 3 weeks post-plpC were transplanted into CD45.1 congenic recipient mice. (F) Mettl3 cKO bone marrow fails to reconstitute hematopoietic compartments in recipient mice. CD45.2 chimerisms of HSCs, MPPs and progenitor compartments from (E) were analyzed by flow cytometry at 16 weeks post-transplant. n = 10. (G) Scheme of the experimental procedure in (H) and (I). CD45.1 recipient mice were transplanted with Mettl3 flox/flox Cre or Cre+ bone marrow cells (pre-plpC). At 6 weeks post-transplantation, CD45.1 congenic recipient mice were then injected with plpC to deplete METTL3. (H) The reconstitution defect in Mettl3 cKO bone marrow is cell-autonomous. CD45.2 chimerism analysis of HSCs, MPPs, and progenitor compartments from experiment (G) at 3 weeks post-pIpC. n = 5. (I) Frequencies of HSCs and MPPs in the donor CD45.2 population from experiment (G). n = 5. Mean and SEM are shown (*p < 0.05, **p < 0.01, ***p < 0.001, and ****p < 0.0001). n represents number of mice.
Figure 3.
Figure 3.. Acute Depletion of Mettl3 Leads to a Reversible Defect in HSC Repopulating Capacity
(A) Experimental scheme for acute knockdown of Mettl3 in LSK cells by siRNA followed by transplantation. (B) qRT-PCR of Mettl3 to confirm the knockdown efficiency in LSK cells from (A). (C) Donor engraftments ofCD45.2 in different lineage compartments were analyzed by flow cytometry in peripheral blood at 4 weeks post-transplant from (A). ctrl n = 10; siMettl3 n = 5. (D) CD45.2 chimerism analysis of HSCs, MPPs, and progenitor compartments in bone marrow from experiment (A) at 12 weeks post-transplant. ctrl n = 10; siMettl3 n = 5. (E) CD45.2 chimerism analysis of different lineage populations in bone marrow from experiment (A) at 12weeks post-transplant. ctrl n = 10; siMettl3 n = 5. Mean and SEM are shown (*p < 0.05, **p < 0.01, ***p < 0.001, and ****p < 0.0001). n represents number of mice.
Figure 4.
Figure 4.. Mettl3 Deletion Results in a Defect in Lineage Commitment and the Development of Two Distinct HSC-like Populations
(A) Identification of different hematopoietic clusters in Mettl3 f/f and Mettl3 cKO LineagecKit+ cells base on tSNE analysis from slngle-cell RNA sequencing (scRNA-seq). (B) Two specific clusters in Mettl3 cKO LincKit+ cells. tSNEs analysis of scRNA-seq. KO-specific clusters were labeled as red. n = 3. (C) Quantification of cell frequencies of different populations in cKO LincKit+ cells compared to Mettl3 f/f base on scRNA-seq. (D) Specific clusters in Mettl3 cKO are HSC-like. Maximum likelihood of the KO-specific cells into the WT expression models was performed base on the transcriptome profile from scRNA-seq. (E) Heatmap of differentially expressed genes between HSC cluster and KO SP clusters from scRNA-seq. (F) Pseudo-time reconstruction of the hierarchy of cell differentiation by Monocle analysis base on scRNA-seq. Left branch indicated HSC commitment to MPPs. Right branch indicated trajectory from HSC to Mettl3 cKO specific clusters. n represents number of mice.
Figure 5.
Figure 5.. Mettl3-Deleted HSCs Are More Functionally and Molecularly MPP-like
(A) Significant differentially expressed genes (padj < 0.05) in cKO HSCs compared to Mettl3 f/f were shown as heatmap. (B) Differentially expressed genes in Mettl3 cKO HSCs were enriched with Mettl3 KO ESC and RBM15 KO LSK expression signatures. Enrichr analysis using upregulated genes in METTL3-depleted HSCs from bulk RNA-seq. (C) Unbiased gene set enrichment analysis using 4,733 curated gene sets against the rank list of differential expressed genes between Mettl3 f/f and cKO HSCs. Self-renewal signature was negatively enriched in Mettl3 cKO HSCs. Translation and ribosome gene sets were positively enriched in Mettl3 cKO HSCs. (D) Increased global translation in Mettl3 cKO HSCs. Representative histograms (top) and quantification (bottom) of OP-Puro incorporation into sorted Mettl3 f/f and cKO HSCs. (E) Scheme of transplant strategy in (F). Sorted HSCs and MPP1s from Mettl3 f/f and Mettl3 cKO mice were injected into CD45.1 recipient mice with CD45.1 competitor BM cells. (F) Mettl3 cKO HSCs function as MPP1s in competitive transplant assays. Engraftment of CD45.2 donor cells was analyzed in HSPCs from recipient mice at 6 weeks. n = 10. (G) Engraftment of CD45.2 donor cells was analyzed in HSPCs from recipient mice at 40 weeks. n = 10. (H) Spearman correlation among HSC and MPP1 populations from Mettl3 f/f and Mettl3 cKO mice. (I) Gene set enrichment analysis of up-or downregulated genes in Mettl3 cKO HSC identified by bulk RNA-seq, against the rank list of differentially expressed genes between Mettl3f/f HSC and Mettl3f/f MPP1. Mean and SEM are shown (*p<0.05, **p<0.01, ***p<0.001, and ****p < 0.0001). n represents number of mice.
Figure 6.
Figure 6.. Mettl3 Is Required for HSC Symmetric Commitment by Regulating mRNA Stability of Myc
(A) Overlap of the 52 genes that have increased m6A abundance in MPPs than HSCs with differentially expressed genes between Mettl3 f/f and cKO HSCs, as depicted in a Venn diagram. Myc is highlighted in red. (B) m6A enrichment in the Myc transcript in Mettl3 f/f and cKO HSPCs was assessed by MeRIP-qPCR. Two primers were used to indicate different m6A sites on Myc RNA. (C) MYC protein level is reduced in Mettl3 cKO HSCs upon cell division. MYC expression in Mettl3 cKO HSCs compared to Mettl3 f/f HSCs as quantified by immunofluorescence. (D) Mettl3 cKO HSCs fail to undergo symmetric commitment compared to control HSCs. Left: representative immunofluorescence images of paired daughter cells stained with DAPI (blue), NUMB (green), MYC (red), and brightfield. Right: percentages of doublet cells in each type of cell division. Number of daughter pairs assessed: Mettl3 f/f n = 223; cKO n = 245. n represents number of paired HSCs measured. (E) MYC expression correlates with NUMB expression during HSC division. (F) Myc mRNA can be segregated into daughter cells asymmetrically, symmetrically high, and symmetrically low. Representative images of fluorescence in situ hybridization (FISH) of Myc mRNA (green) and fluorescence immunostaining of NUMB (red) and DAPI (blue) in HSCs. (G) Myc mRNA is significantly decreased in Mettl3 cKO HSCs. Representative images of FISH of Myc mRNA (green) and DAPI (blue) in Mettl3 f/f and Mettl3 cKO HSCs. (H) Quantification of Myc mRNA in HSCs from Mettl3 f/f and Mettl3 cKO mice. (I) The mRNA half-life (t1/2) of Myc transcripts in Mettl3 f/f and Mettl3 cKO HSCs. Mean and SEM are shown (*p < 0.05, **p < 0.01, ***p < 0.001, and ****p < 0.0001).
Figure 7.
Figure 7.. MYC Overexpression Can Partially Rescue Reconstitution Defect in Mettl3 cKO HSPCs
(A) Scheme of experiment strategy. LSK cells were sorted from Mettl3 f/f and Mettl3 cKO mice and transduced with control and MYC overexpression retrovirus. Donor cells were then transplanted into CD45.1 recipient mice with CD45.1 competitor BM cells. (B) Quantification of the frequency of donor-derived cells was shown in LSK and MP populations, n = 9. n represents number of mice. (C) MYC overexpression rescues the repopulating defect of Mettl3 cKO LSKs. Representative flow cytometry plots of engraftment of donor-derived CD45.2 cells. (D) METTL3 overexpression rescue MYC expression defect in Mettl3 cKO HSCs as quantified by immunofluorescence. (E and F) Paired daughter cell assay using sorted HSCs from Mettl3 f/f and Mettl3 cKO mice transfected with vectors expressing METTL3 or METTL3-CD or empty vector as control to indicate MYC (E) and NUMB (F) expression. Pie chart shows different types of cell divisions in HSCs as indicated. Number of daughter pairs assessed: Mettl3 f/f +Vec, n = 141; cKO+Vec, n = 35; cKO+METTL3 WT, n = 45; and cKO+METTL3 CD, n = 65.n represents number of paired HSCs measured. Mean and SEM are shown (*p < 0.05, **p < 0.01, ***p < 0.001, and ****p < 0.0001).

References

    1. Attar EC, and Scadden DT (2004). Regulation of hematopoietic stem cell growth. Leukemia 18, 1760–1768. - PubMed
    1. Bahr C, von Paleske L, Uslu VV, Remeseiro S, Takayama N, Ng SW, Murison A, Langenfeld K, Petretich M, Scognamiglio R, et al. (2018). A Myc enhancer cluster regulates normal and leukaemic haematopoietic stem cell hierarchies. Nature 553, 515–520. - PubMed
    1. Barbieri I, Tzelepis K, Pandolfini L, Shi J, Millán-Zambrano G, Robson SC, Aspris D, Migliori V, Bannister AJ, Han N, et al. (2017). Promoter-bound METTL3 maintains myeloid leukaemia by m6A-dependent translation control. Nature 552, 126–131. - PMC - PubMed
    1. Batista PJ, Molinie B, Wang J, Qu K, Zhang J, Li L, Bouley DM, Lujan E, Haddad B, Daneshvar K, et al. (2014). m(6)A RNA modification controls cell fate transition in mammalian embryonic stem cells. Cell Stem Cell 15, 707–719. - PMC - PubMed
    1. Boriack-Sjodin PA, Ribich S, and Copeland RA (2018). RNA-modifying proteins as anticancer drug targets. Nat. Rev. Drug Discov. 17, 435–453. - PubMed

Publication types