. 2019 Aug 13;28(7):1814-1829.e6.
doi: 10.1016/j.celrep.2019.07.038.

Complex Economic Behavior Patterns Are Constructed from Finite, Genetically Controlled Modules of Behavior

Affiliations

Complex Economic Behavior Patterns Are Constructed from Finite, Genetically Controlled Modules of Behavior

Cornelia N Stacher Hörndli et al. Cell Rep. .

Abstract

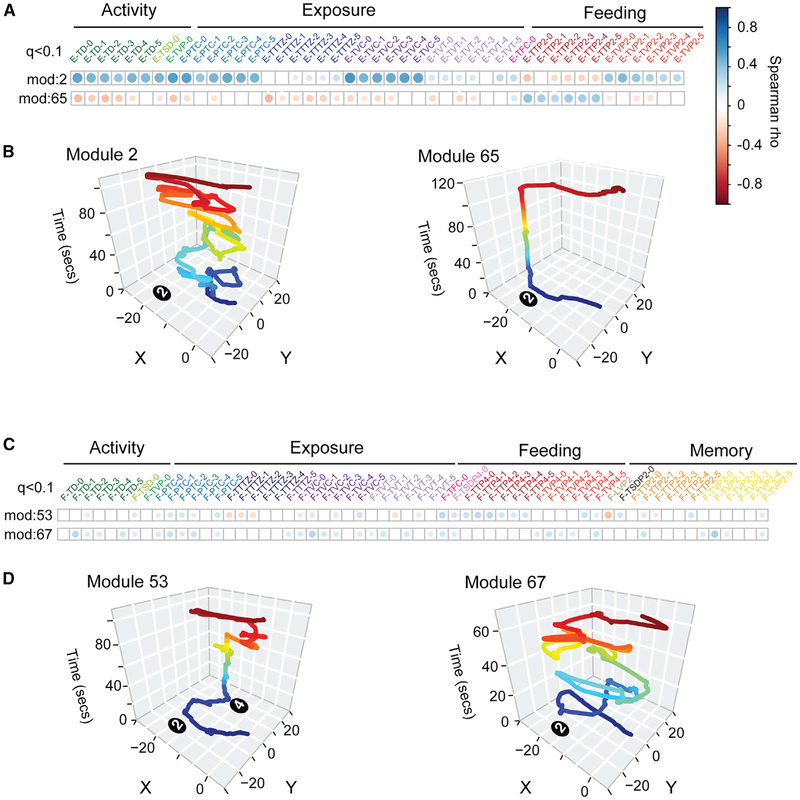
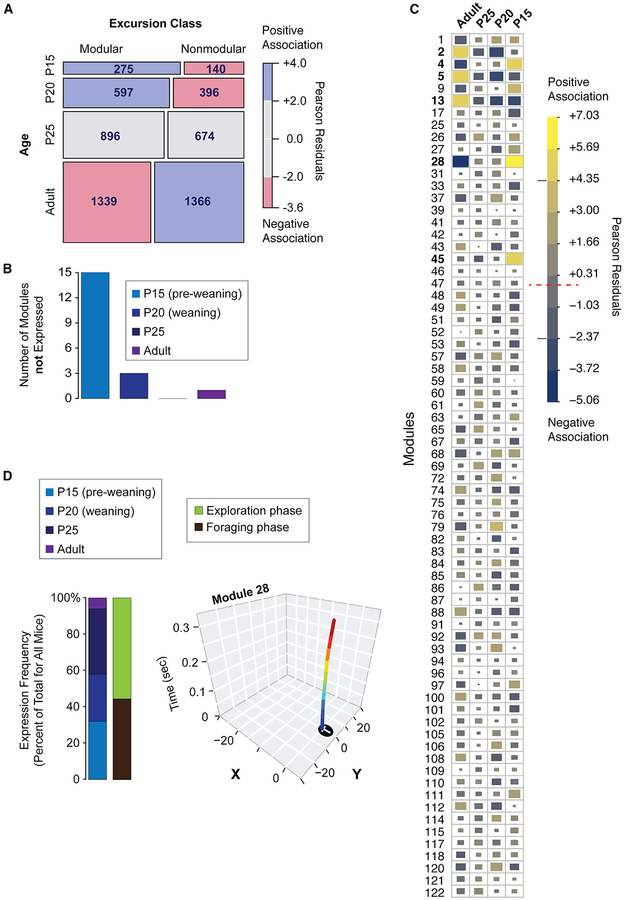
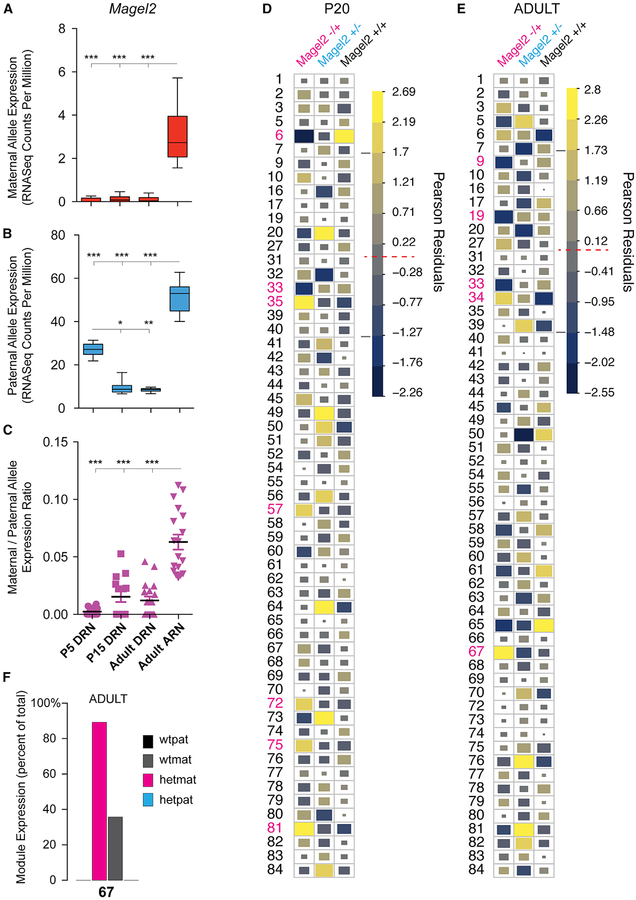
Complex ethological behaviors could be constructed from finite modules that are reproducible functional units of behavior. Here, we test this idea for foraging and develop methods to dissect rich behavior patterns in mice. We uncover discrete modules of foraging behavior reproducible across different strains and ages, as well as nonmodular behavioral sequences. Modules differ in terms of form, expression frequency, and expression timing and are expressed in a probabilistically determined order. Modules shape economic patterns of feeding, exposure, activity, and perseveration responses. The modular architecture of foraging changes developmentally, and different developmental, genetic, and parental effects are found to shape the expression of specific modules. Dissecting modules from complex patterns is powerful for phenotype analysis. We discover that both parental alleles of the imprinted Prader-Willi syndrome gene Magel2 are functional in mice but regulate different modules. Our study found that complex economic patterns are built from finite, genetically controlled modules.

Keywords: Prader-Willi syndrome; behavior; epigenetics; foraging; genomic imprinting; machine learning; neuroeconomics; neuroscience.


Conflict of interest statement

DECLARATION OF INTERESTS

The authors declare that a patent on this work is pending.

Figures

Figure 1.
Figure 1.. A Paradigm to Dissect Rich Foraging Patterns in Mice
(A) Schematic depiction of the study hypothesis. Modules are finite, reproducible behavioral sequences that are building blocks for different patterns over time (pattern 1 versus 2). Different patterns are created by changing the expression frequency, timing, and sequential order of modules of behavior (colored blocks). Changes to foraging patterns shape the relative economic balance of caloric intake (reward), predation risk (risk), and energy expenditure (effort). (B–E) Foraging assay paradigm. (B) The foraging arena is constructed with a platform that holds pots containing sand and one with sand and seeds. The mouse home base cage plugs into the arena through a tunnel on the side. (C) A summary of the foraging testing workflow. (D) The naive exploration phase arena configuration. (E) The familiar foraging phase arena configuration in which the seeds are hidden in the sand in pot 4 and pot 2 is the formerly learned food patch. (F) An example of x-y tracking of the body center point over time during the foraging assay. The mice perform repeated round trip excursions from the home base cage (orange numbered track sections). Different excursions have different behavioral and locomotor features (gait speed shown by colors in legend). Modules are uncovered from excursions using DeepFeats.
Figure 2.
Figure 2.. Identification of Behavioral Measures Best Resolving Candidate Modules from Foraging Patterns
(A) The bar plot shows the number of excursion clusters detected by Dynamic Tree Cut from unsupervised hierarchical clustering (Ward) of the foraging excursions based on the retained measures at different correlation thresholds. A Pearson correlation threshold of r < 0.3 to 0.4 yields the best resolution of distinct clusters (candidate modules; r < 0.4 was selected for our study [orange bar]). More relaxed thresholds (r > 0.4) may reduce cluster detection due to redundant measures that mask the effect of other measures. Thresholds that are too stringent (r < 0.3) may reduce cluster detection by pruning informative measures. (B and C) The bar plot shows the number of behavioral measures retained at different Pearson correlation thresholds (B). A total of 57 (black bar) measures are tested and the number retained at the selected threshold (r < 0.4) is 13 (orange bar). (C) The identity of the 13 measures that best resolve excursion clusters (candidate modules) are shown.
Figure 3.
Figure 3.. Discovery of 71 Significant Modules of Foraging Behavior across Different Ages and Strains of Mice
(A) Details of the training and testing data partitions and approach to test for significant cluster reproducibility using the IGP permutation test. Unsupervised hierarchical clustering (Ward) and Dynamic Tree Cut analysis identified 122 clusters (colored track) in the training data. The centroids for each training data cluster are used in the IGP permutation test with the test data (100,000 permutations yielded over 5,000 permutations per cluster). (B) Pie charts show the number of significantly reproducible training data clusters found by the IGP test. The data reveal 71 modules (q < 0.1, red), as well as nonmodular excursions (q > 0.1, gray). The number of excursions in each class is also shown. (C) A histogram showing the frequency at which each module is expressed across all 191 mice tested. Some are relatively infrequently (e.g., module 84 [m84]), moderately frequently (e.g., module 49), or frequently (e.g., module 4) expressed. (D) The plots show representative x-y traces of mouse movement over time (seconds) in the arena for examples of infrequently (module 84), moderately (module 49), and frequently (module 4) expressed modules. The traces track the center of the mouse’s body during the round-trip excursions, which start and end at the tunnel to the home (0,0). They are colored according to relative time. Different modules have different movement and temporal characters.
Figure 4.
Figure 4.. The Expression Order of Modular and Nonmodular Excursions Is Probabilistically Determined
(A and B) Ridgeplots reveal the distribution of start times for excursions of different module types in the exploration (A) and foraging (B) phases relative to the beginning of the 25-min testing period (data are from all 191 study mice). Modules detailed in the main text are highlighted in bold. (C) The chart shows the transition probabilities between specific modules (y axis, state 1) and modular versus nonmodular excursions (x axis, state 2) in the exploration phase. The plot is computed from a transition matrix of the number of times each transition type occurred across all 191 study mice. The transition to a modular versus nonmodular excursion (state 2) depends significantly on the type of module expressed (state 1) (Fisher’s exact test, p = 0.0002, two-sided test, Monte Carlo simulated p value). The strength of the transition probability is indicated by the size and shade of the box (see legend). If a box is not shown, then no association exists. Main text examples are highlighted in red. (D) Transition probabilities for modular versus nonmodular excursions following expression of module 100 or module 96. Probabilities are shown in brackets. (E) Transition probabilities of different modules following expression of module 74 in the foraging phase. Transitions to specific modules occur in probabilistically determined manner (Data S1 and S2). Dark purple modules, 20% probability; light purple modules, 9% probability.
Figure 5.
Figure 5.. Individual Modules Are Associated with Different Feeding, Exposure, Activity, and Perseveration Response Patterns
(A) The plot shows statistically significant correlations between module 2 or 65 (rows) and keystone measures of feeding, exposure, and activity in the exploration phase (columns). Correlations are calculated using the Spearman test on data from all 191 study mice (q < 0.1). Empty white squares indicate no significant correlation (q > 0.1). The magnitude of significant positive (blue) and negative (red) correlations between modules and keystone measures are indicated by dot size and shade (see legend). Both modules are significantly associated with the total food consumed (E-TFC-0) but are linked to different patterns of activity, exposure, and feeding in the exploration phase based on time spent and visits in different zones of the arena at different times during the trial (five 5-min time bins shown: −1, −2, −3, −4, and −5 and overall [0]). Thus, the different modules link to different economic patterns. (B) Representative traces of the x-y movement patterns for modules 2 and 65 are shown. Each module involves a different movement and temporal pattern. (C) The plot shows correlations between modules 53 and 67 with keystone measures of activity, exposure, feeding, and perseverative responses in the foraging phase. Both modules are significantly associated with total time at the former food pot (pot 2) at the beginning of the trial (F-TTP2–1), a measure of memory of the former food location. However, the two modules differ in links to other features describing activity, exposure, feeding, and memory and perseveration responses. (D) Representative foraging phase traces of the x-y movement patterns of excursions for modules 53 and 67 are shown. The different module forms and links to economic patterns are consistent with different functions.
Figure 6.
Figure 6.. Module Expression Develops in a Stereotyped Manner in Offspring
(A) A mosaic plot depicting a table of the numbers of modular and nonmodular excursions expressed at different ages. A chi-square test indicates that the relative expression of modular versus nonmodular excursions is dependent on age (p = 1.7 × 10⁻¹⁴). The mosaic plot boxes are scaled according to the relative numbers of excursions and colored according to positive (blue) and negative (red) associations between the rows and columns based on the Pearson residuals. P15 and P20 juveniles are positively associated with modular excursions, while adulthood is associated with relatively more nonmodular excursions. n = 20 adult, n = 16 P25, n = 15 P20, n = 16 P15. (B) Bar plot shows the number of modules that are not detected at different ages across all of the mouse strains tested. Some modules emerge at specific ages. (C) The chart shows the top modules impacted by age differences. Pearson residuals computed from a chi-square test are shown for module expression frequency data. The data show modules with expression frequencies that are positively (yellow) or negatively (blue) associated with each age. Relative effect size is depicted by color (see legend) and block size. The red dashed line in the legend shows the threshold at which the observed and expected module expression counts are the same (Pearson residuals equal zero). The gray lines show the threshold for the top age affected modules (bolded modules). (D) Stacked bar plots show the relative expression frequency of module 28 by age and phase (exploration, green; Foraging, brown). Representative x-y tracks for excursions for module 28 are shown. Module 28 is expressed predominantly by juveniles, not adults, and in both phases.
Figure 7.
Figure 7.. The Imprinted Maternal Magel2 Allele Is Expressed in the Brain and Has Significant but Distinct Effects on Module Expression Compared to the Paternal Allele
(A and B) Box plots of allele-specific F1cb and F1bc RNA-seq data show expression of the maternal (A, red) and paternal (B, blue) Magel2 alleles in the P5 (n = 14), P15 (n = 14), and adult (n = 18) female mouse dorsal raphe nucleus (DRN) and the adult female arcuate nucleus (ARN) (n = 18). Allele RNA-seq data are presented as read counts per million reads. The main effect of brain region is significant for the maternal (A) and paternal (B) allele data (p < 1 × 10⁻⁴, nonparametric Kruskal-Wallis test with Dunn’s post-test). Asterisks indicate significant post-test results and brain regions and/or ages with different expression levels. Plots indicate mean ± minimum maximum values. ***p < 0.001, **p < 0.01, and *p < 0.05, (C) The plot shows the expression of the maternal Magel2 allele normalized to the expression level of the paternal allele for each P5, P15, and adult DRN and ARN sample. Maternal allele expression is significantly increased in the ARN after normalizing for paternal allele activity (p < 1 × 10⁻⁴, nonparametric Kruskal-Wallis test with Dunn’s post-test). Plot indicates mean ± SEM. (D and E) The charts show the identity of the top modules impacted by loss of the maternal Magel2 allele (pink text) in P20 (D) and adult (E) offspring. The charts plot the Pearson residuals computed from a chi-square test of independence between modules and different Magel2 genotypes, including Magel2−/+, Magel2−/+, and Magel2+/+ controls for P20 juveniles (D) and adults (E). The data show modules with expression frequencies that are positively (yellow) and negatively (blue) associated with Magel2+/− mutants versus controls. Relative effect size is depicted by color (see legend) and block size and the most affected modules are highlighted (pink numbers). The data show specific modules with expression frequencies changed by loss of the maternal Magel2 allele. The modules differ from those impacted by loss of the paternal allele. For P20 and adult Magel2 mice, n = 22/18 Magel2m+’/p+, n = 28/23 Magel2m−/p+, n = 22/20 Magel2m+/p+’ and n = 22/20 Magel2m+/p−. (F) The bar plots show the percentage of excursions that are expressed by the different Magel2 genotypes for module 67 in adults. This module is preferentially expressed by Magel2−/+ maternal allele mutants (hetmat) compared to paternal allele mutants (Magel2+/−, hetpat) and controls allele (Magel2+/+’, wtpat; Magel2+’/+, wtmat).

References

    1. Anderson DJ, and Perona P (2014). Toward a science of computational ethology. Neuron 84, 18–31. - PubMed
    1. Bakken TE, Miller JA, Ding S-L, Sunkin SM, Smith KA, Ng L, Szafer A, Dalley RA, Royall JJ, Lemon T, et al. (2016). A comprehensive transcriptional map of primate brain development. Nature 535, 367–375. - PMC - PubMed
    1. Barton RA (2012). Embodied cognitive evolution and the cerebellum. Philos. Trans. R. Soc. Lond. B Biol. Sci 367, 2097–2107. - PMC - PubMed
    1. Bervini S, and Herzog H (2013). Mouse models of Prader-Willi syndrome: a systematic review. Front. Neuroendocrinol 34, 107–119. - PubMed
    1. Bonthuis PJ, Huang W-C, Stacher Hörndli CN, Ferris E, Cheng T, and Gregg C (2015). Noncanonical Genomic Imprinting Effects in Offspring. Cell Rep. 12, 979–991. - PubMed

Publication types

LinkOut - more resources