Review
. 2020 Jan:74:100773.
doi: 10.1016/j.preteyeres.2019.100773. Epub 2019 Aug 11.

Scleral structure and biomechanics

Affiliations
Review

Scleral structure and biomechanics

Craig Boote et al. Prog Retin Eye Res. 2020 Jan.

Abstract

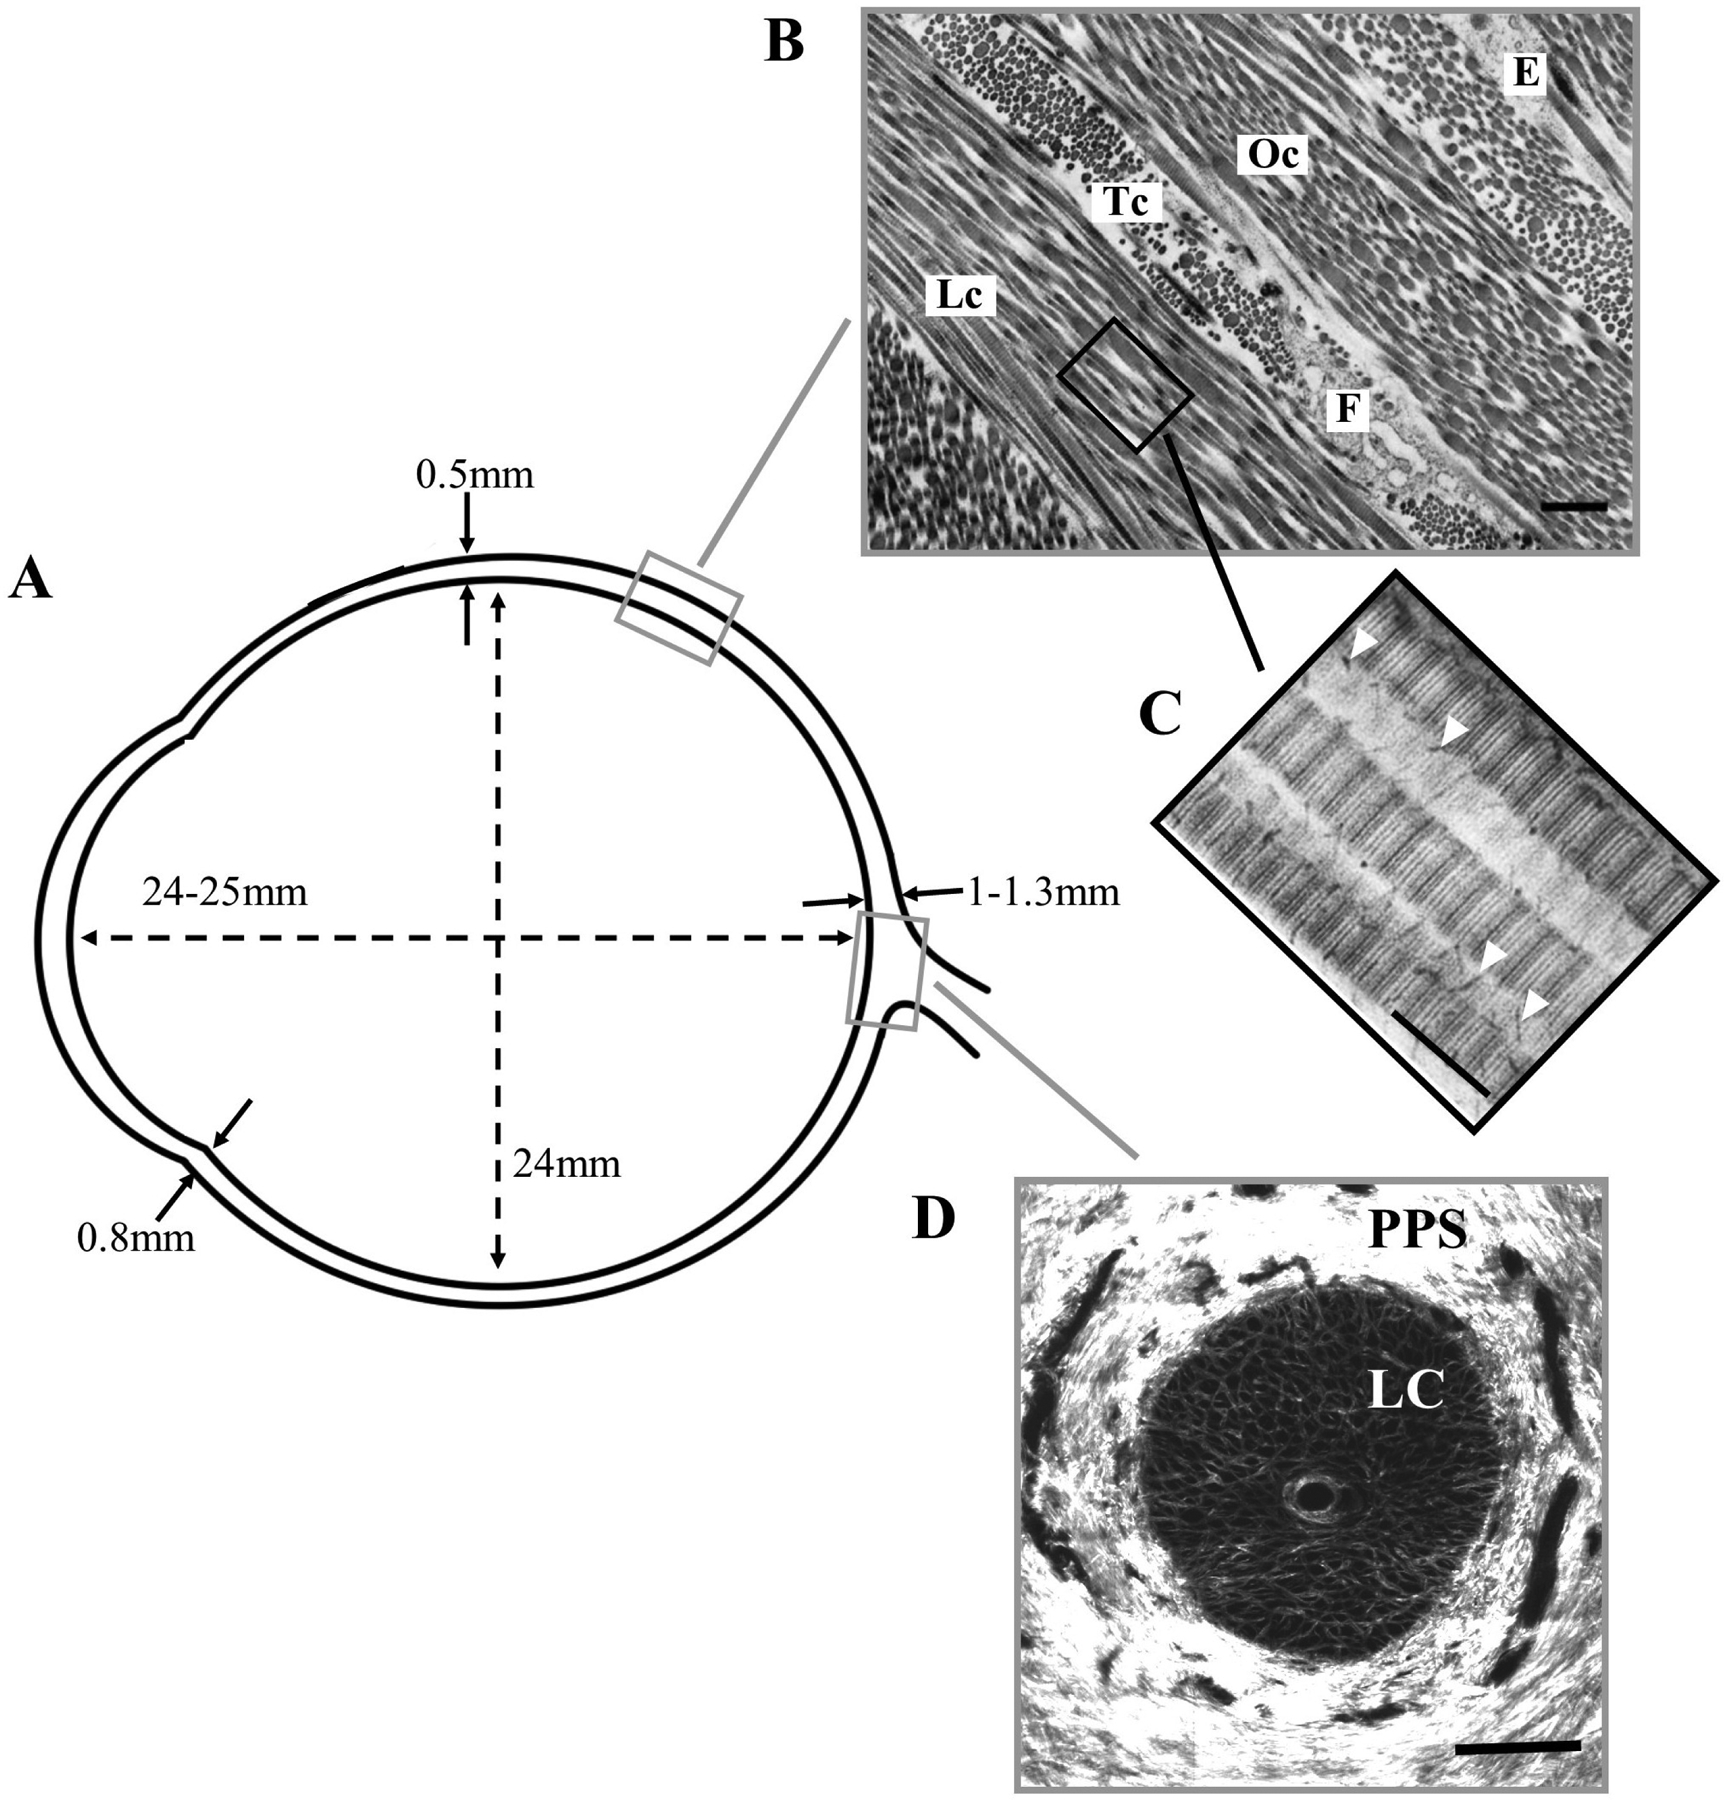
As the eye's main load-bearing connective tissue, the sclera is centrally important to vision. In addition to cooperatively maintaining refractive status with the cornea, the sclera must also provide stable mechanical support to vulnerable internal ocular structures such as the retina and optic nerve head. Moreover, it must achieve this under complex, dynamic loading conditions imposed by eye movements and fluid pressures. Recent years have seen significant advances in our knowledge of scleral biomechanics, its modulation with ageing and disease, and their relationship to the hierarchical structure of the collagen-rich scleral extracellular matrix (ECM) and its resident cells. This review focuses on notable recent structural and biomechanical studies, setting their findings in the context of the wider scleral literature. It reviews recent progress in the development of scattering and bioimaging methods to resolve scleral ECM structure at multiple scales. In vivo and ex vivo experimental methods to characterise scleral biomechanics are explored, along with computational techniques that combine structural and biomechanical data to simulate ocular behaviour and extract tissue material properties. Studies into alterations of scleral structure and biomechanics in myopia and glaucoma are presented, and their results reconciled with associated findings on changes in the ageing eye. Finally, new developments in scleral surgery and emerging minimally invasive therapies are highlighted that could offer new hope in the fight against escalating scleral-related vision disorder worldwide.

Keywords: Ageing; Biomechanics; Connective tissue structure; Glaucoma; Myopia; Sclera.


Figures

Figure 1:
Figure 1:
Overview of scleral morphometry and connective tissue structure. A) Approximate wall thickness and dimensions of the normal, adult human sclera. B) Transmission electron microscopy (TEM) image of the outer scleral stroma, showing lamellar structure formed by collagen fibril bundles in longitudinal (Lc), transverse (Tc) and oblique (Oc) section. A fibrocyte (F) and elastin fibre (E) can also be seen. Bar: 1.5μm. C) TEM image of stroma from a different specimen at higher magnification, showing D-periodic banding of individual fibrils in longitudinal section. Proteoglycans are present as fine filaments (arrowheads) associated with the collagen fibrils. Bar: 250nm. D) Second harmonic generation (SHG) image of en-face section through the optic nerve head at mid-stromal depth, showing the fenestrated lamina cribrosa (LC) that supports the exiting retinal nerve axons. The collagen fibril bundles of the neighbouring peripapillary sclera (PPS) adopt a predominantly circumferential orientation in this region. Panel B taken from (Bron et al., 1997) and reproduced with permission of Hodder Arnold. Panel C adapted from (Watson and Young, 2004) with permission of Elsevier Ltd.
Figure 2:
Figure 2:
Anatomy of the anterior segment of the eye, showing the various scleral tissue layers. Adapted with permission from https://eyeanatomyblog.wordpress.com/2012/10/15/the-limbus.
Figure 3:
Figure 3:
The hierarchical structure of scleral collagen (not to scale). Five triple alpha-chain tropocollagen molecules assemble into microfibrils, in which the axial stagger of individual molecules leads to gap/overlap regions that define the 67nm axial D-period. Varying numbers of near-parallel microfibrils form collagen fibrils of diameters ranging from 25 to 230nm.The microfibrils are actually inclined by ~5° to the fibril axis, but this is not shown in this simplified diagram.
Figure 4:
Figure 4:
Gross orientations of collagen lamellae in the posterior human sclera, as interpreted from histological examinations by Kokott (1934). Right eye shown with superior (S) and nasal (N) aspects marked. Notable features are circular orientation around the optic nerve (on) and associations with the superior oblique (so) and inferior oblique (io) muscle insertions. Figure adapted from (Watson, 2012) with permission of JP Medical Ltd.
Figure 5:
Figure 5:
Quantifying scleral collagen orientation using wide-angle X-ray scattering (WAXS). A) The constructive interference of forward-scattered X-rays from the regular lateral packing of constituent tropocollagen molecules aligned near-axially within the fibrils produces a Fourier transform (WAXS pattern) that is collected on a detector behind the specimen. B) The collagen fibril orientation distribution function is extracted from the WAXS pattern by analysing the angular spread of (radially integrated) X-ray intensity. The scatter from preferentially aligned collagen (clear region of graph above the dotted line) is displayed as a polar vector plot in which the plot shape indicates the preferential fibril orientations (in this case uniaxial), while the plot size is indicative of the degree of anisotropy.
Figure 6:
Figure 6:
Collagen microstructure of the posterior sclera across species. Polar vector plots of collagen fibril orientation in various mammal species (A–E) and humans (F), determined using WAXS. The shape of the individual plots indicates the preferred direction of collagen fibrils at that point in the tissue, while the plot colour scaling is indicative of the degree of anisotropy. Note that the circumferential collagen structure of the peripapillary sclera bordering the optic nerve (ON) is poorly defined in smaller mammals, but becomes gradually clearer with increasing eye size. The area covered by the WAXS maps is shown in yellow on the accompanying eye shadow diagrams.
Figure 7:
Figure 7:
SALS mapping of fibre microstructure in the peripapillary sclera (PPS) and lamina cribrosa. Left: Fibre maps for en-face sections from 6 human donors (3 healthy: N1–3; and 3 glaucoma: G1–3). A highly aligned (red colour) fibre ring (black vector) can be observed in the PPS (the LC boundary is shown in black). Contour colour represents the fibre concentration factor. Right: Simulated IOP-induced deformations (effective strain). Low deformations (blue colour) can be observed near the scleral canal boundary (a region prone to mechanical defects). Such deformations would be much higher if one were to remove the heterogenous PPS fibre ring. OPS: outer peripapillary sclera, IPS: inner peripapillary sclera. Contour colour represents the strain magnitude. Figure modified from (Zhang et al., 2015) with permission of the Association for Research in Vision and Ophthalmology.
Figure 8:
Figure 8:
Two-channel multiphoton microscopy image recorded from human episclera. The elastin fibre network (red) is revealed by TPF autofluorescence, and is shown alongside collagen fibril bundles (green) visualized concurrently with SHG imaging. Figure adapted from (Park et al., 2016) with permission of the Association for Research in Vision and Ophthalmology.
Figure 9:
Figure 9:
A) The posterior sclera of the sheep eye visualised using PLM. Three major organizational patterns were identified and marked by an asterisk, an ampersand, and a hashtag: i) interweaving fibres that formed a basket-weave pattern (B) asterisk), ii) fibres oriented radially from the canal (C) ampersand), and iii) fibres wrapped circumferentially around the canal (D) hashtag). White lines representing orientation averaged over 20 × 20 μm2 were overlaid to aid discerning the fibre organization. Figure adapted from (Jan et al., 2017b) with permission of the Association for Research in Vision and Ophthalmology.
Figure 10:
Figure 10:
Collagen crimp period visualised using PLM. A) An LC beam appears banded when imaged with PLM. B) Adding the lengths of one bright band and one dark band makes one collagen crimp period. C) Processing several “raw” PLM images with various filter orientations, it is possible to pseudocolour half periods as alternating yellow and purple bands that help visualize the crimp. Note that the crimp bands are fairly uniform and perpendicular to the longitudinal axis of the LC beam. This crimp pattern helps reduce shearing and torsion within the LC beam when loaded longitudinally. Note that crimp period is only one aspect of fibre crimp. Figure adapted from (Jan et al., 2017a) with permission of the Association for Research in Vision and Ophthalmology.
Figure 11:
Figure 11:
Wide views spanning the LC and sclera under PLM (top) and visualised using the yellow and purple bands as described in Fig 10 to simplify discerning crimp period independent of the orientation (middle). The bottom shows pairs of raw PLM images and corresponding crimp period visualization images of close-ups of the LC (bottom left), proximal PPS (bottom center), and distal PPS (bottom right). An example line illustrating three periods is overlaid on each. It is easy to distinguish that the crimp period in the LC was small. In the proximal PPS the period was similar to that of the LC. The period increased with distance from the canal. Figure adapted from (Jan et al., 2017a) with permission of the Association for Research in Vision and Ophthalmology.
Figure 12:
Figure 12:
Schematic of how fibre uncrimping contributes to tissue mechanical properties. (Top) As a single fibre stretches, it uncrimps, requiring relatively little force until it loses all crimp. The straightened fibre can only be stretched further by making the fibre longer, which requires an increasing force, and so the fibre appears stiffer. A fibre that has uncrimped and is bearing load is called “recruited”. The macroscopic force or stiffness of multiple fibres depends on the distribution of baseline crimp in the fibres. (Bottom row) In a region with fibres of uniform crimp, stretch leads to a macroscopic step increase in stiffness due to the simultaneous straightening of all fibres. In a region with variable crimp, stretch leads to a gradual increase in stiffness due to the progressive straightening of fibres. Fibres with less crimp are straightened and loaded (recruited) before fibres with more crimp. Figure adapted from (Jan et al., 2017a) with permission of the Association for Research in Vision and Ophthalmology.
Figure 13:
Figure 13:
Crimp characteristics vary around the globe, in consistent ways between individuals. The figure is to compare crimp period and amplitude across regions of the globe. The 25th percentile, 50th percentile (median), and 75th percentile period and amplitude values were used to generate representative fibres for each region as sinusoidals. These visualizations are not intended to represent any specific fibril, fibril bundle or lamellae, but are, instead, intended to visualise how the crimp differs between regions. In regions with more uniform crimp, all three lines would be relatively similar, whereas in regions with highly variable crimp they would vary. Figure adapted from (Jan et al., 2018) with permission of the Experimental Eye Research.
Figure 14:
Figure 14:
Application of 3DPLM to the posterior pole of a sheep eye. The 3D orientation of the fibres can be separated into in-plane and out-of-plane orientations, where the plane is that of the section. (a) Bright field image of a cryosection with red and green arrowheads pointing to long in-plane fibre bundles and out-of-plane fibre bundles, respectively; (b) In-plane fibre orientation map showing both in-plane fibre morphology and orientation. Colours indicate the in-plane fibre orientation; (c) Out-of-plane fibre orientation map highlighting fibre bundles. Colours indicate the out-of-plane fibre orientation, from fully in-plane (blue) to perpendicular to the plane (maroon); (d) Out-of-plane fibre orientation of small region of interest shown in (c); (e) 3D visualization of collagen fibres. Figure adapted from (Yang et al., 2018b) with permission of the Journal of Biophotonics.
Figure 15:
Figure 15:
Collagen fibre orientation maps in the PPS and LC region of a pig eye. The images were acquired using either PLM (a, c) or SPLM (b, d) of an uncut thick sample. (a) The PLM images appear green, without much detail of the known architecture of the region. (b) In contrast, SPLM images show a much more heterogeneous arrangement. Both circumferential and radial fibres can be identified, based on color-coded orientations; (c) and (d) show close-ups of the region marked by the dashed rectangle. Overlaid on the images are locally averaged orientation lines. Figure adapted from (Yang et al., 2018a) with permission of the SPIE.
Figure 16:
Figure 16:
Porcine PPS imaged by snapshot polarized light microscopy (Yang et al., 2019). The colors indicate the local orientation of the collagen fibres and the brightness is roughly proportional to the local collagen density. Note that the colors are obtained through optical means, and the image is not coloured digitally. The scleral canal is slightly out of frame on the bottom right corner. Clearly discernible in the image are collagen fibre bundles circumferential to the canal. The width of the region of circumferential fibres is between 20% and 40% of the canal diameter in both porcine and human eyes (Gogola et al., 2018b). It is also possible to distinguish the collagen fibres that form the bundles. The bands of color indicate collagen fibre crimp (Jan et al., 2017b). The collagen fibre bundles and the crimp of the fibres increase in size with distance from the canal (Jan et al., 2017a).
Figure 17:
Figure 17:
High-resolution T2*-weighted MR images of the unloaded ovine sclera near the optic nerve head. The left panels show the cross-section of the sclera, optic nerve head, and lamina cribrosa in sagittal view. The right panel shows the coronal T2*-weighted image oriented as the blue box in the left panel at 16 × 16 μm2 in-plane resolution and repetition time/echo time = 3000/9.5 ms. Details of the lamina cribrosa (yellow arrow) within the optic nerve head and the distributions of crimps (red arrows) in the scleral fibres surrounding the optic nerve head were revealed especially at orientations near the magic angle at approximately 55° to the main magnetic field (B0). Figure adapted from (Ho et al., 2014) with permission of the Association for Research in Vision and Ophthalmology.
Figure 18:
Figure 18:
Quick-freeze deep-etch (QFDE) electron microscopy image of mouse posterior sclera, revealing layers of differentially oriented collagen lamellae in 3D. On the right side of the image (*) can be seen an area of partially etched, vitrified ice - a product of the “freeze-fracture” processing that can preserve native hydrated structure more closely than is possible with conventional electron microscopy sample preparation. Scale bar: 2 μm. Figure reproduced from (Ismail et al., 2017) with permission of Elsevier Ltd.
Figure 19:
Figure 19:
Ultrasound (US) speckle tracking of scleral and ONH deformation under inflation testing. US image A) and colour maps of vertical displacement B), horizontal displacement C), and strains (D–F) for a representative human donor eye at 30 mm Hg. The yellow dotted lines in A) indicate the boundaries between ONH and peripapillary tissue (PPT), the inner and outer blue lines are fitted curves for demarcation of region of interest (ROI) for strain analysis, and the middle blue line is used to divide the anterior and posterior halves. Note that the retina is largely excluded from the ROI. Positive displacements = upward vertical movement or rightward horizontal movement. Vertical displacements were larger within the ONH. The horizontal displacement of PPT was negative on average on the left side of ONH and positive on the right side of ONH, indicating a small scleral canal expansion. Through-thickness compression was largest in magnitude and concentrated in the anterior half of the ONH and PPT. Reproduced from (Ma et al., 2019) with permission of the Association for Research in Vision and Ophthalmology.
Figure 20:
Figure 20:
Inflation testing of intact eye globe. A) Elevation view diagram of the whole eye globe inflation testing rig set-up. B) Side view of the rig set-up. C) Match between modelled and imaged topography of the eye globe. The FE nodes representing the corneal apex, posterior pole and limbal ring are highlighted in red. Adapted from (Whitford et al., 2016) under Creative Commons License 4.0.
Figure 21:
Figure 21:
Steps to track IOP-induced displacement of a single scleral point in vivo. 1) an ROI is created in the undeformed OCT volume; 2) The ROI undergoes a combination of affine transformations (translation, rotation, shear and stretch); 3) a displacement vector can be extracted when the deformed ROI best matches a co-localised ROI in the deformed volume. Adapted from (Girard et al., 2013) with permission of the authors.
Figure 22:
Figure 22:
Simulated IOP promotes contractility in cultured human scleral fibroblasts. A) Fibroblast contractility in response to 1% or 4% cyclic strain at 5 Hz for 24 hours, assessed by a 3D collagen gel–based assay. The numbers refer to cell quantities, while the vertical graph axis denotes relative gel area (a.u.) as measured in ImageJ. B) Phase-contrast and confocal immunofluorescent images overlaid to show the correlation between expression of intracellular contractile apparatus (αSMA and F-actin) and wrinkle formation. Arrow indicates a wrinkle-forming myofibroblast. Arrowhead indicates a non–wrinkle-forming fibroblast. Red: F-actin, Green: αSMA, Blue: DAPI. Scale bar: 50 μm. Reproduced from (Qu et al., 2015) with permission of the Association for Research in Vision and Ophthalmology.
Figure 23:
Figure 23:
Experimental glaucoma increases cell proliferation and myofibroblast differentiation in mouse sclera. Top row: Immunohistochemical labelling of vimentin (red) in A) control and B) 3-day glaucoma scleral wholemounts. Middle row:→SMA labelling (green) in C) control and D) 3-day glaucoma. Bottom row: cell adhesion molecule →actinin labelling (red) in E) control and F) 3-day glaucoma. DAPI nuclear counterstain is shown in blue in all panels. Scale bars = 20um. Reproduced from (Oglesby et al., 2016) with permission of Molecular Vision.
Figure 24:
Figure 24:
A schematic illustration of how the stiffness of the sclera affects the IOP-induced ONH deformations. In the case of a compliant sclera (left), an increase in IOP induces large scleral deformations, which are transmitted to the scleral canal, resulting in a large scleral canal expansion that pulls the lamina taut. Conversely, a stiff sclera deforms little under IOP (right), with a small scleral canal expansion, allowing the lamina to be displaced posteriorly by the action of IOP on its anterior surface. Figure adapted from (Sigal et al., 2011b) with permission of the Association for Research in Vision and Ophthalmology.
Figure 25:
Figure 25:
A) Computational models used to simulate the biomechanical behavior of four theoretical collagen fibre arrangements (top row). Shown in light blue is the posterior sclera, with the scleral canal as a red disc. The black lines represent the collagen fibres. On the middle and bottom row are shown contour levels of the magnitude of the deformations (strain) due to an IOP elevation of 50 mmHg. A simple reinforcement of the canal with circumferential fibres limited the strain in the lamina due to IOP but did provide support to the sclera. Conversely, a radial arrangement of fibres reduced the strain in the sclera, but lead to high strains within the lamina. The combination of radial and circumferential fibres still caused high strains in the lamina. A tangential arrangement of fibres provided the best reinforcement for both the sclera and the lamina, reducing the strains to near zero-levels. Depending on the fibre curvature, long fibres tangential to the canal can have substantially different responses to IOP increases. B) Maps of IOP-induced strain for three different fibre curvatures. When the fibres were concave to the canal (Canal Closing Fibers), increased IOP caused the canal to close, and lamina compression. When the fibres were convex (Canal Opening Fibers), increased IOP caused the canal to open and the lamina to stretch. Note that the models incorporated many fibres. For simplicity, only a few are shown. C) Diagram of the mechanism of action of long tangential fibres. For concave fibres, the load from IOP results in an outward tensile force at the canal boundary as the fibres straighten. For convex fibres, the load from IOP results in an inward compressive force at the canal boundary as the fibres straighten. Figure adapted from (Voorhees et al., 2018) with permission of Acta Biomaterialia.
Figure 26:
Figure 26:
Magnetic resonance imaging (left), optical coherence tomography imaging (centre), and finite element modelling (right) all strongly suggest that the optic nerve applies a traction force onto the back of the eye during eye movements. The net result is shearing of the optic nerve head tissues (red arrows). Note that deformations were magnified 5 times in the finite element models to aid visual interpretation. Adapted from Wang et al., 2016a and Wang et al., 2017 with permission of the Association for Research in Vision and Ophthalmology.
Figure 27:
Figure 27:
A schematic description of three mechanisms by which increases in CSFP cause ONH deformations. Undeformed ONH is shown with continuous lines, and deformed ONH with dashed lines. (a) CSFP acts inwardly compressing the pia mater and the retrolaminar neural tissue within. Due to the Poisson effect, lateral compression may cause expansion in the axial direction, increasing retrolaminar pressure (Morgan et al., 1995) “pushing” anteriorly on the lamina and causing clockwise rotation of the PPS. (b) CSFP acts outwardly on the dura mater away from the pia mater, causing the known distension of the dural sheath, (Killer et al., 2003) rotating the PPS counterclockwise, and displacing the periphery of the lamina posteriorly. (c) CSFP “pushes” the PPS anteriorly, causing flattening of the globe and clockwise rotation of the PPS, and displacing the periphery of the lamina anteriorly. Figure adapted from (Hua et al., 2018) with permission of the Association for Research in Vision and Ophthalmology.
Figure 28:
Figure 28:
Determinants of the peripapillary sclera (PPS) angle in healthy eyes. An increase in the v-shaped configuration of the peripapillary sclera (PPS) is associated with increasing age, longer axial length, thinner central corneal thickness (CCT), thinner choroidal thickness, worse vision and an increase in lamina cribrosa (LC) depth. Adapted from (Tun et al., 2019) with permission of the Association for Research in Vision and Ophthalmology.
Figure 29:
Figure 29:
Effect of myopia on eye shape. A) Emmetropia is the visual condition of the normal eye with clear vision. This condition is achieved when the axial length of the eye matches the refractive power of the cornea and lens, such that light rays are focused exactly on the retina. B) A myopic eye is too long for its optical components and light focuses in front of the retina causing faraway objects to appear blurry. C) Overlaid histologic sections of the emmetropic eye and the contralateral, highly myopic eye of the same donor showing the extended posterior segment of the myopic eye. The anatomy of the anterior segment is nearly identical in both eyes. In contrast, the posterior segment of the myopic eye is elongated compared to the emmetropic eye, causing the typical increase in axial length seen in myopia. Reproduced from (Grytz, 2018) with permission of Kugler Publications.
Figure 30:
Figure 30:
The emmetropization process and factors that impact the refractive development of the eye. Mechanisms highlighted in yellow represent visual stimuli and environmental factors that impact the refractive development of the eye. Mechanisms highlighted in blue are thought to be involved in the feedback mechanism. Mechanisms highlighted in green are believed to impact the refractive development of the eye without modulation by the feedback mechanism. Reproduced from (Grytz, 2018) with permission of Kugler Publications.
Figure 31:
Figure 31:
Bulk collagen microstructural changes in human high myopia. Left panel: WAXS polar vector maps of collagen orientation in (top) a normal and (bottom) a high myopia flat-mount human posterior sclera. The peripapillary sclera, bordering the optic nerve, is shown bounded in black. Note myopic alteration to collagen directions in this region. The normal sclera features a predominantly circumferential pattern, with only a slight interruption in the superior (S)-nasal (N) aspect. However the S-N interruption is far more widespread in the highly myopic eye (arrows), suggesting an unravelling of the normal structure in high myopia. Right panel: fibre displacement angle from perfect circumferential alignment in (top) average of 7 normal specimens and (bottom) the high myopia specimen. ON: optic nerve. Figure adapted from (Markov et al., 2018) with permission of Molecular Vision.
Figure 32:
Figure 32:
Regulation of scleral creep rate in tree shrews during experimentally induced myopia (−5D lens treatment) and recovery. Axial elongation was accelerated in the treated eye during monocular - 5D lens treatment and slowed during recovery from −5D lens wear (lens removal). Creep rate increased/decreased in the treated eye during lens treatment/recovery. The creep rate of the control eye and normal animals without lens treatment are shown for comparison. Reproduced from (Grytz, 2018) with permission of Kugler Publications.
Figure 33:
Figure 33:
Computational modelling of theoretical posterior segment ring implants as a potential glaucoma therapy. A) Generic human eye model geometry and FE mesh. B) Proposed intrascleral (IS) ring implant (implant material stiffness = 200GPa). C) Alternative ring implant (200GPa stiffness) located in the subarachnoid space (SAS). D) Effect of SAS and IS+SAS combination implants on calculated ONH deformation behaviour, under a simulated IOP of 50mmHg. A maximum 66% reduction in scleral canal expansion and a 28% reduction in LC strain are predicted by the model under the double ring combination implant strategy. Adapted from (Soh, 2016) under Creative Commons License 4.0.
Figure 34:
Figure 34:
Fourier analysis of mechanical load-induced F-actin stress fibre networks in cultured bovine scleral fibroblasts. A) Confocal image showing green cytoskeletal stress fibres of F-actin, stained with Alexa-488® phalloidin (bar = 25um). B) Map of integrated actin signal, sampled every 5um. C) Polar vector map of actin fibre orientation from analysis of Fourier power spectrum. D) Map of degree of fibre recruitment (DFR) around the principal fibre direction. Reproduced from (Pijanka et al., 2019) with permission of the Journal of Biophotonics.
Figure 35:
Figure 35:
A) Fundus image of the rat ONH. B) Collagen fibre orientations (colour map) in the peripapillary sclera about 160 um posterior to the retinal pigment epithelium. Colour scale: −90 to 90 degrees. S, T, I, N: superior, temporal, inferior, nasal. C) Preferred collagen fibre orientations in the peripapillary sclera showing a ring pattern. Adapted from (Baumann et al., 2014) with permission of the Association for Research in Vision and Ophthalmology.
Figure 36:
Figure 36:
Automated segmentation of ONH connective and neural tissues using artificial intelligence (AI) computing. The peripapillary sclera is shown in yellow. The performance of AI is now similar to that of a human expert.
Figure 37:
Figure 37:
Potential stem cell treatment for progressive myopia. A) Injection of a mesenchymal stem cell suspension into the subscleral space. B) Dual mechanisms for the possible prevention of myopic eye elongation. Left: Integration of stem cells into the scleral stroma for direct mechanical support. Right: Indirect stimulation of the scleral tissue via dopamine production. Adapted from (Janowski et al., 2015) with permission of AlphaMed Press.

References

    1. Albon J, Farrant S, Akhtar S, Young R, Boulton ME, Smith G, Taylor M, Guggenheim J, Morgan JE, 2007. Connective tissue structure of the tree shrew optic nerve and associated ageing changes. Invest Ophthalmol Vis Sci. 48, 2134–2144. - PubMed
    1. Anderson DR, 1969. Ultrastructure of human and monkey lamina cribrosa and optic nerve head. Arch Ophthalmol 82, 800–814. - PubMed
    1. Ashby R, Ohlendorf A, Schaeffel F, 2009. The effect of ambient illuminance on the development of deprivation myopia in chicks. Invest Ophthalmol Vis Sci 50, 5348–5354. - PubMed
    1. Austin BA, Coulon C, Liu CY, Kao WW, Rada JA, 2002. Altered collagen fibril formation in the sclera of lumican-deficient mice. Invest Ophthalmol Vis Sci 43, 1695–1701. - PubMed
    1. Ayyalasomayajula A, Park RI, Simon BR, Vande Geest JP, 2016. A porohyperelastic finite element model of the eye: the influence of stiffness and permeability on intraocular pressure and optic nerve head biomechanics. Computer methods in biomechanics and biomedical engineering 19, 591–602. - PMC - PubMed

Publication types