. 2019 Aug 14;7(1):114.
doi: 10.1186/s40168-019-0727-1.

Deciphering rhizosphere microbiome assembly of wild and modern common bean (Phaseolus vulgaris) in native and agricultural soils from Colombia

Affiliations

Deciphering rhizosphere microbiome assembly of wild and modern common bean (Phaseolus vulgaris) in native and agricultural soils from Colombia

Juan E Pérez-Jaramillo et al. Microbiome. .

Abstract

Background: Modern crop varieties are typically cultivated in agriculturally well-managed soils far from the centers of origin of their wild relatives. How this habitat expansion impacted plant microbiome assembly is not well understood.

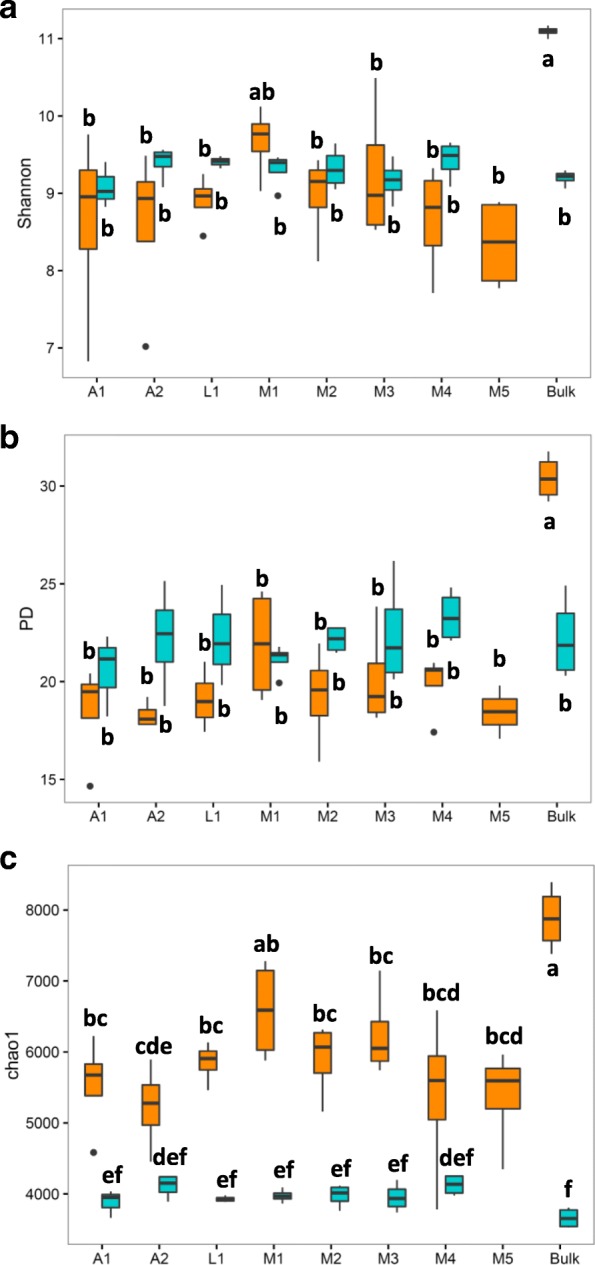
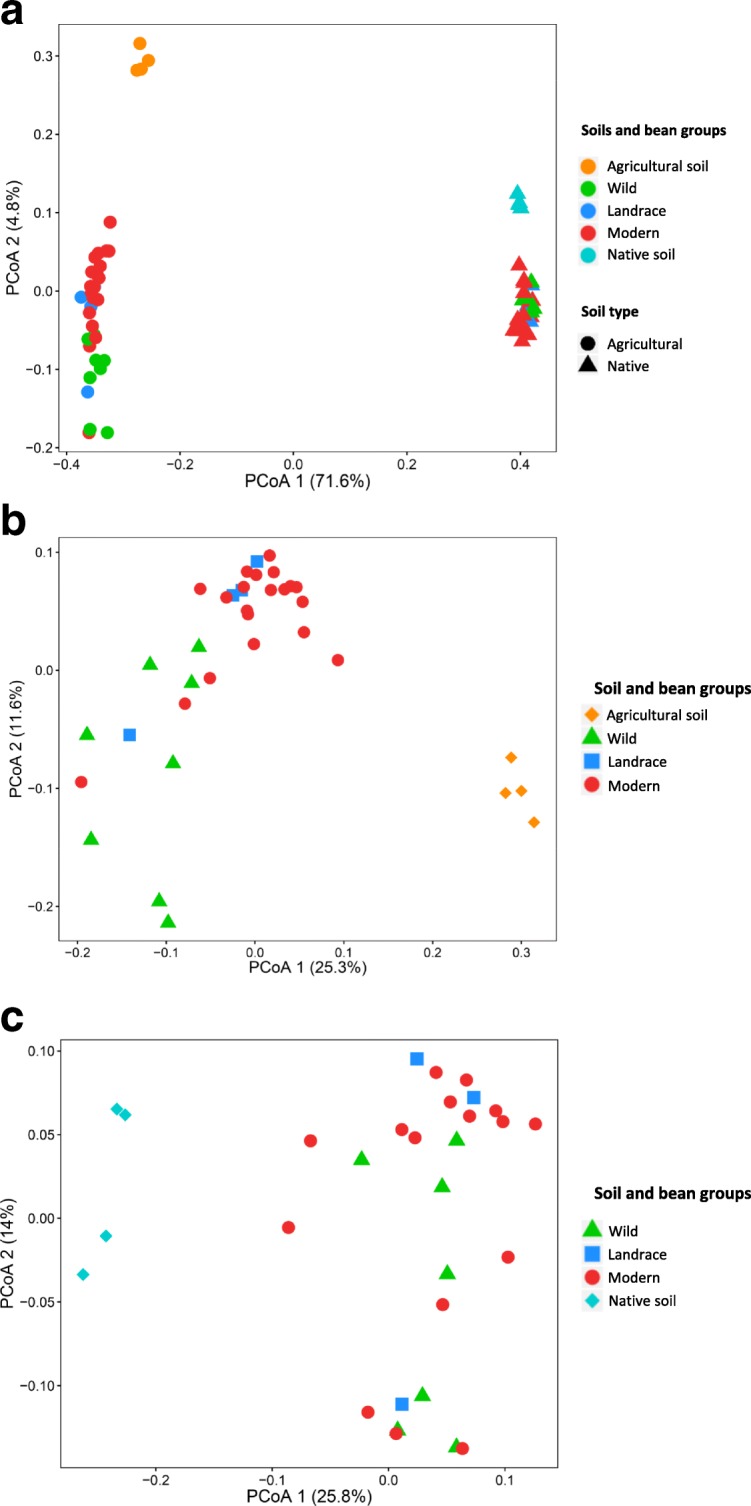
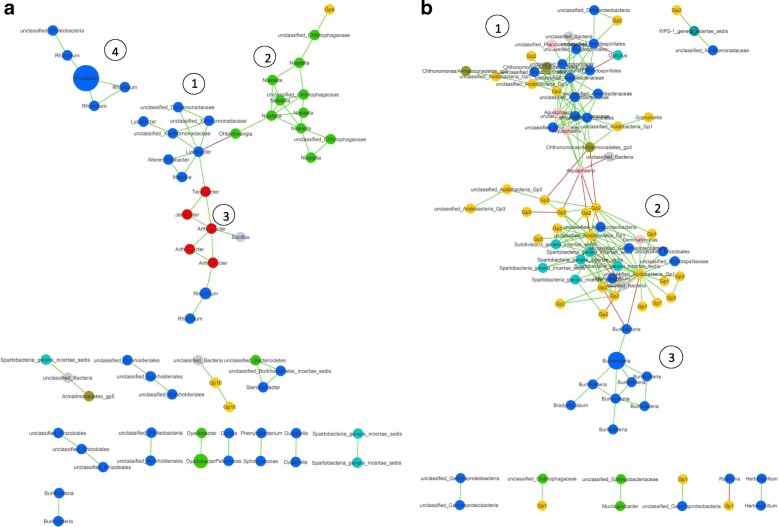
Results: Here, we investigated if the transition from a native to an agricultural soil affected rhizobacterial community assembly of wild and modern common bean (Phaseolus vulgaris) and if this led to a depletion of rhizobacterial diversity. The impact of the bean genotype on rhizobacterial assembly was more prominent in the agricultural soil than in the native soil. Although only 113 operational taxonomic units (OTUs) out of a total of 15,925 were shared by all eight bean accessions grown in native and agricultural soils, this core microbiome represented a large fraction (25.9%) of all sequence reads. More OTUs were exclusively found in the rhizosphere of common bean in the agricultural soil as compared to the native soil and in the rhizosphere of modern bean accessions as compared to wild accessions. Co-occurrence analyses further showed a reduction in complexity of the interactions in the bean rhizosphere microbiome in the agricultural soil as compared to the native soil.

Conclusions: Collectively, these results suggest that habitat expansion of common bean from its native soil environment to an agricultural context had an unexpected overall positive effect on rhizobacterial diversity and led to a stronger bean genotype-dependent effect on rhizosphere microbiome assembly.

Keywords: Common bean; Core microbiome; Domestication; Networks; Rhizosphere; Wild and modern accessions.


Conflict of interest statement

The authors declare that they have no competing interests.

Figures

Fig. 1
Fig. 1
Comparative analysis of the alpha diversity of 16S rRNA rhizobacterial sequences from common bean accessions in agricultural and native soils. a Shannon, b phylogenetic diversity, and c Chao1 were calculated by soil type and for all bean accessions and the bulk soils. The data was rarefied up to 35,000 counts per sample. Statistically significant differences were determined by one-way ANOVA (P < 0.05) followed by post hoc Tukey test. Cyan color was assigned to native soil and dark orange to agricultural samples
Fig. 2
Fig. 2
Rhizosphere bacterial community structure in agricultural and native soils. Principal Coordinate Analysis (PCoA) of 16S rRNA diversity in the rhizosphere of the eight common bean accessions used in this study. a Rhizosphere bacterial community of common bean grown in agricultural (circles) and native (triangles) soils. Soil type explained 71.3% of the total variability in the bacterial community composition (PERMANOVA, P < 0.001). b PCoA including only rhizosphere bacterial communities of common bean plants grown in agricultural rhizosphere and bulk soil samples. Bean genotype explained 31.2% of the total variability in the agricultural soil (PERMANOVA, P < 0.05). c PCoA including only rhizosphere bacterial communities of bean plants grown in native rhizosphere and bulk soil samples. Bean genotype explained 28.3% of the total variability in the agricultural soil (PERMANOVA, P < 0.001). CSS transformed reads were used to calculate Bray-Curtis distances in a, b, and c. Colors represent the stage of domestication and bacterial communities from agricultural and native bulk soils
Fig. 3
Fig. 3
Differential abundance of bacterial OTUs in agricultural and native soils. Welch’s t tests followed by Bonferroni corrections were performed between merged rhizosphere samples and merged bulk soil samples from agricultural soil and native soil at phylum (a and c) and class (b and d) levels. Only differentially abundant phyla and classes are shown
Fig. 4
Fig. 4
Core microbiome of the rhizosphere of common bean. The different portions within the inner pie chart represent the bacterial phyla that are part of the common bean core microbiome. The outer donut plot represents the genera that are part of the core, and each genus assigned to the phylum they belong to. The size of the different pie and donut portions represents the contribution of each phylum/genus to the total relative abundance. Satellite box plots depict the relative abundance of selected genera by bean accession (A1 and A2, wild; L1, landrace; M1 to M5, modern) and by soil type. Cyan and dark orange colors were assigned to native soil and agricultural samples, respectively
Fig. 5
Fig. 5
Common bean rhizobacterial co-occurrence networks in agricultural and native soils. a Co-occurrence network of common bean rhizosphere samples in agricultural soil. Cluster 1 was composed of bacterial taxa from several classes of the Proteobacteria phylum. Cluster 2 contained exclusively bacterial taxa from the Chitinophagaceae family. Cluster 3 included actinobacterial taxa and one Bacillus, and cluster 4 was composed of the genus Rhizobium. b Co-occurrence network of common bean rhizosphere samples in native soil. From the three main clusters identified, two were highly abundant in nodes from the Proteobacteria phylum (1 and 3) which held negative connections to cluster 2, mainly composed of phyla Acidobacteria and Verrucomicrobia. Positive interactions are depicted as green edges and the negative interactions are depicted as red edges. Color code of most abundant nodes: Proteobacteria, blue; Actinobacteria, red; Bacteroidetes, green; Acidobacteria, yellow; Planctomycetes, cyan

References

    1. Purugganan MD, Fuller DQ. The nature of selection during plant domestication. Nature. 2009;457:843–848. doi: 10.1038/nature07895. - DOI - PubMed
    1. Doebley JF, Gaut BS, Smith BD. The molecular genetics of crop domestication. Cell. 2006;127:1309–1321. doi: 10.1016/j.cell.2006.12.006. - DOI - PubMed
    1. Gepts P. Crop domestication as a long-term selection experiment. Plant Breed Rev. 2004;24:1–44.
    1. Berendsen RL, Pieterse CMJ, Bakker PAHM. The rhizosphere microbiome and plant health. Trends Plant Sci. 2012;17(8):478–486. doi: 10.1016/j.tplants.2012.04.001. - DOI - PubMed
    1. Mendes R, Garbeva P, Raaijmakers JM. The rhizosphere microbiome: significance of plant beneficial, plant pathogenic and human pathogenic microorganisms. FEMS Microbiol Rev. 2013;37:634–663. doi: 10.1111/1574-6976.12028. - DOI - PubMed

Publication types

LinkOut - more resources