. 2019 Oct 2;39(40):7872-7881.
doi: 10.1523/JNEUROSCI.1106-19.2019. Epub 2019 Aug 14.

Imbalanced Corticospinal and Reticulospinal Contributions to Spasticity in Humans with Spinal Cord Injury

Affiliations

Imbalanced Corticospinal and Reticulospinal Contributions to Spasticity in Humans with Spinal Cord Injury

Sina Sangari et al. J Neurosci. .

Abstract

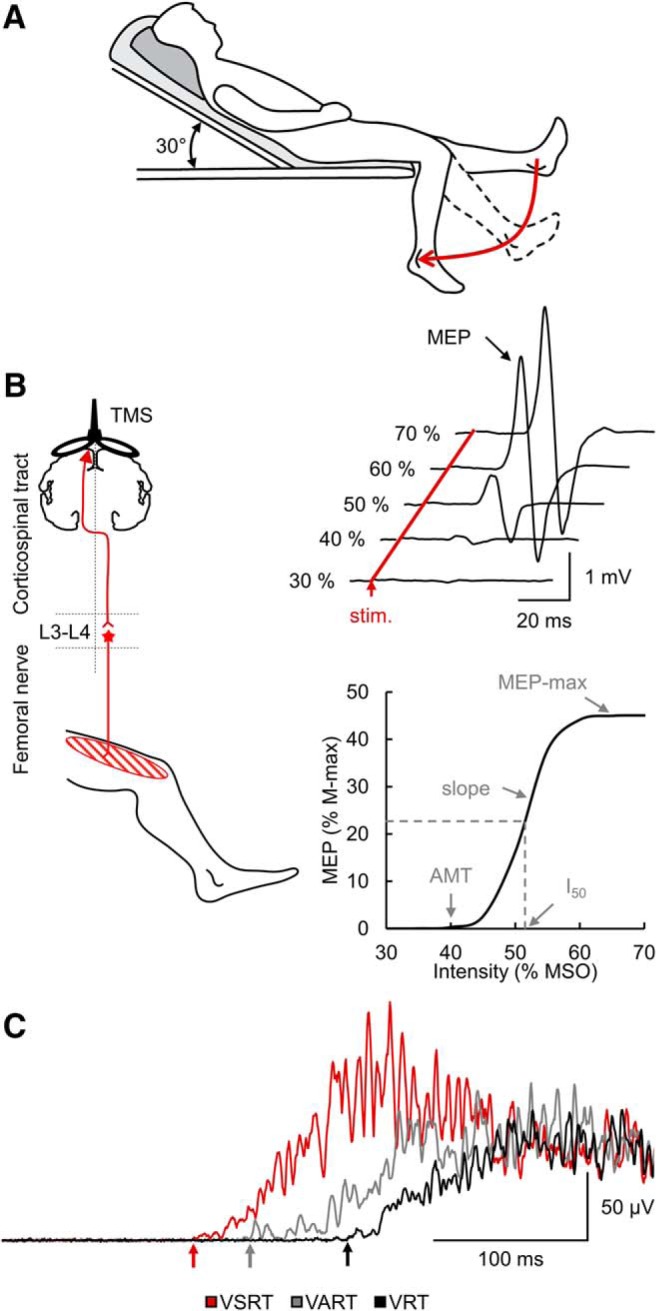
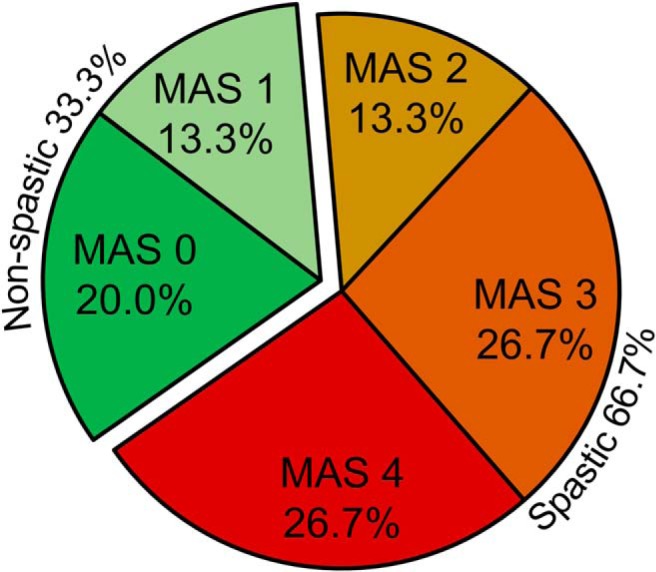
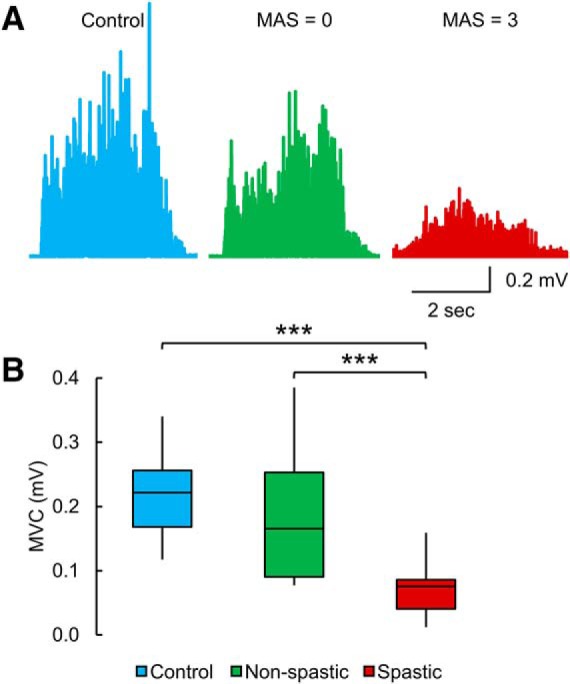
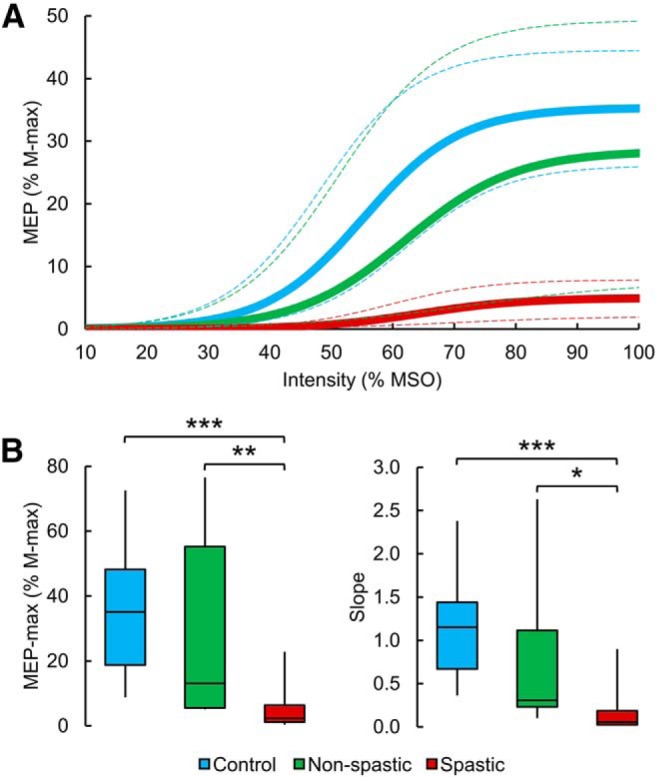
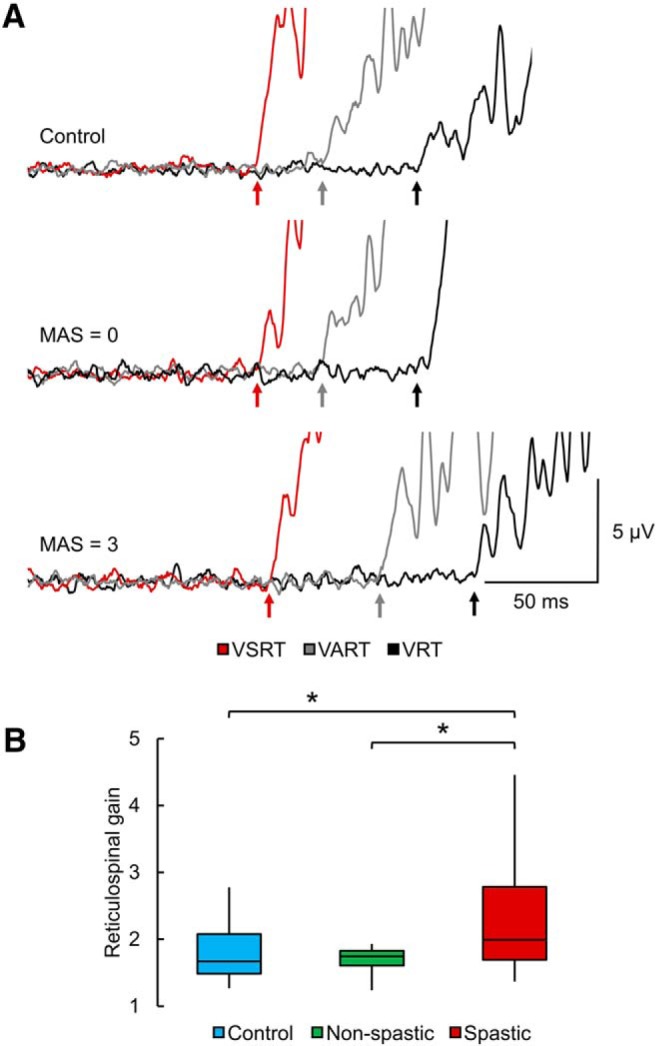
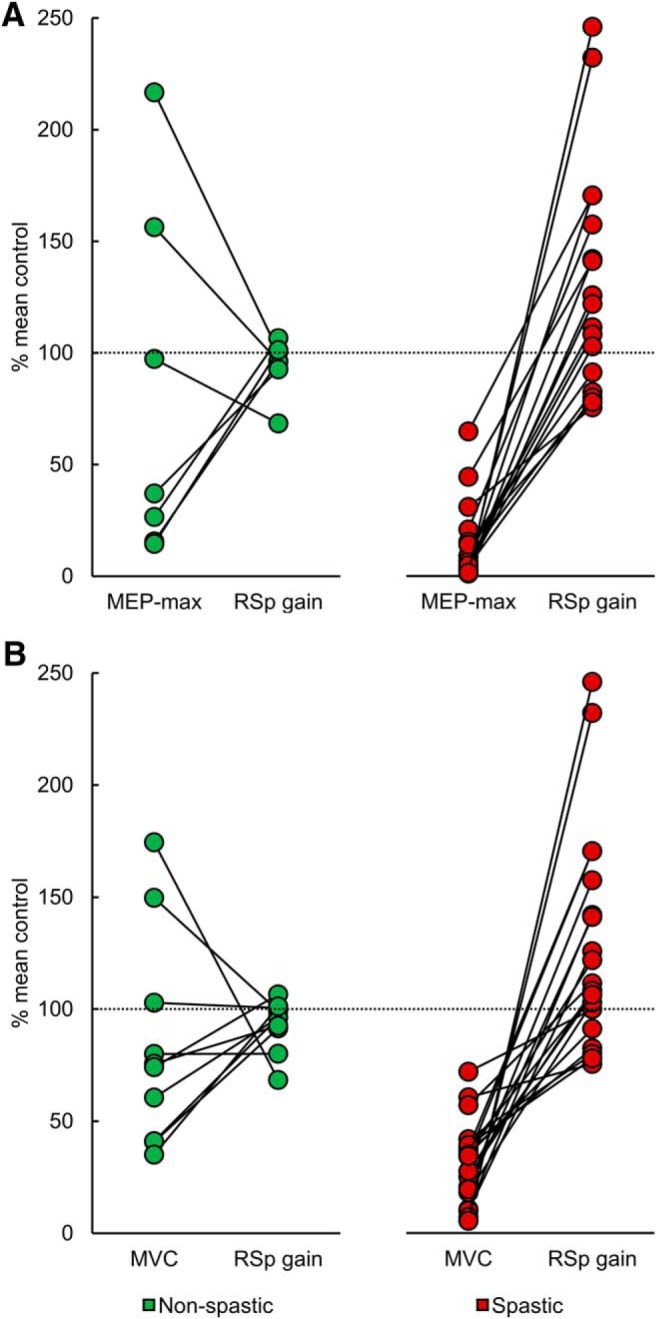
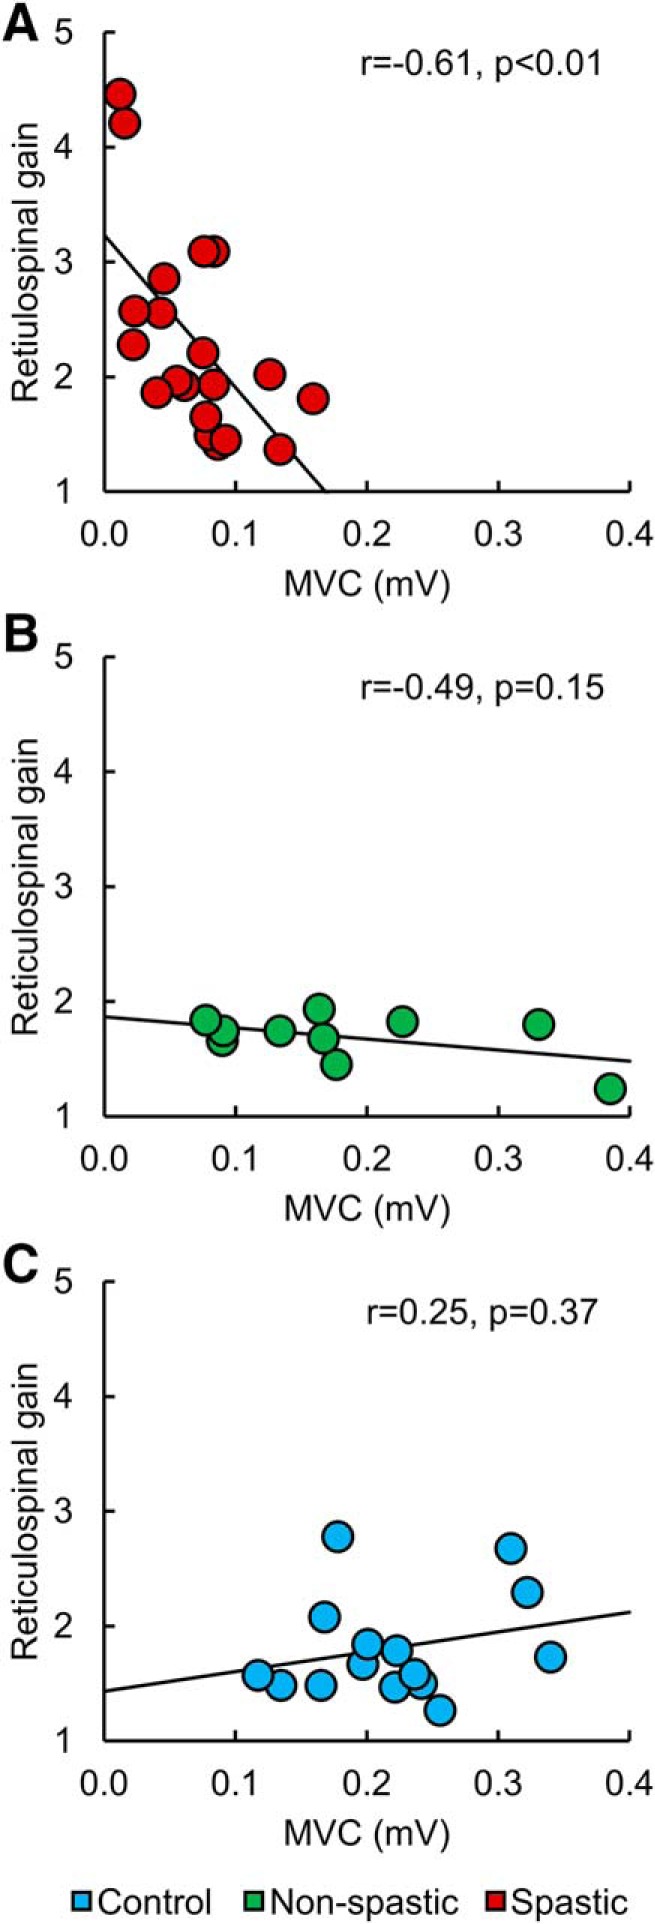
Damage to the corticospinal and reticulospinal tract has been associated with spasticity in humans with upper motor neuron lesions. We hypothesized that these descending motor pathways distinctly contribute to the control of a spastic muscle in humans with incomplete spinal cord injury (SCI). To test this hypothesis, we examined motor-evoked potentials (MEPs) elicited by transcranial magnetic stimulation over the leg representation of the primary motor cortex, maximal voluntary contractions (MVCs), and the StartReact response (shortening in reaction time evoked by a startling stimulus) in the quadriceps femoris muscle in male and females with and without incomplete SCI. A total of 66.7% of the SCI participants showed symptoms of spasticity, whereas the other 33.3% showed no or low levels of spasticity. We found that participants with spasticity had smaller MEPs and MVCs and larger StartReact compared with participants with no or low spasticity and control subjects. These results were consistently present in spastic subjects but not in the other populations. Clinical scores of spasticity were negatively correlated with MEP-max and MVC values and positively correlated with shortening in reaction time. These findings provide evidence for lesser corticospinal and larger reticulospinal influences to spastic muscles in humans with SCI and suggest that these imbalanced contributions are important for motor recovery.SIGNIFICANCE STATEMENT Although spasticity is one of the most common symptoms manifested in humans with spinal cord injury (SCI) to date, its mechanisms of action remain poorly understood. We provide evidence, for the first time, of imbalanced contributions of the corticospinal and reticulospinal tract to control a spastic muscle in humans with chronic incomplete SCI. We found that participants with SCI with spasticity showed small corticospinal responses and maximal voluntary contractions and larger reticulospinal gain compared with participants with no or low spasticity and control subjects. These results were consistently present in spastic subjects but not in the other populations. We showed that imbalanced corticospinal and reticulospinal tract contributions are more pronounced in participants with chronic incomplete SCI with lesser recovery.

Keywords: corticospinal pathway; muscle weakness; reticulospinal pathway; spasticity; voluntary drive.


Figures

Figure 1.
Figure 1.
Experimental setup. A, The MAS measures resistance encountered during manual passive muscle stretching. During testing, subjects were lying in a semisupine position with the trunk at an angle of 30° of flexion. This neutral position helps to avoid increases in spasticity related to the stretching of the rectus femoris or the decrease of spasticity related to less stretched and more relaxed muscle. B, TMS was applied over the leg representation of the primary motor cortex to activate corticospinal neurons projecting directly or indirectly to quadriceps femoris motoneurons located around the third and fourth lumbar segment (L3–L4) to elicit an MEPs. MEP recruitment curves can be obtained by plotting the amplitude of the MEP against the TMS intensity and allow to define the MEP-max, I50, AMT, and the slope of the curve. C, During the StartReact response in some trials, an LED was presented with either a quiet acoustic stimulus or a startling acoustic stimulus (SAS). The StartReact response was measured between the VRT (defined as the time from cue to onset of the EMG burst in the quadriceps femoris after the LED presentation), the VART (defined as the time delay between the presentation of the quiet acoustic stimulus and the onset of the EMG response), and the VSRT (defined as the time between the SAS and the EMG onset).
Figure 2.
Figure 2.
MAS score distribution. Individual MAS score distribution showed that 66.7% of all individuals with incomplete SCI showed spasticity (spastic SCI, 20 out of 30; MAS 2, 3 and 4) and 33.3% of them showed no or low spasticity (non-spastic SCI, 10 out of 30; MAS 0 and1).
Figure 3.
Figure 3.
MVC. A, EMG recorded during the MVC test in a control subject and participants with SCI without (MAS = 0) and with (MAS = 3) spasticity. The non-spastic individual exhibited similar MVC compared with the control subject, whereas the spastic individual showed a reduced MVC compared with the other participants. B, Box plot charts represent the group data. The abscissa indicates the groups tested (blue bar represents controls; green bar represents non-spastic SCI; red bar represents spastic SCI), and the ordinate indicates the MVC (in millivolt). Top and bottom line of the box corresponds to the 95% CI, and the line in the box corresponds to the median. The two bars extend from the maximum and minimum value. ***p < 0.001.
Figure 4.
Figure 4.
MEP recruitment curves. A, The mean MEP recruitment curves in controls (blue line), non-spastic (green line), and spastic (red line) SCI groups. The x axis indicates the intensity of TMS, and the y axis indicates the MEP size in the quadriceps femoris muscle normalized to the M-max. The 95% CIs of each parameter of the sigmoid function were used to draw the confidence bands (dashed line) around each respective recruitment curve. The spastic group showed a reduced MEP-max and slope compared with the non-spastic group and control subjects. B, Box plot charts represent the group data. The abscissa indicates the groups tested (blue bar represents controls; green bar represents non-spastic SCI; red bar represents spastic SCI), and the ordinate indicates the MEP-max (as a percentage of the M-max, left) and the slope (right). Top and bottom line of the box corresponds to the 95% CI, and the line in the box corresponds to the median. The two bars extend from the maximum and minimum value. *p < 0.05, **p < 0.01, ***p < 0.001.
Figure 5.
Figure 5.
StartReact. A, The mean EMG activity related to VRT (black), VART (gray), and VSRT (red) in a control subject and participants with SCI without (MAS = 0) and with (MAS = 3) spasticity. Reaction time was prolonged in the spastic individual in all conditions compared with the non-spastic and control participant. Notably, in the spastic participant, reaction time further decreased during VSRT, but not during VART compared with VRT, in comparison of the other participants. B, Box plot charts represent the group data. The abscissa indicates the groups tested (blue bar represents controls; green bar represents non-spastic SCI; red bar represents spastic SCI), and the ordinate indicates the reticulospinal gain. Top and bottom line of the box corresponds to the 95% CI, and the line in the box corresponds to the median. The two bars extend from the maximum and minimum value. *p < 0.05.
Figure 6.
Figure 6.
MEP-max, MVCs, and reticulospinal gain. Individual data from non-spastic (green) and spastic (red) SCI participants. The abscissa indicates the MEP-max and reticulospinal gain (RSp gain; A) and the MVCs and RSp gain (B), and the ordinate indicates values expressed as a percentage of the mean value from controls. The line connects physiological outcomes recorded in the same participant. In non-spastic SCI participants, MEP-max, MVC, and the reticulospinal gain values were higher, lower, or similar to the control group. However, all spastic SCI participants showed smaller MEP-max and MVC and larger reticulospinal gain compared with the control group.
Figure 7.
Figure 7.
Correlations. Individual data from spastic (A, red) and non-spastic (B, green) SCI participants and control subjects (C, blue). The abscissa indicates the MVC (in millivolt), and the ordinate indicates the reticulospinal gain. MVC values were negatively correlated with the reticulospinal gain in spastic participants, but not in non-spastic and control participants.

References

    1. Anzak A, Tan H, Pogosyan A, Brown P (2011a) Doing better than your best: loud auditory stimulation yields improvements in maximal voluntary force. Exp Brain Res 208:237–243. 10.1007/s00221-010-2474-1 - DOI - PubMed
    1. Anzak A, Tan H, Pogosyan A, Djamshidian A, Ling H, Lees A, Brown P (2011b) Improvements in rate of development and magnitude of force with intense auditory stimuli in patients with Parkinson's disease. Eur J Neurosci 34:124–132. 10.1111/j.1460-9568.2011.07735.x - DOI - PubMed
    1. Asboth L, Friedli L, Beauparlant J, Martinez-Gonzalez C, Anil S, Rey E, Baud L, Pidpruzhnykova G, Anderson MA, Shkorbatova P, Batti L, Pagès S, Kreider J, Schneider BL, Barraud Q, Courtine G (2018) Cortico-reticulo-spinal circuit reorganization enables functional recovery after severe spinal cord contusion. Nat Neurosci 21:576–588. 10.1038/s41593-018-0093-5 - DOI - PubMed
    1. Aydin G, Tomruk S, Keles I, Demir SO, Orkun S (2005) Transcutaneous electrical nerve stimulation versus baclofen in spasticity: clinical and electrophysiologic comparison. Am J Phys Med Rehabil 84:584–592. 10.1097/01.phm.0000171173.86312.69 - DOI - PubMed
    1. Baker SN, Perez MA (2017) Reticulospinal contributions to gross hand function after human spinal cord injury. J Neurosci 37:9778–9784. 10.1523/JNEUROSCI.3368-16.2017 - DOI - PMC - PubMed

Publication types

MeSH terms