. 2020 Mar;105(3):610-622.
doi: 10.3324/haematol.2019.218503. Epub 2019 Aug 14.

PIEZO1 activation delays erythroid differentiation of normal and hereditary xerocytosis-derived human progenitor cells

Affiliations

PIEZO1 activation delays erythroid differentiation of normal and hereditary xerocytosis-derived human progenitor cells

Alexis Caulier et al. Haematologica. 2020 Mar.

Abstract

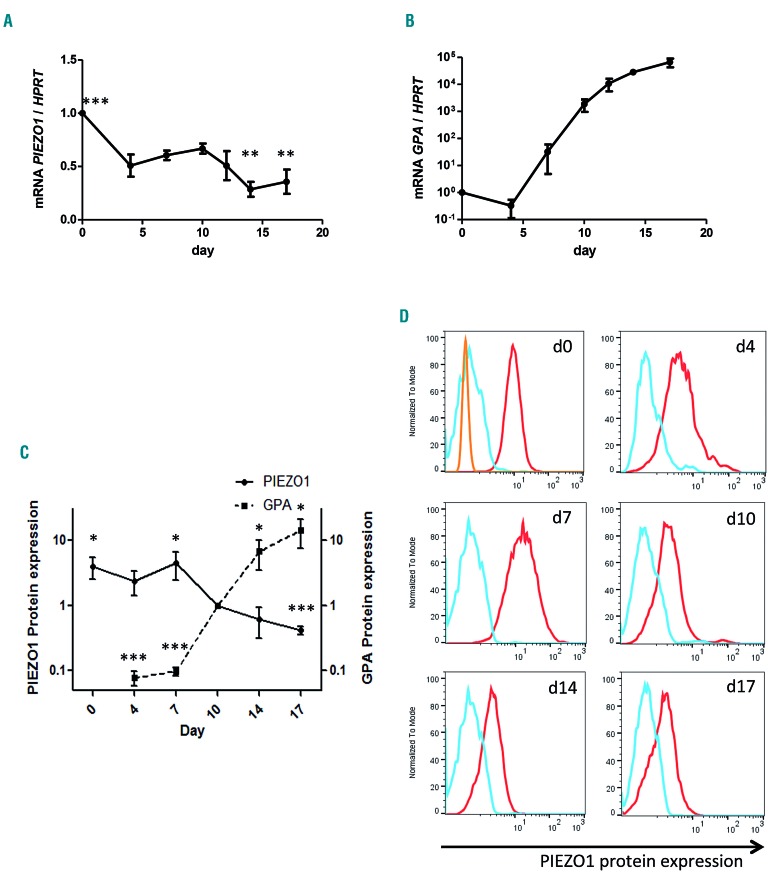
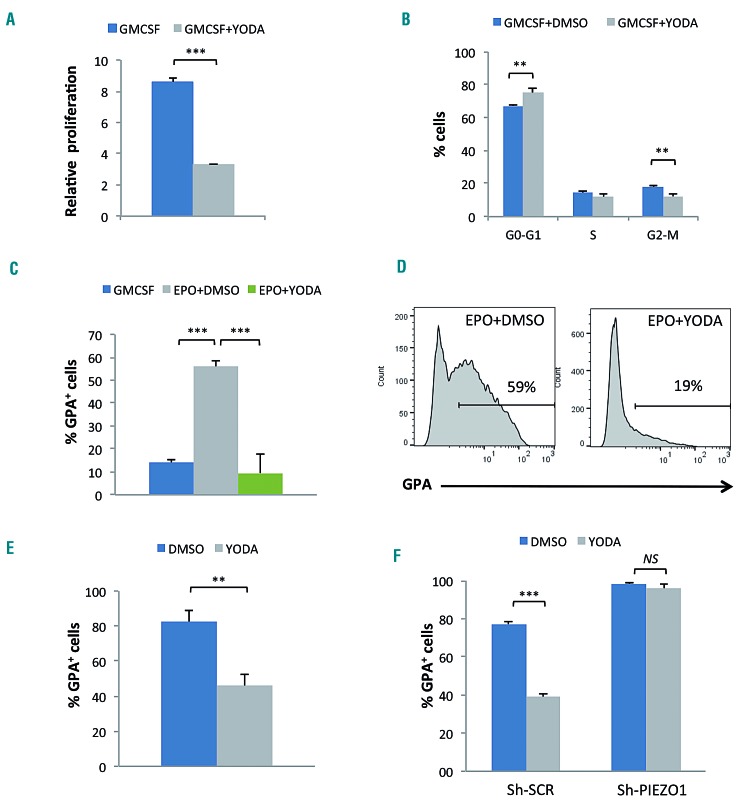
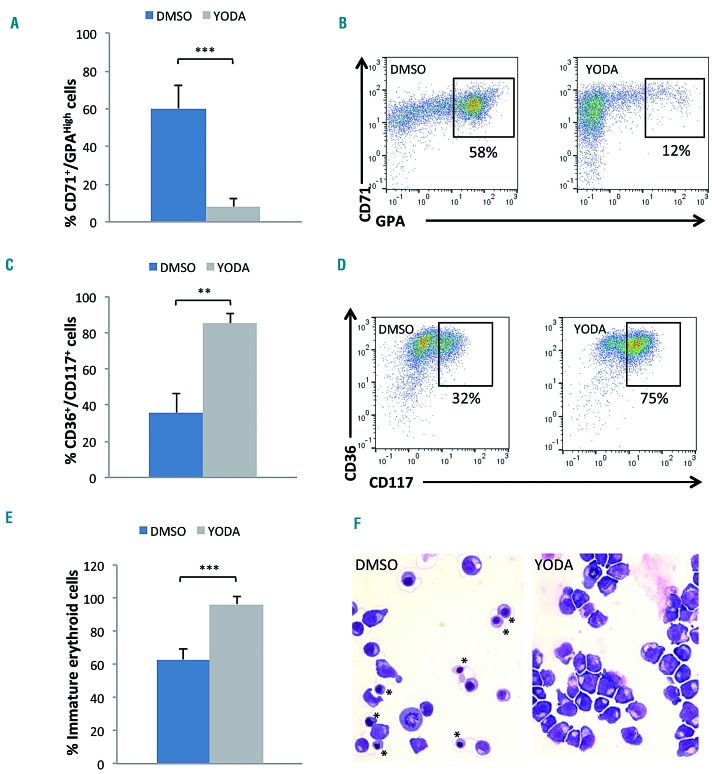
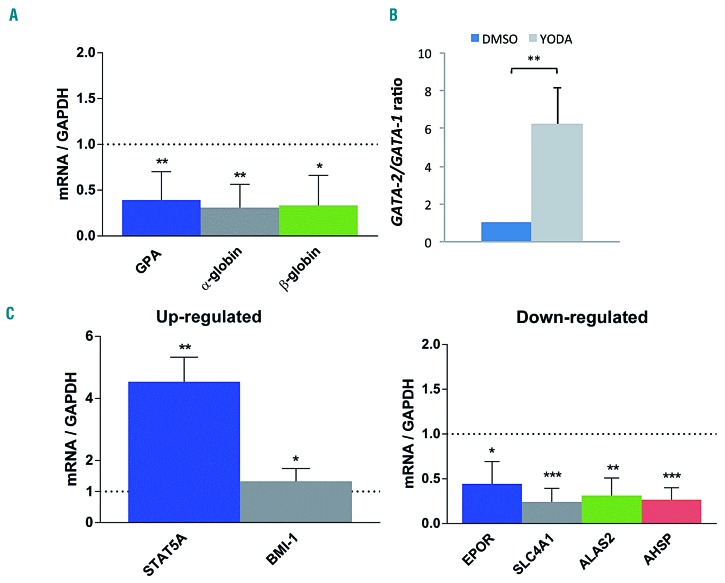
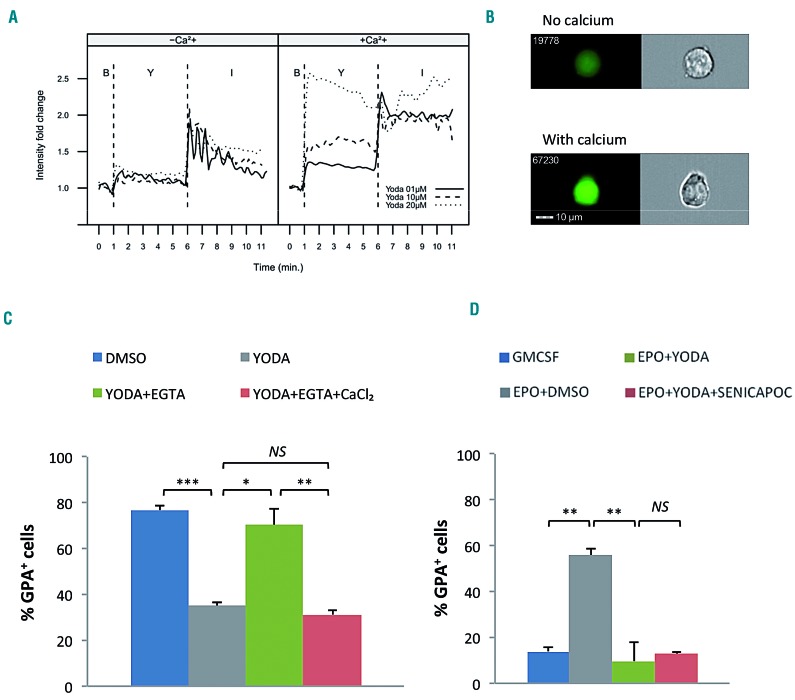
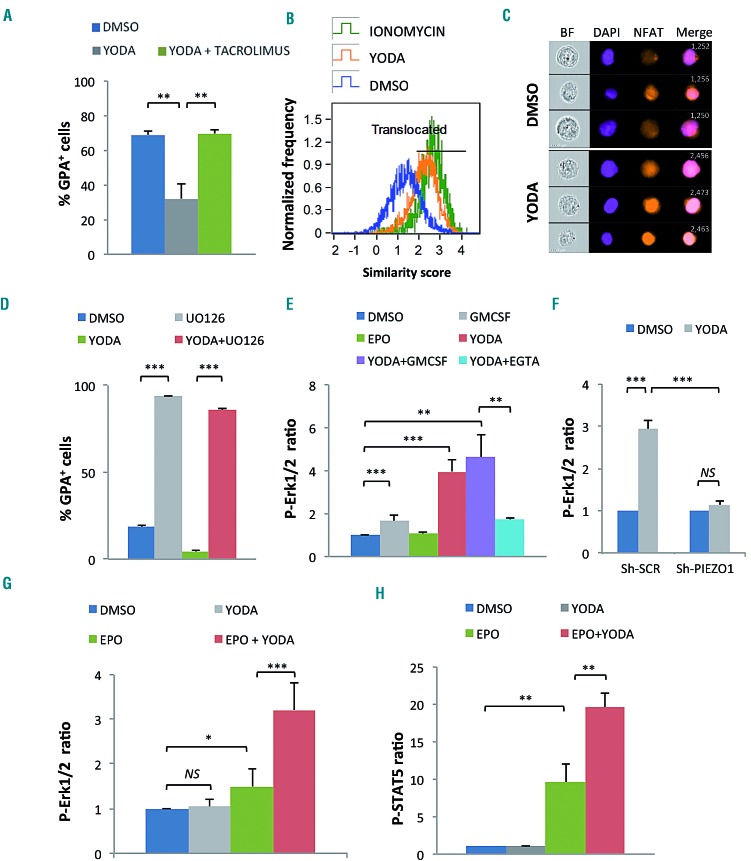
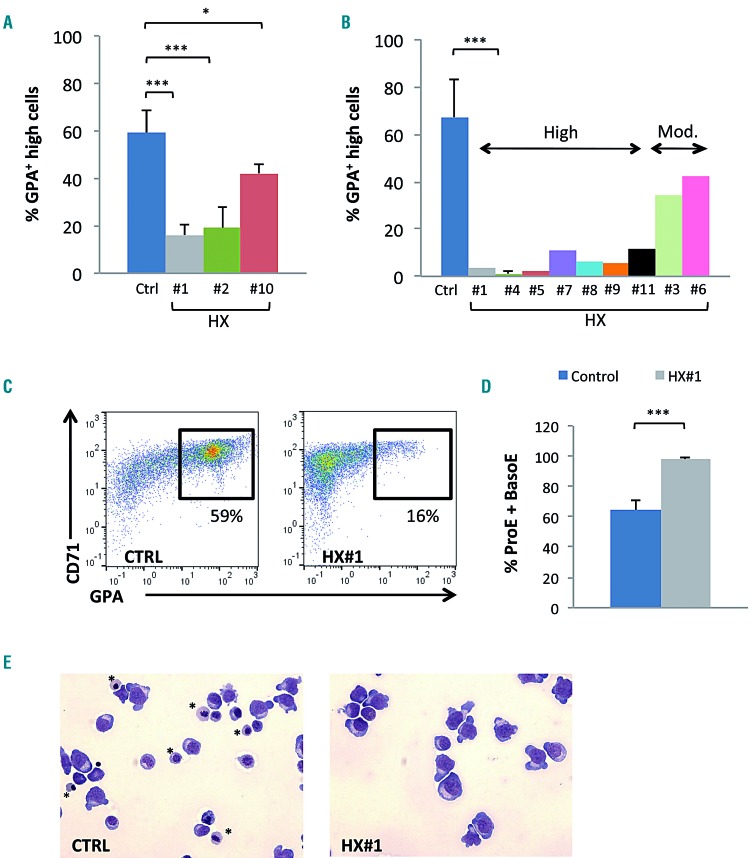
Hereditary xerocytosis is a dominantly inherited red cell membrane disorder caused in most cases by gain-of-function mutations in PIEZO1, encoding a mechanosensitive ion channel that translates a mechanic stimulus into calcium influx. We found that PIEZO1 was expressed early in erythroid progenitor cells, and investigated whether it could be involved in erythropoiesis, besides having a role in the homeostasis of mature red cell hydration. In UT7 cells, chemical PIEZO1 activation using YODA1 repressed glycophorin A expression by 75%. This effect was PIEZO1-dependent since it was reverted using specific short hairpin-RNA knockdown. The effect of PIEZO1 activation was confirmed in human primary progenitor cells, maintaining cells at an immature stage for longer and modifying the transcriptional balance in favor of genes associated with early erythropoiesis, as shown by a high GATA2/GATA1 ratio and decreased α/β-globin expression. The cell proliferation rate was also reduced, with accumulation of cells in G0/G1 of the cell cycle. The PIEZO1-mediated effect on UT7 cells required calcium-dependent activation of the NFAT and ERK1/2 pathways. In primary erythroid cells, PIEZO1 activation synergized with erythropoietin to activate STAT5 and ERK, indicating that it may modulate signaling pathways downstream of erythropoietin receptor activation. Finally, we studied the in-vitro erythroid differentiation of primary cells obtained from 14 PIEZO1-mutated patients, from 11 families, carrying ten different mutations. We observed a delay in erythroid differentiation in all cases, ranging from mild (n=3) to marked (n=8). Overall, these data demonstrate a role for PIEZO1 during erythropoiesis, since activation of PIEZO1 - both chemically and through activating mutations - delays erythroid maturation, providing new insights into the pathophysiology of hereditary xerocytosis.


Figures

Figure 1
Figure 1
PIEZO1 expression during human in vitro erythroid differentiation. PIEZO 1 expression was assessed at day 4 in CD45low/CD123/CD34+/CD36 cells, and at day 7 in CD36+ cells, for both the gene and protein expression experiments. (A) PIEZO1 mRNA expression (determined by quantitative reverse transcriptase polymerase chain reaction, RT-qPCR) relative to HPRT expression, during synchronized erythroid differentiation. Differential expression relative to day 0. Statistical analysis was made compared to day 10. No significant change was seen at days 4, 7, and 12. (B) Glycophorin A (GPA) mRNA expression (determined by RT-qPCR) relative to HPRT expression, during synchronized erythroid differentiation. Reference was day 0. (C) Kinetics of relative PIEZO1 protein expression during in-vitro erythroid differentiation, in parallel to relative GPA membrane expression. For both, expression at each time point was assessed by multiparametric flow cytometry (MFC) (mean fluorescence intensity at the time point relative to that at day 10.) (D) MFC histograms of PIEZO1 protein expression assessed at different culture time points (red). We used both the secondary antibody alone (blue) and a non-specific rabbit anti HLA-DR1 antibody (orange) as controls. (n=3 for all experiments). ***P<0.001; **P<0.01; * P<0.05.
Figure 2
Figure 2
Effect of PIEZO1 chemical activation on the proliferation and differentiation of UT7 cells. Glycophorin A (GPA) expression and cell proliferation were assessed after 72 h of culture in medium containing granulocyte-macrophage colony-stimulating factor (GMCSF) or erythropoietin (EPO). (A) In the UT7/GM cell line, stimulation with 5 μM YODA1 reduced cell expansion compared to that induced by dimethylsulfoxide (DMSO) (2.6 fold). (B) In the UT7/GM cell line exposure to 5 μM YODA1 in GMCSF-containing medium led to cell accumulation in the G0/G1 phase of the cycle (67±1% with DMSO vs. 75±3% with YODA1), and a significant decrease in cells in the G2/M phase (18±1% with DMSO vs. 12±2% with YODA1). (C) Stimulation with 5 U/mL EPO induced partial erythroid differentiation in UT7/GM cells, as shown by GPA acquisition (56±3% vs. 14±2% in GMCSF-containing medium), which was strongly inhibited after PIEZO1 chemical activation using 5 μM YODA1 (9±8% with YODA1 vs. 56±3% with EPO+DMSO). (D) Representative multiparametric flow cytometry histograms showing the repression of EPO-mediated GPA expression after exposure to YODA1 in UT7/GM cells. (E) GPA repression was also observed in UT7/EPO cells after exposure to 5 μM YODA1 for 3 days (82±6% vs. 46±7% with DMSO). (F) In UT7/EPO cells transduced with Sh-SCR, YODA1 repressed GPA expression (39±1.8% vs. 77±1.1% with DMSO) whereas infection with a mixture of four different Sh-PIEZO1 abolished the YODA1-mediated inhibition of GPA (96±2% with YODA1 vs. 98±0.4%, P=NS). (n=3 for all experiments, ***P<0.001; **P<0.01).
Figure 3
Figure 3
PIEZO1 chemical activation delayed erythroid differentiation of human primary CD34+-derived cells. (A) Exposure to 1 μM YODA1 for 3 days decreased the mature erythroblastic population expressing CD71 and GPAHigh [8±4% vs. 60±12% with dimethylsulfoxide (DMSO)]: multiparametric flow cytometry (MFC) at day 10. (B) Representative MFC plots showing the decrease in the CD71+/GPAHigh population due to YODA1 (right) compared to the effect of DMSO (left), at day 10. (C) Exposure to 1 μM YODA1 increased the immature erythroblastic population expressing CD36 and CD117 (85±5%) compared to that following exposure to DMSO (36±11%). (D) Representative MFC plots showing the increase in CD36+/CD117+ population due to YODA1 (right) compared to that due to DMSO (left), at day 10. (E) Excess of immature erythroid cells, i.e., proerythroblasts and basophilic erythroblastsb upon exposure to YODA1 compared to exposure to DMSO, assessed by cytology after May-Grünwald-Giemsa (MGG) staining (96±5% vs. 63±6%). (F) Representative cytology after MGG staining at day 10 of in vitro erythroid differentiation showing a heterogeneous population of erythroblasts at all stages of maturation including the orthrochromatic (*) stage in the control (left) compared to a more homogeneous population of immature erythroblasts in the presence of 1 μM YODA (right). (n=4 in experiment E, n=3 in all other experiments). ***P<0.001; **P<0.01 ; *P<0.05.
Figure 4
Figure 4
Effect of PIEZO1 activation on the transcriptional program of erythroid differentiation in primary human CD34+-derived cells, assessed by quantitative reverse transcriptase polymerase chain reaction. For all experiments, primary cells were cultured for 10 days, with 1 μM YODA1 or dimethylsulfoxide (DMSO) stimulation from day 3 to 10. Gene expression was assessed relative to GAPDH expression. (A) Compared to exposure to DMSO, exposure to 1 μM YODA1 decreased GPA mRNA expression (×0.49±0.17), β-globin RNA expression (×0.4±0.26) and α-globin RNA expression (×0.3±0.24). (B) Compared to exposure to DMSO, exposure to 1 μM YODA1 increased the GATA2/GATA1 mRNA ratio (×6.2±1.9). (C) Stimulation with 1 μM YODA1 increased STAT5A and BMI-1 expression, and decreased EPOR, SLC4A1, ALAS2, and AHSP mRNA expression. (n=3 for all experiments); ***P<0.001; **P<0.01; *P<0.05.
Figure 5
Figure 5
The effect of PIEZO1 activation on erythroid differentiation is calcium-dependent but does not involve a secondary activation of the Gardos channel. (A and B) Cells were incubated with Fluo4-AM for 30 min before stimulation with 5 μM YODA1. (C and D) UT7/EPO cells were cultured for 72 h after drug stimulation. (A) YODA1 stimulation caused a dose-dependent increase in cytosolic calcium concentration in a calcium-containing medium (+Ca2+, right panel). No effect was seen in a calcium-free medium (-Ca2+, left panel). YODA1 stimulation (“Y”) was performed 60 s after the baseline recording (“B”), before recording for 300 s. The YODA1 concentration was 1 μM (solid line), 10 μM (dashed line), or 20 μM (dotted line). The positive control for an intracellular Ca2+ increase was stimulation with 1 μM ionomycin (“I”) recording for 300 s. The image shown here is representative of three identical experiments. (B) Image of intracellular Ca2+ content assessed by ImageStreamX using Fluo4-AM cell permeant, after stimulation with 20 μM YODA1 in Ca2+-containing (lower panel) or Ca2+-free (upper panel) medium. (C) In UT7/EPO cells, exposure to 5 μM YODA1 decreased glycophorin A (GPA) expression (35±1.4%) compared to the expression following exposure to dimethylsulfoxide (DMSO) (77±2%). Extracellular Ca2+ chelation using 2 mM ethylene glycol tetra-acetic acid (EGTA) prevented the GPA decrease due to YODA1 (70±7%), and the effect was rescued by adding 2 mM extra calcium chloride (31±2%). (D) Co-exposure with 4 μM Senicapoc, a selective Gardos channel inhibitor, did not block the GPA decrease (13±1%) due to YODA1 stimulation (10±8%, P=NS) in erythropoietin (EPO)-containing medium, compared to DMSO (56±3%). (n=3 for all experiments; ***P<0.001; **P<0.01; *P<0.05). GMCSF: granulocyte-macrophage colony-stimulating factor.
Figure 6
Figure 6
YODA1 activates NFAT, ERK and STAT5 pathways in erythroid cells. (A) The decrease in glycophorin A (GPA) in UT7/EPO cells after exposure to 5 μM YODA1 was blocked by concomitant exposure to 5 μM tacrolimus (32±8% vs. 70±2.5%). (B) NFAT nuclear translocation secondary to exposure to 10 μM YODA1, assessed on ImageStream®X by the similarity score (SS) value in UT7/EPO cells, after overnight starvation of serum and erythropoietin (EPO). The SS is a mathematical tool used in Amnis IDEAS® software to assess the co-localization of a fluorescent signal (NFATc1-PE) and 4',6-diamidino-2-phenylindole (DAPI) nuclear staining. A high SS value means a highly translocated state. (C) Images of NFATc1 cellular localization using live imaging flow cytometry. After exposure to dimethylsulfoxide (DMSO), NFATc1 was preferentially localized in the cytosol, whereas 10 μM YODA1 increased NFATc1 nuclear translocation. Images were extracted from Amnis IDEAS®software for mean SS values of each condition. (D) In UT7/GM cells, 10 μM UO126 induced high glycophorin A (GPA) expression (94±0.2%) compared to that following exposure to DMSO (18±2%) in medium containing granulocyte-monocyte colony-stimulating factor (GMCSF), and reverted the YODA1-mediated GPA repression when EPO was added (86±1%). Cells were incubated with UO126 for 30 min before stimulation with 5 μM YODA1, then cultured for 72 h. (E) ERK phosphorylation assessed by PhosphoFlow in UT7/GM cells. Values shown are the p-ERK ratio relative to DMSO alone. GMCSF induced mild ERK phosphorylation (×1.65±0.27) whereas 10 U/mL EPO did not (×1.06±0.1, P=NS). YODA1 (10 μM) induced strong ERK phosphorylation (×3.96±0.581), an effect that was markedly inhibited by 2 mM ethylene glycol tetra-acetic acid (EGTA) (×1.71±0.05). (F) ERK phosphorylation assessed by PhosphoFlow in UT7/EPO cells. Sh-RNA-mediated PIEZO1 knockdown inhibited the 10 μM YODA1-induced ERK phosphorylation (fold P-ERK increase in Sh-SCR-transduced cells: ×2.93±0.2; in Sh-PIEZO1-transduced cells: ×1.13±0.1). (G) ERK phosphorylation assessed by PhosphoFlow in primary human CD34+- derived erythroid cells. YODA1 did not induce ERK phosphorylation (×1.04±0.16, P=NS), whereas 5 U/mL EPO did moderately (×1.49±0.4). YODA1 synergized with EPO to induce ERK phosphorylation (×3.21±0.62). (H) STAT5 phosphorylation assessed by PhosphoFlow in primary human CD34+-derived erythroid cells. Compared to DMSO, YODA1 did not induce STAT5 phosphorylation (×1.03±0.09, P=NS), whereas EPO did (×9.6±2.4), and YODA1 enhanced EPO-driven STAT5 phosphorylation (×19.6±1.9). (n=3 in A and D, and n=4 in all other experiments); ***P<0.001 ; **P<0.01; *P<0.05
Figure 7
Figure 7
Delay in erythroid differentiation of progenitor cells obtained from patients with PIEZO1-mutated hereditary xerocytosis. (A) Culture of CD34+-derived erythroid cells from patients with hereditary xerocytosis (HX); differentiation was assessed at day 10 by multiparametric flow cytometry (MFC). The mean percentage of CD71+/GPAHigh cells was 59±9% in control samples, 16±5% in HX#1 (P<0.001), 19±9% in HX#2 (P<0.01), and 42±4% in HX#10 (P<0.05). (n=5 for control samples; n=3 for HX#1, 2 and 10). (B) Culture of mononuclear cells from HX patients; differentiation assessed on day 10 by MFC (n=9 for control samples; n=3 for HX#4; n=1 for HX#1-11). The mean percentage of CD71+/GPAHigh cells was 71±17% in the control group, and ranged from 0.3% to 11.7% in the “high delay” group and from 22.5% to 44% in the “moderate delay” group. (C) Illustrative CD71/GPA MFC plots at day 10 of erythroid differentiation of CD34+ cells obtained from patient HX#1 (right) and from one representative control sample (left). (D) Cytological analysis after staining with May-Grünwald-Giemsa (MGG): count of immature erythroblasts [proerythroblasts (ProE) and basophilic erythroblasts (BasoE)] on day 10, ×200 magnification. Immature erythroblasts were 64.2±6.2% in control samples vs. 97.7±1.5% in HX#1 (n=6 control samples; n=3 for patient HX#1). (E) Example of cytology on day 10 for patient HX#1 (right) and for a control sample (left), MGG staining, ×200 magnification. *show orthochromatic erythroblasts. ***P<0.001; **P<0.01; *P<0.05.

Comment in

References

    1. Coste B, Mathur J, Schmidt M, et al. Piezo1 and Piezo2 are essential components of distinct mechanically activated cation channels.Science.2010;330(6000):55–60. - PMC - PubMed
    1. Saotome K, Murthy SE, Kefauver JM, Whitwam T, Patapoutian A, Ward AB. Structure of the mechanically activated ion channel Piezo1.Nature.2018;554(7693):481–486. - PMC - PubMed
    1. Zhao Q, Zhou H, Chi S, et al. Structure and mechanogating mechanism of the Piezo1 channel.Nature.2018;554(7693):487–492. - PubMed
    1. Cinar E, Zhou S, DeCourcey J, Wang Y, Waugh RE, Wan J. Piezo1 regulates mechanotransductive release of ATP from human RBCs.Proc Natl Acad Sci U S A.2015;112(38):11783–11788. - PMC - PubMed
    1. Cahalan SM, Lukacs V, Ranade SS, Chien S, Bandell M, Patapoutian A. Piezo1 links mechanical forces to red blood cell volume. Elife. 2015;4. - PMC - PubMed

Publication types

Supplementary concepts