

doi: 10.3324/haematol.2019.219352.
Epub 2019 Aug 14.
Genomics of therapy-related myeloid neoplasms
Affiliations
- PMID: 31413096
- PMCID: PMC7049337
- DOI: 10.3324/haematol.2019.219352
Item in Clipboard
Genomics of therapy-related myeloid neoplasms
Haematologica.
2020 Mar.
No abstract available
Figures
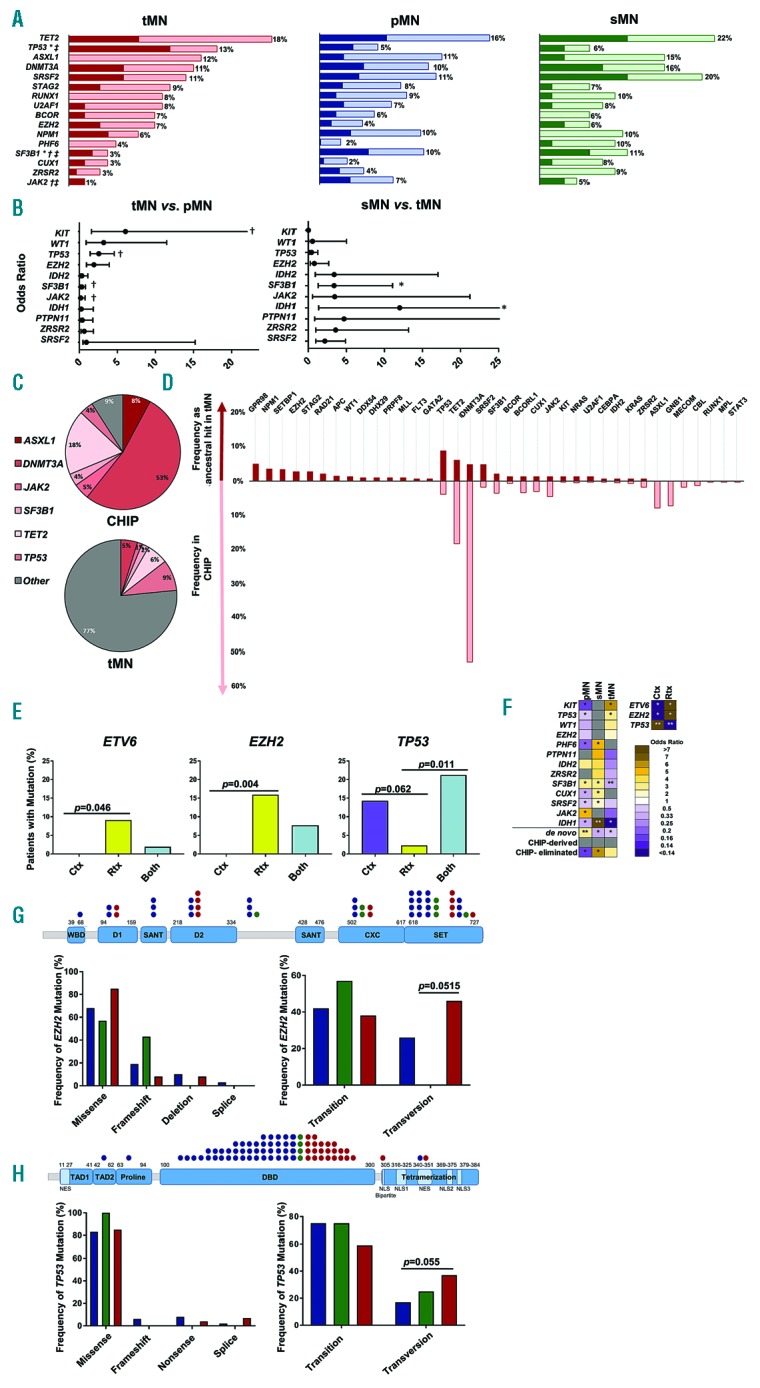
Mutational Landscape of therapy-related myeloid neoplasms. (A) Frequencies of the top 10 most common mutations observed. Dark red, blue, and green indicate ancestral events while light red, blue, and green represent secondary, subclonal events. *Denotes statistical significance between tMN and sMN; †denotes statistical significance between tMN and pMN; ‡denotes statistical significance between tMN and pMN+sMN. (B) Forest plot of odds ratios for mutations in tMN versus pMN and sMN versus tMN; †denotes statistical significance between tMN and pMN; *denotes statistical significance between tMN and sMN. (C) Relationship of common mutations found in CHIP versus ancestral mutations in tMN. (D) Frequencies of mutations occurring as ancestral events in tMN (maroon) versus frequencies found in CHIP based on meta-analysis (pink). (E) Effect of treatment modality on mutational acquisition. Frequencies of mutations found in Ctx, chemotherapy; Rtx, radiation; Both, combination of chemotherapy and radiation. (F) Heat map of events occurring in tMN, pMN, and sMN, expressed as odds ratios. Events include mutations, relationship to CHIP, and associations of treatment modality with mutations. Gray squares indicate opposing or no relationships between groups. Events marked with * are significant in one direction, while those marked with **are significant in two directions. (G) Effect of therapy on EZH2. WBD, WD-40 binding domain; D1: domain 1; SANT contains Switching-defecting protein 3 (Swi3), adaptor 2 (Ada2), nuclear receptor co-repressor (N-CoR), and transcription factor TFIIIB; D2: domain 2; CXC: cysteine-rich domain; and SET: the catalytic domain; MCSS: motif connecting SANT1L and SANT2L. Red, tMN; blue, pMN; green, sMN. (H) Effect of therapy on TP53. TAD1: transactivation 1 domain; TAD2: transactivation 2 domain; Proline: proline-rich domain; DBD: DNA-binding domain; Tetramerization: tetramerization domain; NES: nuclear export signal; NLS: nuclear localization signal. Red: tMN; blue: pMN; green: sMn. Only values of P<0.05 are considered significant.
References
-
- Shih AH, Rapaport F, Chung SS, et al. Mutation profiling of therapy-related myeloid neoplasms using next-generation sequencing demonstrates distinct profiles from de novo disease. Blood. 2014; 124(21):4611–4611.
-
- Nishiyama T, Ishikawa Y, Kawashima N, et al. Mutation analysis of therapy-related myeloid neoplasms. Cancer Genet. 2018;222-223: 38–45. - PubMed
Publication types
MeSH terms
Grants and funding
LinkOut - more resources
Full Text Sources
Medical
