. 2019 Aug 14;11(505):eaav7171.
doi: 10.1126/scitranslmed.aav7171.

MDM2 antagonists overcome intrinsic resistance to CDK4/6 inhibition by inducing p21

Affiliations

MDM2 antagonists overcome intrinsic resistance to CDK4/6 inhibition by inducing p21

Anna E Vilgelm et al. Sci Transl Med. .

Abstract

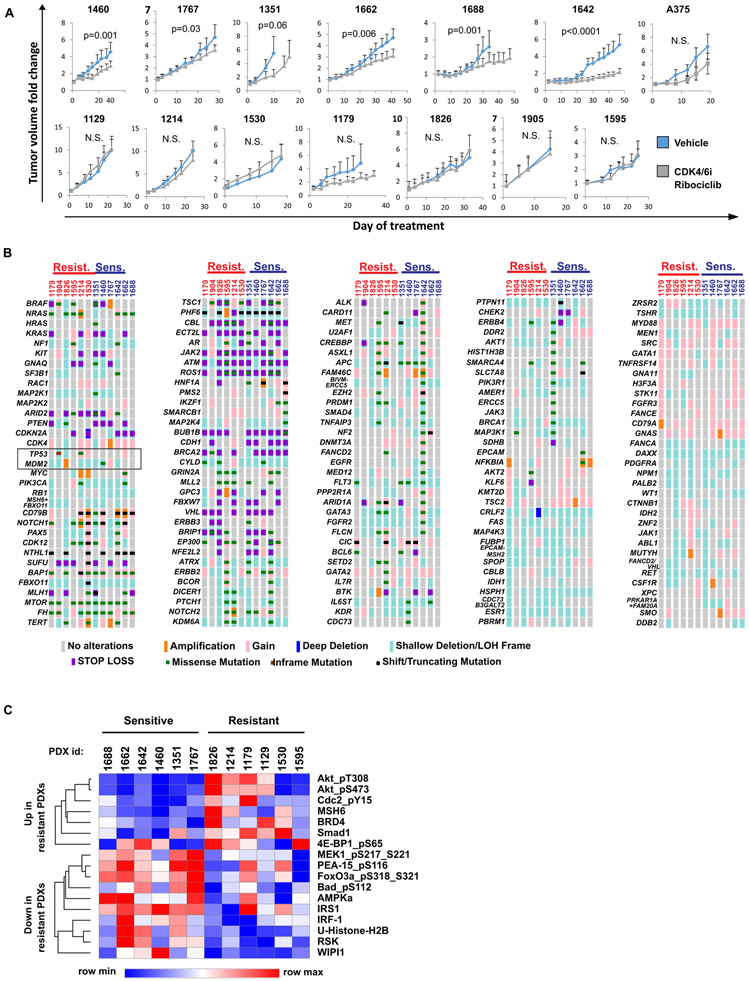
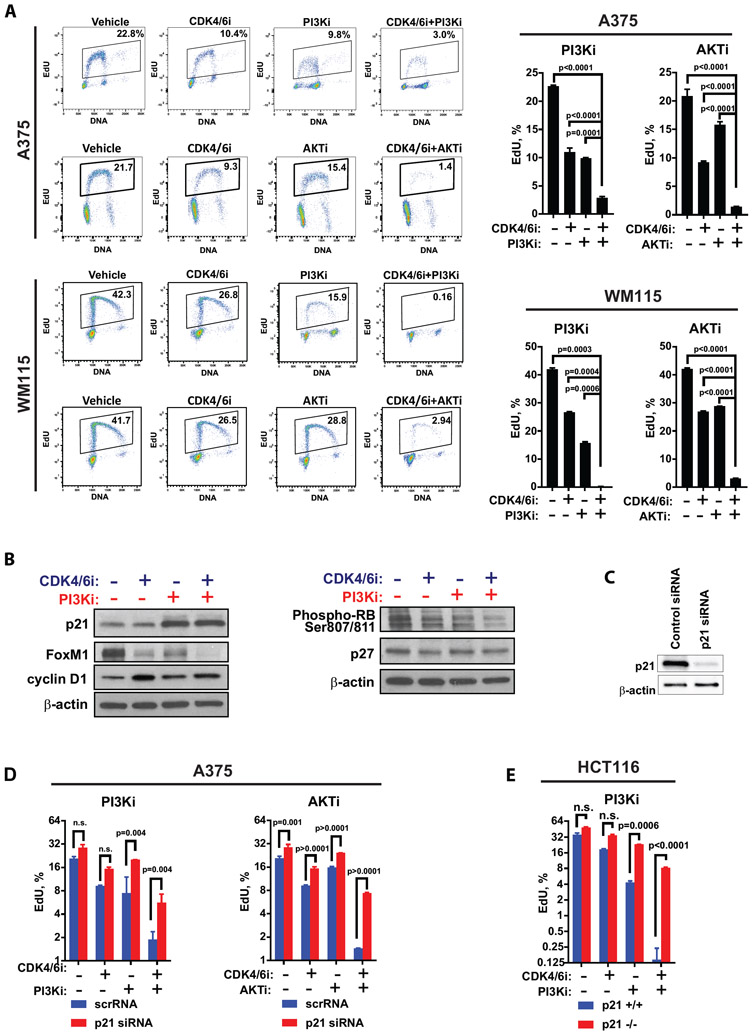
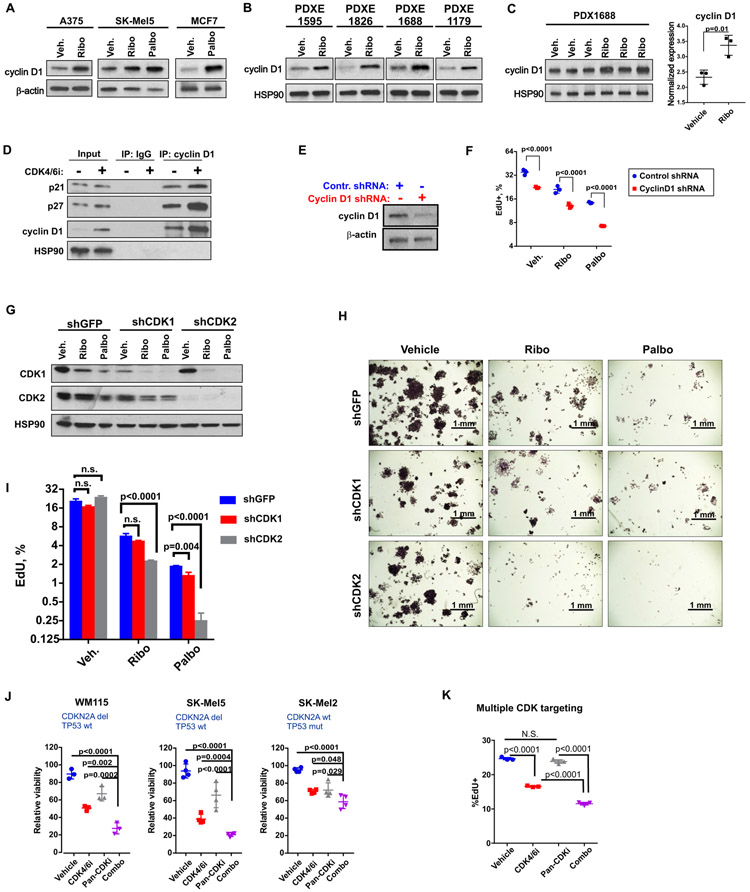
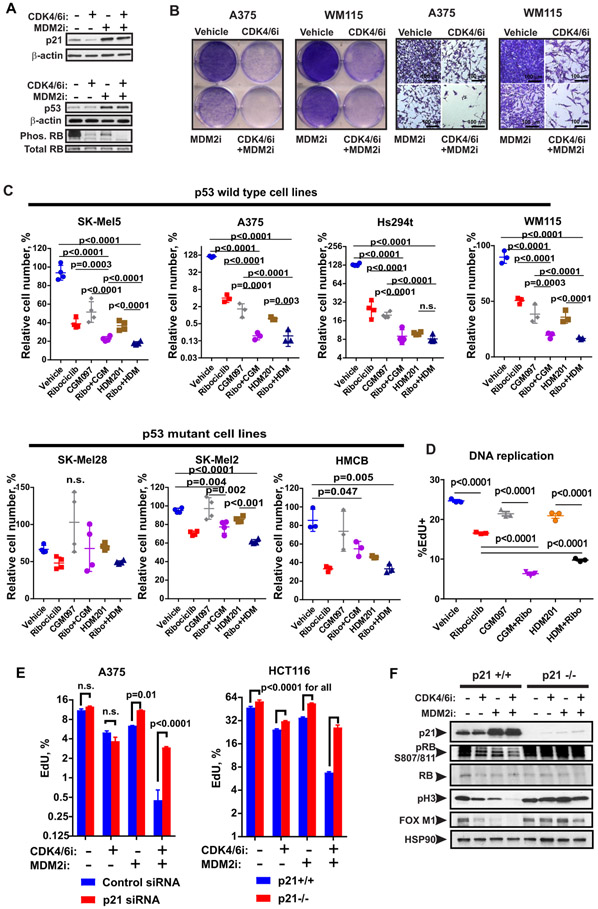
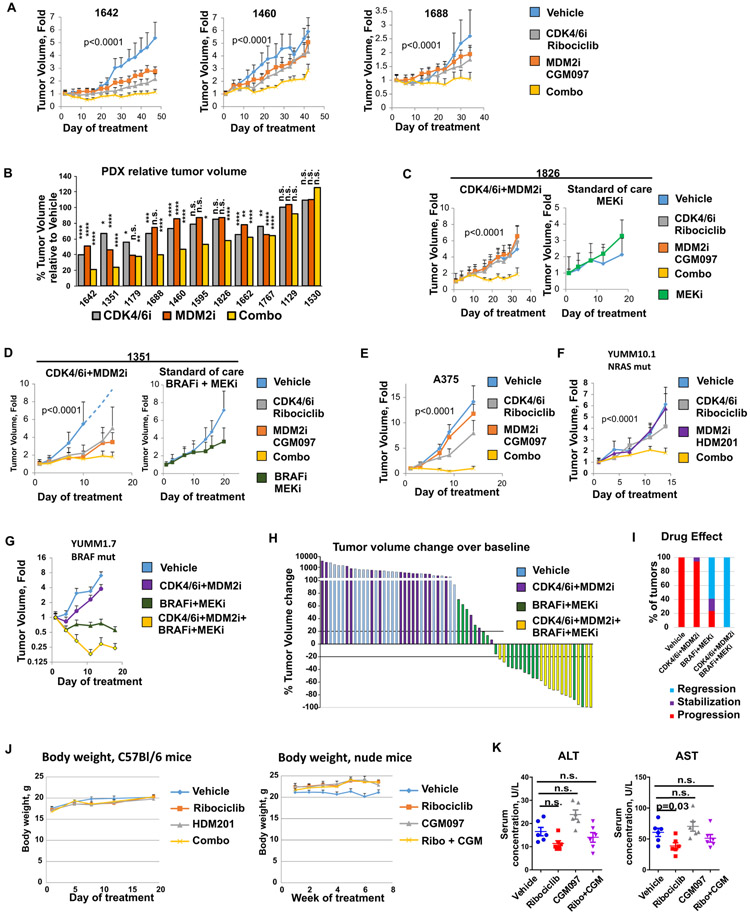
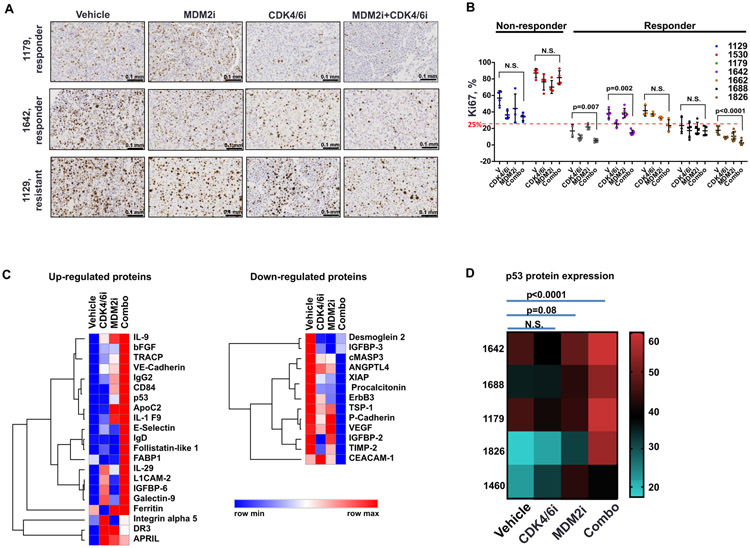
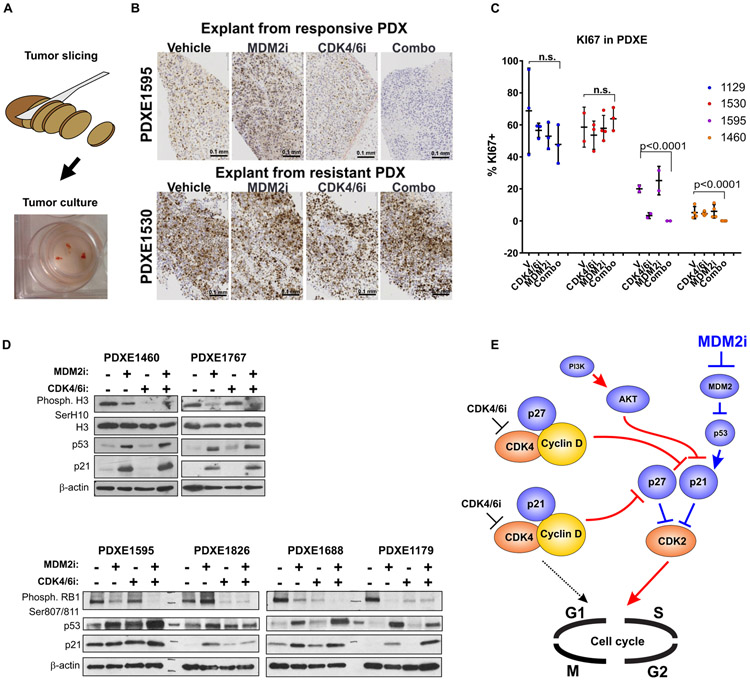
Intrinsic resistance of unknown mechanism impedes the clinical utility of inhibitors of cyclin-dependent kinases 4 and 6 (CDK4/6i) in malignancies other than breast cancer. Here, we used melanoma patient-derived xenografts (PDXs) to study the mechanisms for CDK4/6i resistance in preclinical settings. We observed that melanoma PDXs resistant to CDK4/6i frequently displayed activation of the phosphatidylinositol 3-kinase (PI3K)-AKT pathway, and inhibition of this pathway improved CDK4/6i response in a p21-dependent manner. We showed that a target of p21, CDK2, was necessary for proliferation in CDK4/6i-treated cells. Upon treatment with CDK4/6i, melanoma cells up-regulated cyclin D1, which sequestered p21 and another CDK inhibitor, p27, leaving a shortage of p21 and p27 available to bind and inhibit CDK2. Therefore, we tested whether induction of p21 in resistant melanoma cells would render them responsive to CDK4/6i. Because p21 is transcriptionally driven by p53, we coadministered CDK4/6i with a murine double minute (MDM2) antagonist to stabilize p53, allowing p21 accumulation. This resulted in improved antitumor activity in PDXs and in murine melanoma. Furthermore, coadministration of CDK4/6 and MDM2 antagonists with standard of care therapy caused tumor regression. Notably, the molecular features associated with response to CDK4/6 and MDM2 inhibitors in PDXs were recapitulated by an ex vivo organotypic slice culture assay, which could potentially be adopted in the clinic for patient stratification. Our findings provide a rationale for cotargeting CDK4/6 and MDM2 in melanoma.


Figures

Figure 1.
Figure 1.. Melanoma PDXs are intrinsically resistant to CDK4/6 inhibition.
A. Tumor volume change over time was assessed in 13 distinct melanoma PDXs and A375 melanoma xenografts grown in BALB/c nude mice that were treated daily with 100 mg/kg of the CDK4/6i ribociclib or vehicle. B. Genetic mutations and copy number alterations in tumors that were used to generate PDXs shown in A. Paired targeted DNA seq analysis was performed on tumor tissue and corresponding blood sample. Tumor-specific genetic alterations are shown. The map was generated using OncoPrinter. C. RPPA analysis of protein lysates prepared from vehicle-treated PDXs. Statistical analysis was performed using multiple T-test without correction for multiple comparisons, with alpha=0.05%. Each row (protein marker) was analyzed individually, without assuming a consistent SD. Results from proteomics analysis of proteins differentially expressed in CDK4/6i-responsive and resistant PDXs are shown.
Figure 2.
Figure 2.. Inhibition of PI3K/AKT pathway enhances response to CDK4/6i by inducing p21.
A. The percentages of A375 or WM115 cells replicating DNA after 3 days of treatment with DMSO (vehicle), CDK4/6i (ribociclib, 3 μM), PI3Ki (buparlisib, 5 μM), AKTi (ipatasertib, 10 μM), or indicated combinations of these drugs as determined by EdU incorporation assay. Representative flow cytometry plots are shown on the left. Graphs on the right summarize data from 3 biological replicates (mean ± SD) with statistical comparison of log transformed values performed using one-way ANOVA with Tukey's multiple comparisons test. B. Western blot analysis of indicated proteins in A375 cells treated for 3 days with DMSO (vehicle), CDK4/6i (ribociclib, 3 μM), PI3Ki (buparlisib, 5 μM), or combination of ribociclib and buparlisib. C. Western blot analysis of p21 expression in A375 cells transfected with control non-targeting or p21-targeting siRNA. D-E. Results of the EdU incorporation assay in A375 expressing control or p21 siRNA (D) and in isogenic HCT116 p21+/+ and p21−/− cells(E). Cells were treated with DMSO (vehicle), CDK4/6i (ribociclib, 3 μM), PI3Ki (buparlisib/BKM120, 5 μM), AKTi (ipatasertib, 10 μM), or indicated drug combinations for 2 days. Mean percentage of EdU-positive cells ± SD shown. Statistical analysis of the log-transformed percentages of the EdU+ cells was performed using 2-way ANOVA and corrected for multiple comparisons with Sidak's test.
Figure 3.
Figure 3.. Cyclin D1 and CDK2 facilitate CDK4/6i resistance.
A. Western blot analysis of cyclin D1 in lysates from indicated cells treated with DMSO (Veh.), 3 μM ribociclib (Ribo), or 1 μM palbociclib (Palbo) for 3 days. B. Western blot analysis of cyclin D1 in lysates from PDX explants (PDXE) cultured with DMSO or 3 μM CDK4/6i ribociclib for 3 days. C. Cyclin D1 expression in PDX1688 tumors from mice treated daily with 100 mg/kg of ribociclib as shown in Fig. 1A. Statistical comparison performed with t test after log transformation. D. Co-immunoprecipitation assay in A375 cells treated with DMSO or 3 μM ribociclib for 3 days. E. The efficiency of cyclin D1 knockdown in A375 cells stably transfected with cyclin D1 shRNA or control non-targeting shRNA. F. EdU incorporation analysis of DNA replication in A375 cells transfected with control or cyclin D1-targeting shRNA and treated with DMSO (vehicle), 3 μM ribociclib (Ribo), or 1 μM palbociclib (Palbo) for 3 days. Two-way ANOVA with Sidak's multiple comparisons test was used after log transformation for statistical comparison of cyclin D1-deficient and control cells. G. The CDK1 and CDK2 shRNA knockdown efficiency in A375 cells treated with DMSO (veh.), 3 μM ribociclib (Ribo), or 1 μM palbociclib (Palbo) for 2 days. H. Colony formation assay. Indicated shRNA-expressing cells were plated at 1000 cells per well in 6-well plates and treated with DMSO (veh.), 3 μM ribociclib (Ribo), or 1 μM palbociclib (Palbo) for 7 days. Cells were visualized with crystal violet. Scale bar: 1 mm. I. DNA replication analysis for A375 cells transduced with CDK1 or CDK2 shRNA. Cells were treated as in G. The experiment was repeated three times, and mean ± SD from representative experiment is shown. Statistical comparison was performed using two-way ANOVA after log transformation. Sidak's test was used to correct for multiple comparisons. J. Results of the CellTiter-Blue viability assay in indicated cells treated with 3 μM ribociclib (CDK4/6i), 10 μM seliciclib (Pan-CDKi), the combination of both drugs (combo), or vehicle for 3 days. Graphs were produced in Prism. Statistical significance of cell viability differences between the “combo” and all other treatment groups was examined using one-way ANOVA after log transformation with Tukey's multiple comparisons test. K. The percentages of SK-Mel5 cells replicating DNA after 3 days of treatment with 3 μM ribociclib (CDK4/6i), 10 μM seliciclib (Pan-CDKi), combination of both drugs (combo), or vehicle measured by flow cytometry after EdU incorporation assay. One-way ANOVA after log transformation with Tukey's multiple comparisons test was performed to calculate statistical significance.
Figure 4.
Figure 4.. MDM2 inhibition improves response to CDK4/6 inhibition via the p53-mediated induction of p21.
A. Western blot analysis of protein lysates from A375 cells treated with 2.5 μM of palbociclib (CDK4/6i) ± 2.5 μM of Nutlin-3A (MDM2i) or vehicle for 3 days. B. Representative photographs of plate wells and microscopy images of A375 and WM115 cells treated as described in A and stained with crystal violet. Scale bar: 100 μm. C. Relative numbers of indicated melanoma cells after 3 days of treatment with 1 μM CDK4/6i ribociclib, 0.5 μM MDM2i CGM097, 0.1 μM MDM2i HDM201, or indicated combinations of these drugs as determined by CellTiterBlue assay. D. Percentages of SK-Mel5 cells replicating DNA after treatment with 1 μM ribociclib, 0.5 μM CGM097, 0.1 μM HDM201, or indicated combinations of these drugs for 3 days was determined using EdU incorporation assay. C-D. For statistical analysis, we used one-way ANOVA after log transformation with Tukey’s post-test. E. EdU incorporation in A375 cells transfected with control or p21 siRNA and in WT and p21−/− HCT116 cells after 2 days of treatment with 3 μM of ribociclib (CDK4/6i), 0.5 μM of MDM2i CGM097 (for A375), 0.2 μM of MDM2i HDM201 (for HCT116), combination of both drugs, or vehicle. Mean ± SD is shown. Two-way ANOVA with Sidak’s multiple comparison test was performed on log-transformed values. F. Western blot analysis of indicated proteins in HCT116 cells treated as described in E.
Figure 5.
Figure 5.. Combined treatment with CDK4/6i and MDM2i is effective in PDXs and murine melanoma models.
A. The effect of CDK4/6i and MDMi on growth of melanoma PDXs. PDX tumors 1642, 1460, and 1688 were implanted into nude mice. Animals were treated daily with 100 mg/kg CDK4/6i ribociclib, 50 mg/kg MDM2i CGM097, the combination of both drugs, or vehicle (MC+HPMC). Tumor volume change over time is shown for each treatment group. B. Eleven melanoma PDXs with wt p53 were grown in nude mice treated as described in A. Final tumor volumes in treatment groups relative to vehicle group are shown. Statistical analysis was performed using linear mixed effects regression model. C. Tumor volume change over time in nude mice implanted with PDX1826 and treated as described in A or with MEKi (trametinib, 1 mg/kg) once a day. D. Tumor volume change over time in nude mice implanted with PDX1351 and treated as described in A or with MEKi+BRAFi (trametinib, 1 mg/kg + dabrafenib, 30 mg/kg) once a day. E. Growth of A375 tumors implanted into nude mice and treated as described in A. F. YUMM10.1 tumors were grown in C57Bl/6 mice. Animals were treated daily with 100 mg/kg CDK4/6i ribociclib, 20 mg/kg MDM2i HDM201, the combination of both drugs, or vehicle (MC+HPMC). G. YUMM1.7 tumors were grown in C57Bl/6 mice. Animals were treated daily with combination of 100 mg/kg CDK4/6i ribociclib and 20 mg/kg MDM2i HDM201, combination of MEKi+BRAFi (trametinib, 1 mg/kg + dabrafenib, 30 mg/kg), the four drugs combined, or vehicle (MC+HPMC) once a day. Tumor volume changes over time are shown. H. Waterfall plot of YUMM1.7 tumor volume changes over baseline after indicated treatment from experiment shown in G. I. Frequencies of distinct types of responses in experiment with YUMM1.7 tumors shown in G. J. Body weight changes during the course of treatment in C57Bl mice bearing YUMM10.1 tumors and in nude mice bearing PDX1595 tumors. K. Serum concentrations of AST and ALT in mice bearing PDX1826 tumors and treated as shown in C. Statistics calculated on log-transformed values with one-way ANOVA and Dunnett’s post-test.
Figure 6.
Figure 6.. CDK4/6i and MDM2i combination reduces proliferation and induces expression of immune-related proteins and p53 in PDX tumors.
A. IHC staining of Ki67 in tumors shown in 5B. Scale bar: 0.1 mm. B. Quantification of the percentages of Ki67-positive cells in tumors shown in 5B. Statistical analysis performed using two-way ANOVA after log transformation with Tukey’s test for multiple comparisons. C. Heat map of proteins up- and down-regulated by ribociclib (CDK4/6i), CGM097 (MDM2i), and combination of both drugs (Combo) in PDX tumors 1642, 1688, 1179, 1826, and 1460 treated as shown in Figure 5B. Analysis by quantitative ELISA-based proteomics performed by Ray Biotech. D. Heat map of p53 protein expression in 5 indicated PDX tumors treated with ribociclib (CDK4/6i), CGM097 (MDM2i), and combination of both drugs (Combo) as shown in Fig. 5B.
Figure 7.
Figure 7.. Ex vivo slice culture model recapitulates tumor response to CDK4/6i and MDM2i.
A. Diagram depicting an experimental setup of organotypic PDX tumor explant (PDXE) culture and representative image of PDXE. B. Representative photomicrographs of Ki67 IHC staining in PDXEs treated ex vivo with 2.5 μM of ribociclib, 2.5 μM of CGM097, the combination of both drugs, or vehicle for 3 days. Scale bar: 0.1 mm. C. Summary of the Ki67 staining in indicated PDXEs treated as described in A. Statistical analysis with two-way ANOVA after log-transformation with Tukey’s multiple comparison test. D. Western Blot analysis of PDXEs treated as described in A. E. Proposed model of CDK4/6i resistance in melanoma. Pathways associated with therapeutic resistance are indicated by red connecting arrows and lines, whereas pathways facilitating response are marked by blue connections. CDKs are orange, and cyclins are yellow. All other proteins are shown in blue.

References

    1. Gide TN, Wilmott JS, Scolyer RA, Long GV, Primary and Acquired Resistance to Immune Checkpoint Inhibitors in Metastatic Melanoma. Clin. Cancer Res 24, 1260–1270 (2018). - PubMed
    1. Robert C, Karaszewska B, Schachter J, Rutkowski P, Mackiewicz A, Stroiakovski D, Lichinitser M, Dummer R, Grange F, Mortier L, Chiarion-Sileni V, Drucis K, Krajsova I, Hauschild A, Lorigan P, Wolter P, Long GV, Flaherty K, Nathan P, Ribas A, Martin AM, Sun P, Crist W, Legos J, Rubin SD, Little SM, Schadendorf D, Improved overall survival in melanoma with combined dabrafenib and trametinib. N Engl J Med 372, 30–39 (2015). - PubMed
    1. Sosman JA, Kim KB, Schuchter L, Gonzalez R, Pavlick AC, Weber JS, McArthur GA, Hutson TE, Moschos SJ, Flaherty KT, Hersey P, Kefford R, Lawrence D, Puzanov I, Lewis KD, Amaravadi RK, Chmielowski B, Lawrence HJ, Shyr Y, Ye F, Li J, Nolop KB, Lee RJ, Joe AK, Ribas A, Survival in BRAF V600-mutant advanced melanoma treated with vemurafenib. N Engl J Med 366, 707–714 (2012). - PMC - PubMed
    1. Johnson DB, Puzanov I, Treatment of NRAS-mutant melanoma. Curr. Treat. Options Oncol 16, 15 (2015). - PMC - PubMed
    1. Young RJ, Waldeck K, Martin C, Foo JH, Cameron DP, Kirby L, Do HD, Mitchell C, Cullinane C, Liu W, Fox SB, Dutton-Regester K, Hayward NK, Jene N, Dobrovic A, Pearson RB, Christensen JG, Randolph S, McArthur GA, Sheppard KE, Loss of CDKN2A expression is a frequent event in primary invasive melanoma and correlates with sensitivity to the CDK4/6 inhibitor PD0332991 in melanoma cell lines. Pigm Cell Melanoma R 27, (2014). - PubMed

Publication types

MeSH terms

Substances